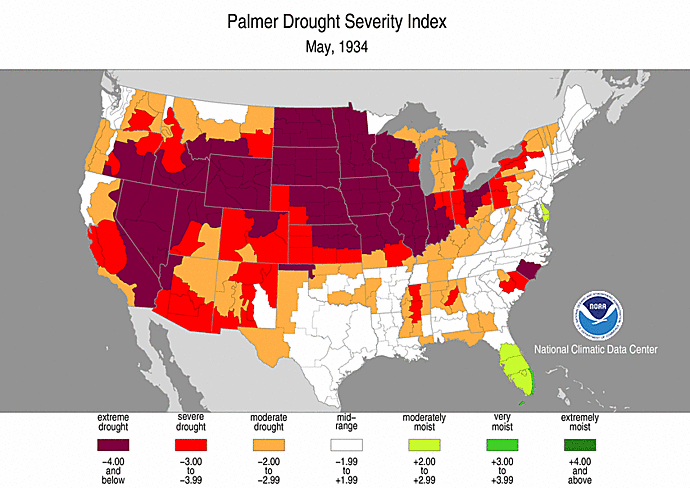
The whole aim of practical politics is to keep the populace alarmed (and hence clamorous to be led to safety) by menacing it with an endless series of hobgoblins, all of them imaginary.
In 1969, the world’s most famous environmental scientist (Paul Ehrlich of Stanford) warned we would all die by 1989 in a cloud of blue steam.
“The trouble with almost all environmental problems,” says Paul R. Ehrlich, the population biologist, “is that by the time’ we have enough evidence to convince people, you’re dead.”
“We must realize that unless we are extremely lucky, everybody will disappear in a cloud of blue steam in 20 years”
- New York Times August 10, 1969, Page 53
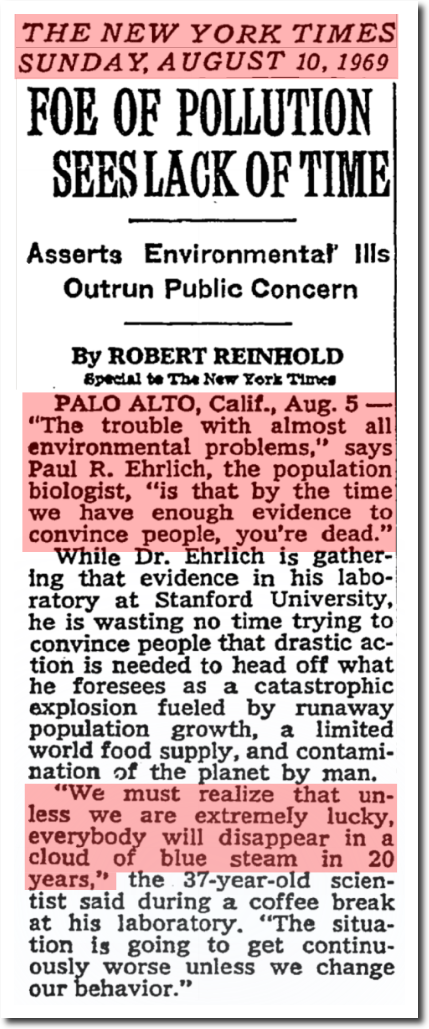
FOE OF POLLUTION SEES LACK OF TIME The New York Times
A year later he said we would run out of water by 1974, and out of food by 1980.
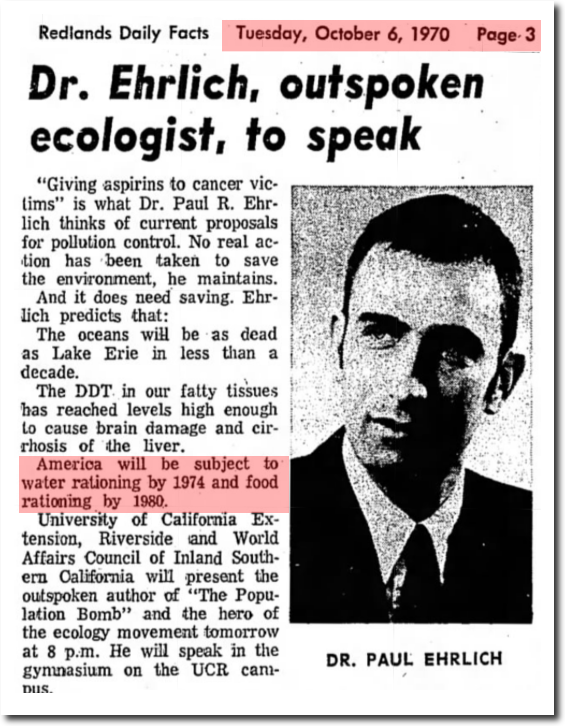
06 Oct 1970, Page 3 – Redlands Daily Facts at Newspapers.com
Two years later, the world’s leading climate experts warned President Nixon about a new ice age “in about a century.”
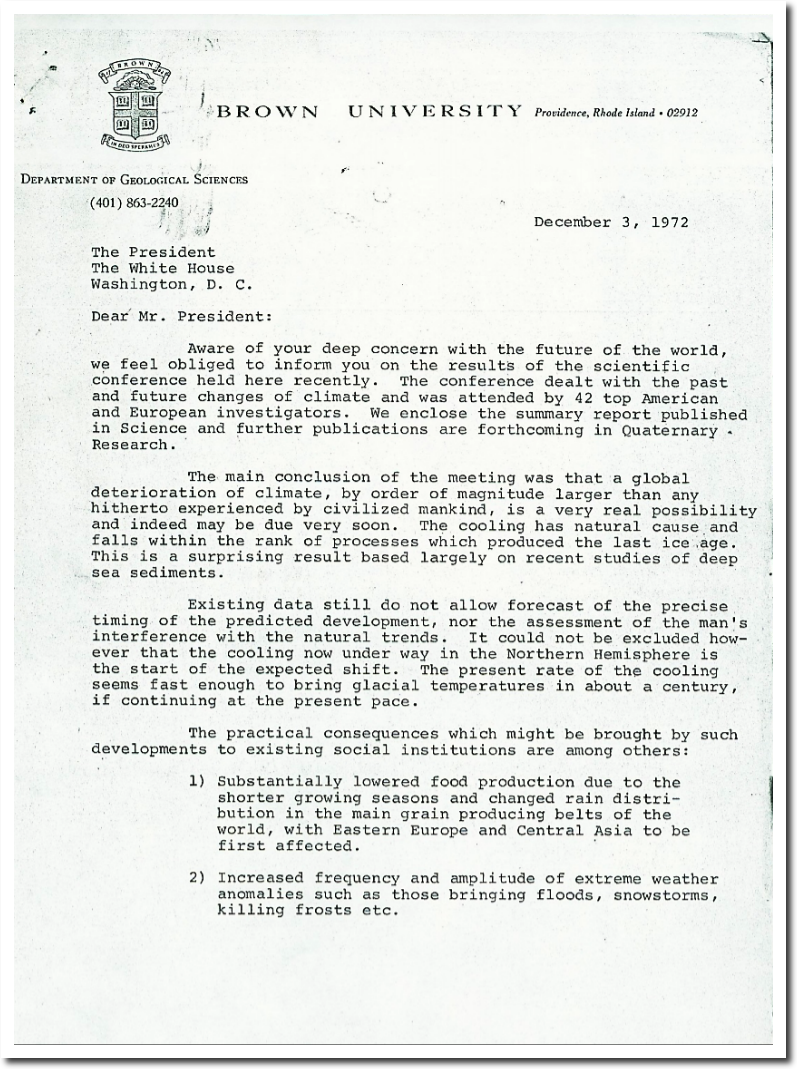
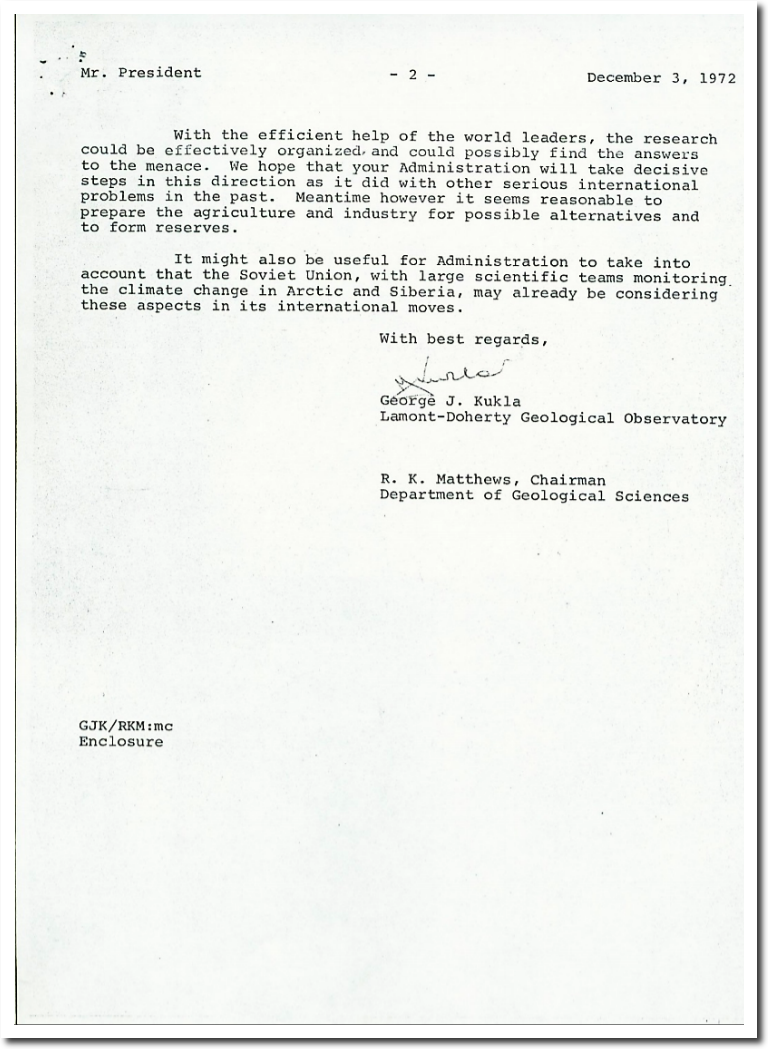
THE ROLE OF NOAA’S CLIMATE PREDICTION CENTER IN THE DEVELOPMENT OF CLIMATE SERVICES
We didn’t run out of water by 1974 as Paul Ehrlich predicted, so he switched over to the global cooling scam.
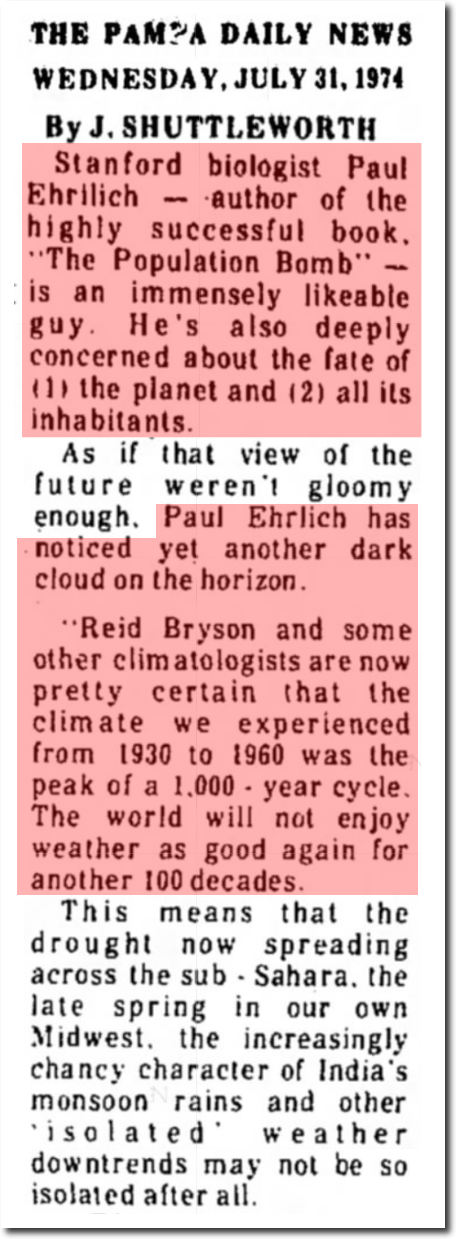
31 Jul 1974, Page 7 – Pampa Daily News at Newspapers.com
In 1974, Steven Schneider took the scientific consensus of global cooling to the White House.
climatic researchers are becoming alarmed that in the next 10 to 100 years humanity will be unable to feed itself
So writes Stephen Schneider, a young climatologist at the National Center for Atmospheric Research in Boulder, Colo., reflecting the consensus of the climatological community in his new book, “The Genesis Strategy.” His warning, that present world food reserves are an insufficient hedge against future famines, has been heard among the scientific community for years—for example, it was a conclusion of a 1975 National Academy of Sciences report. But Schneider has decided to explain the entire problem, as responsibly and accurately as he can, to the general public, and thus has put together a useful and important book.
It is a matter, as Schneider explains, of statistics. The last 15,000 years have been unusually warm when compared to global temperatures for the last 150,000. The last 200 years have been unusually warm when compared to the last 1,000. But there is considerable evidence that this warm period is passing and that temperatures on the whole will get colder. For example, in the last 100 years mid?latitude air temperatures peaked at an all?time warm point in the 1940’s and?have been cooling ever since.
In 1974 Schneider and Bryson tried to explain to a White House policy?making group why conditions are likely to worsen. One of the most depressing anecdotes in the book is Schneider’s description of the deaf ear their warnings received.
- New York Times July 18, 1976
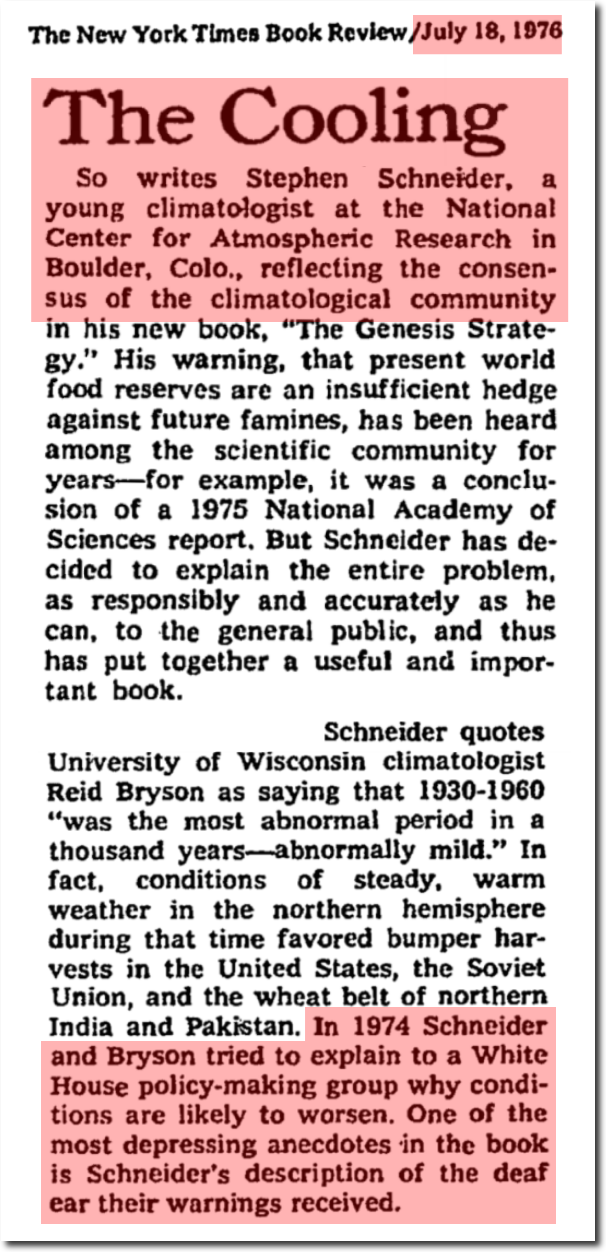
The Genesis Strategy – The New York Times
Three years later President Carter warned that we would run out of oil before 2010.
The hard truth, as the Carter Administration sees it, is that the world’s oil supplies cannot much longer sustain the world’s increasing oil consumption.
if consumption then continued at the same level, the world’s oil would disappear in the first decade of the 21st century. Oil consumption therefore has to be reduced here and throughout the world, and new energy sources have to be developed.
- New York Times March 4, 1977
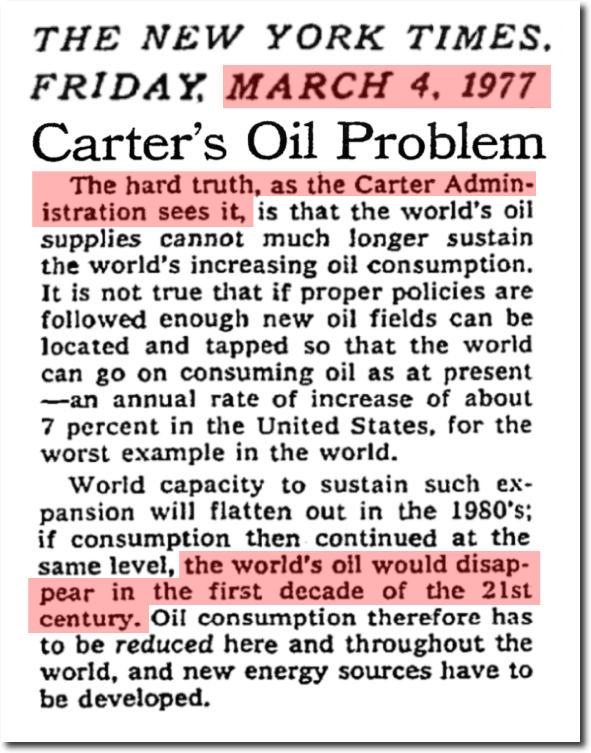
Carter’s Oil Problem – The New York Times
Two years later, experts determined that nuclear reactors were going to melt through the Earth all the way to China, and that Pennsylvania would be made uninhabitable.
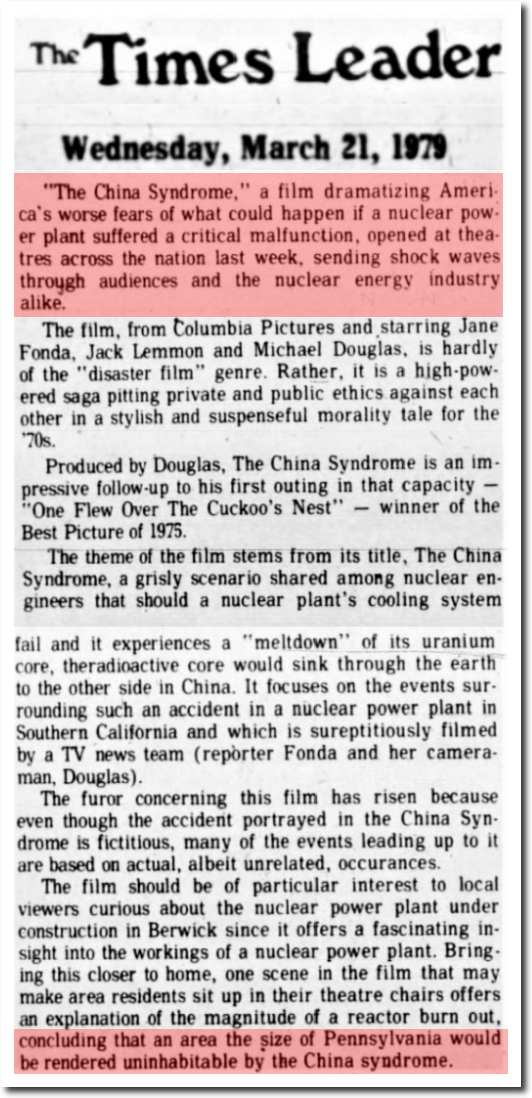
21 Mar 1979, 4 – The Times Leader at Newspapers.com
That didn’t happen, so a year later “frightened” experts decided that acid rain was going to make Pennsylvania uninhabitable, and all they needed was $100 million dollars to fix it.
“Acid rain …… It’s a lot worse than we thought”
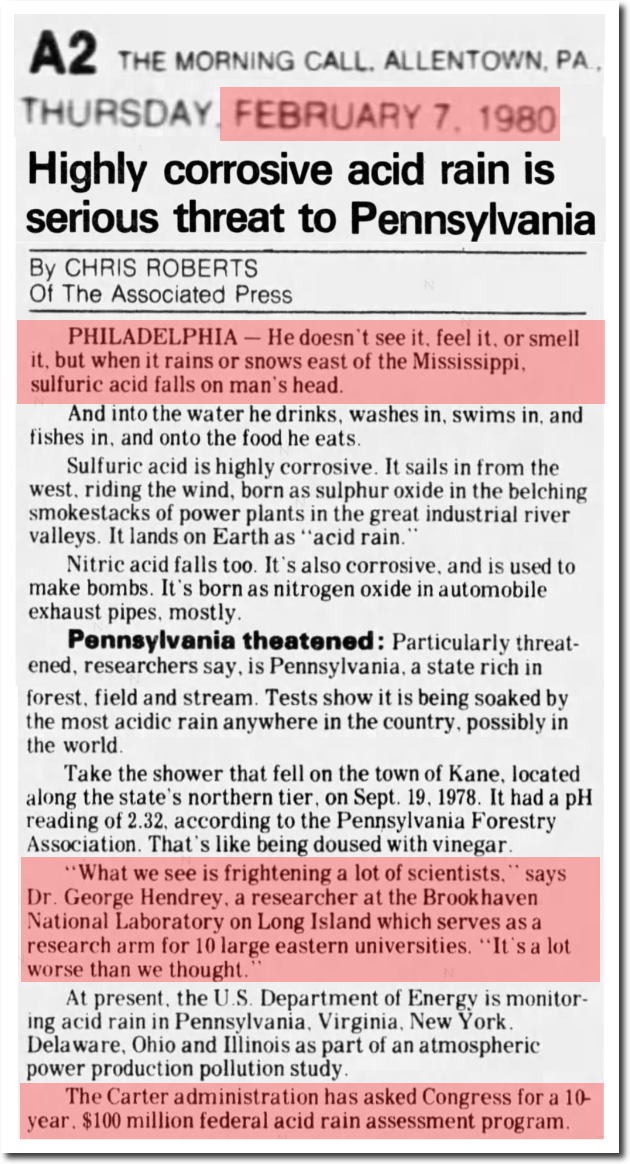
07 Feb 1980, 2 – The Morning Call at Newspapers.com
What stands out for me is the $100 million. Scientists now expect $billions for their scams.