I’m in New Mexico today taking pictures of some of the locals.







I’m in New Mexico today taking pictures of some of the locals.
There has been no change in Arctic sea ice extent since yesterday. Any ice loss would show up as red in the image below.
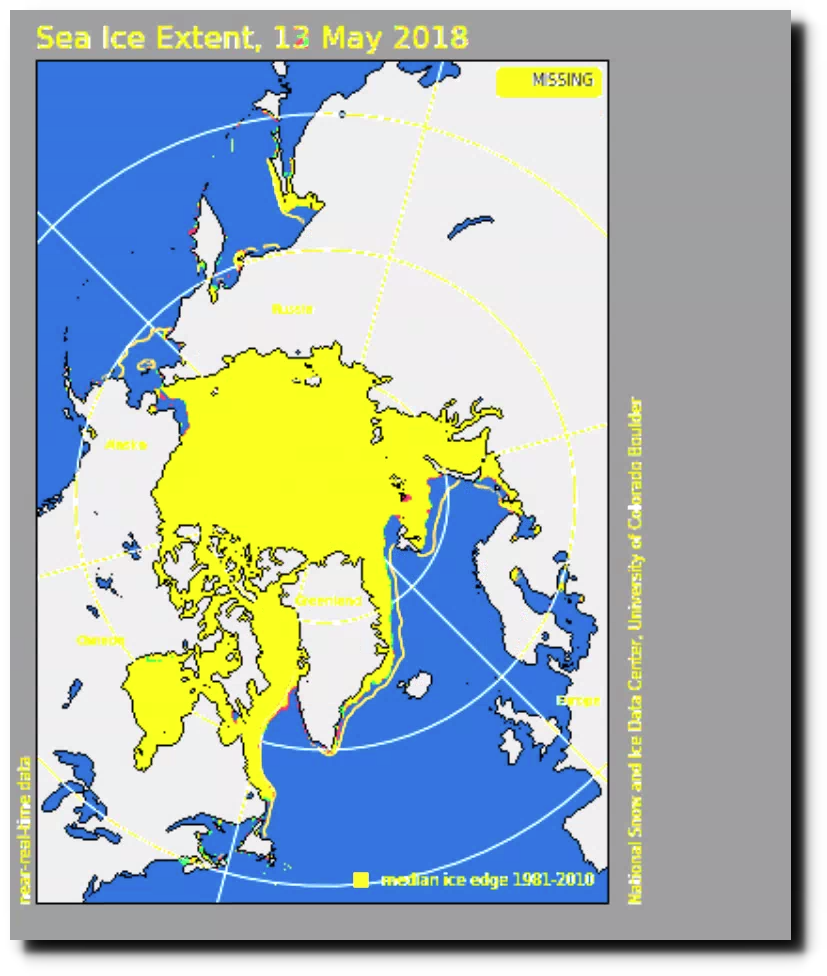
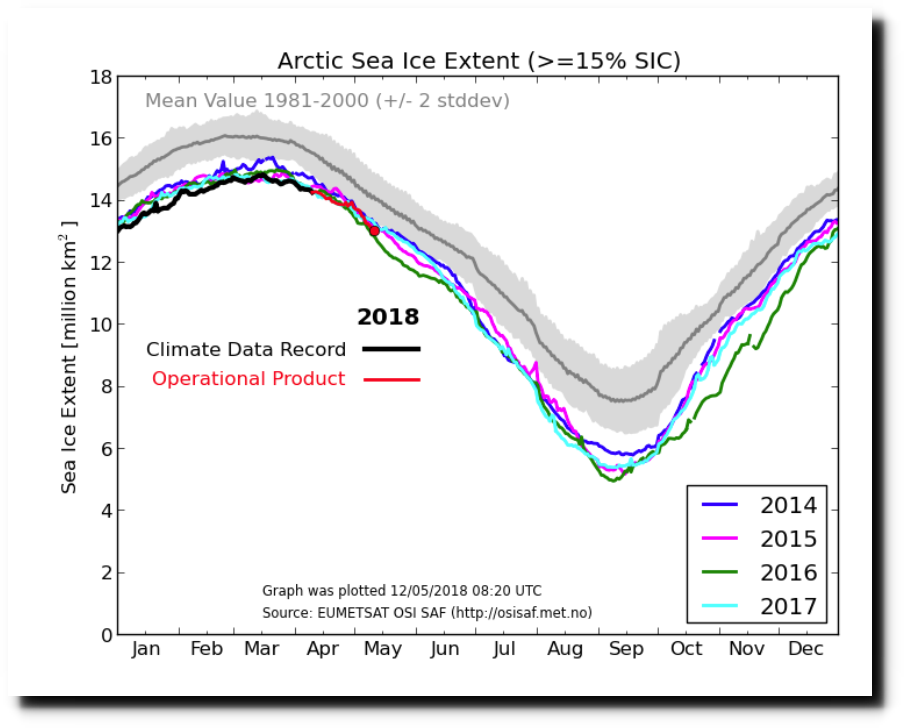
Yet our fake government agencies continue to show Arctic sea ice rapidly declining. I have no idea what they are up to. When things are working correctly, I see very close correlation between the maps and graphs.
On September 24, 2015 Obama made a “climate deal” with China. I immediately identified the deal as fraudulent, and blogged that China had no intention of cutting their emissions. And of course their emissions don’t have anything to do with climate, so the deal was doubly fraudulent.
Only a complete moron like a New York Times writer would believe that China would actually implement such a plan.
Chinese CO2 emissions have tripled over the last 15 years, and under this agreement will continue to grow for the next 15 years. By the year 2030, their CO2 emissions will be about 400% of US emissions.
Obama Agrees To Let China CO2 Emissions Grow For 15 More Years | The Deplorable Climate Science Blog
And blogged about it several times since then.
Barack Obama’s “Climate Deal” With China | The Deplorable Climate Science Blog
My forecast was correct.

Climate Change Conference Collapses as China Backs Down from Emission Commitments
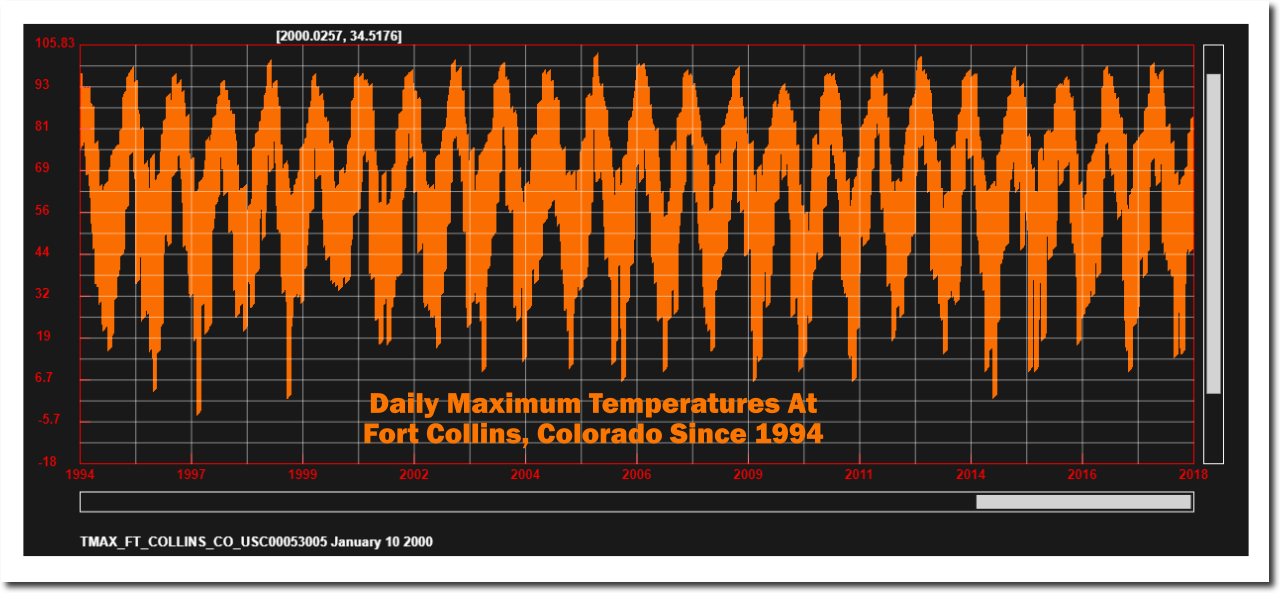
It was easy to be a global warming true believer 20 years ago – I certainly was. During the winter of 1999-2000, the Front Range of Colorado did not have a single day which didn’t get above freezing. Since then, winter temperatures have declined sharply, and intelligent people have quit clinging to the global warming scam.
NSIDC maps show a 2% decline (red below) in Arctic sea ice extent since May 1.

Graphs from both NSIDC and DMI show a 6% decline since May 1.
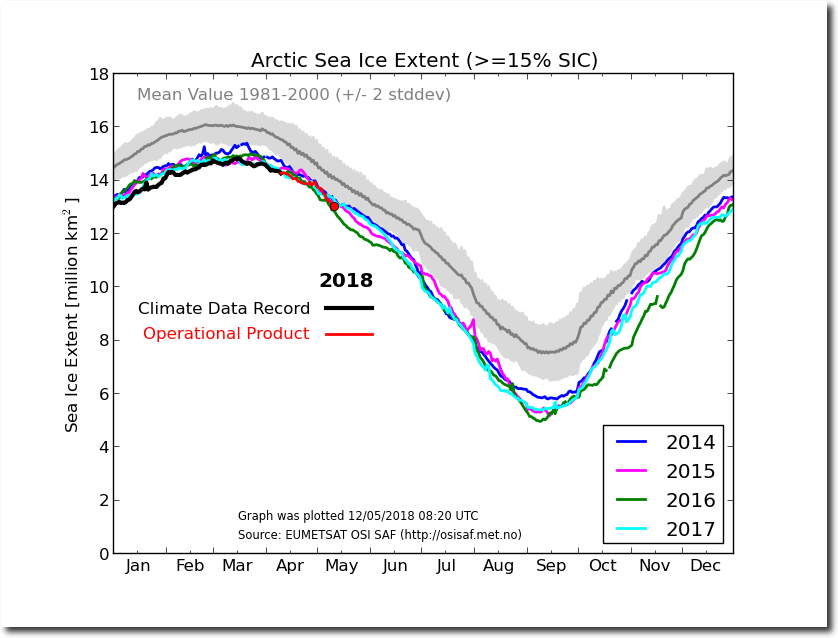
Ocean and Ice Services | Danmarks Meteorologiske Institut
Just more of the usual BS from the same people.
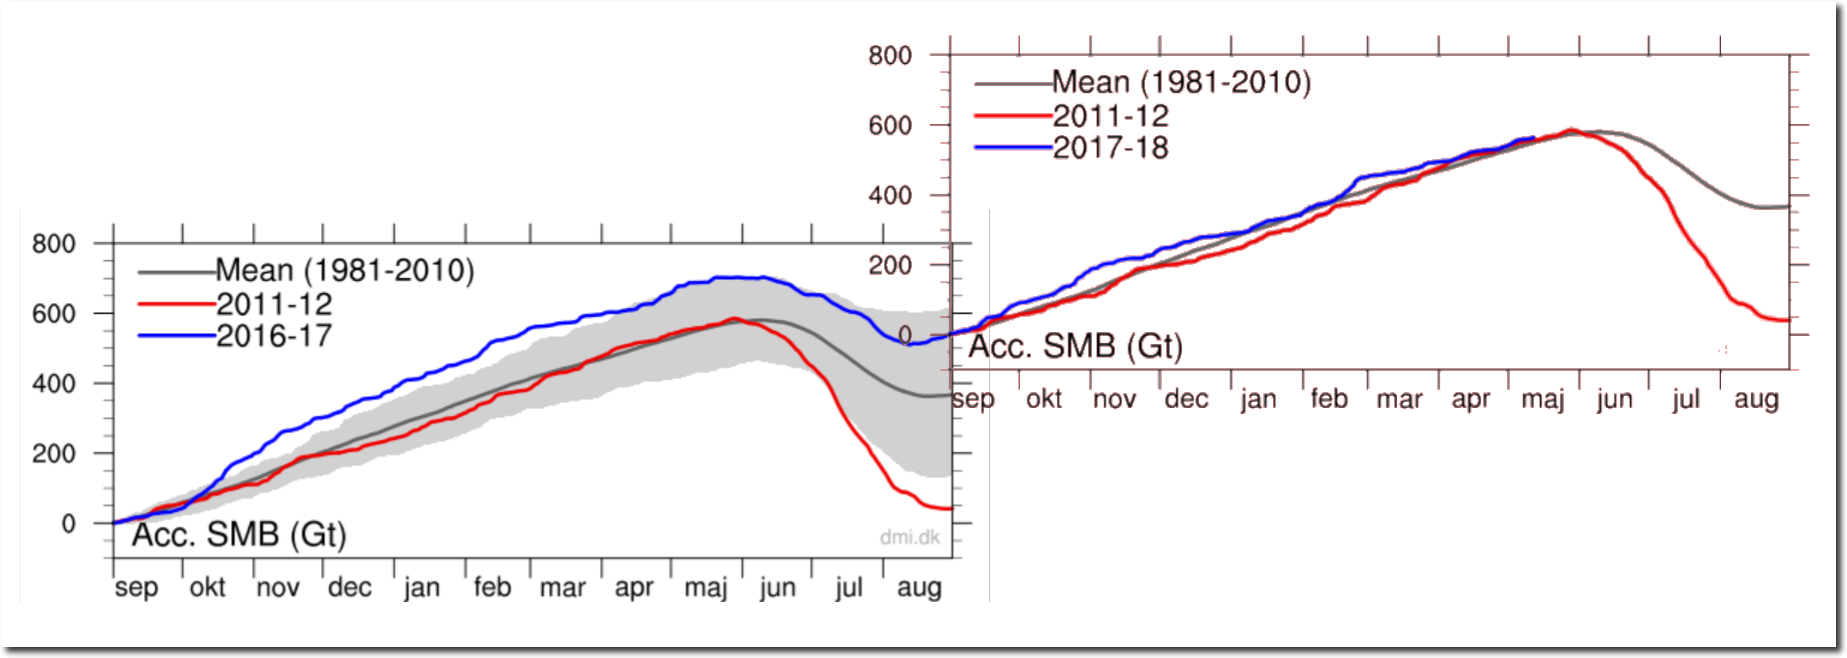
Since September 2016, Greenland’s surface has gained a trillion tons of new ice.
Two years ago, Greenland had a warm day in April, and that was cited as proof of global warming. Since then, almost every single day has had below normal melt, but that is just weather.
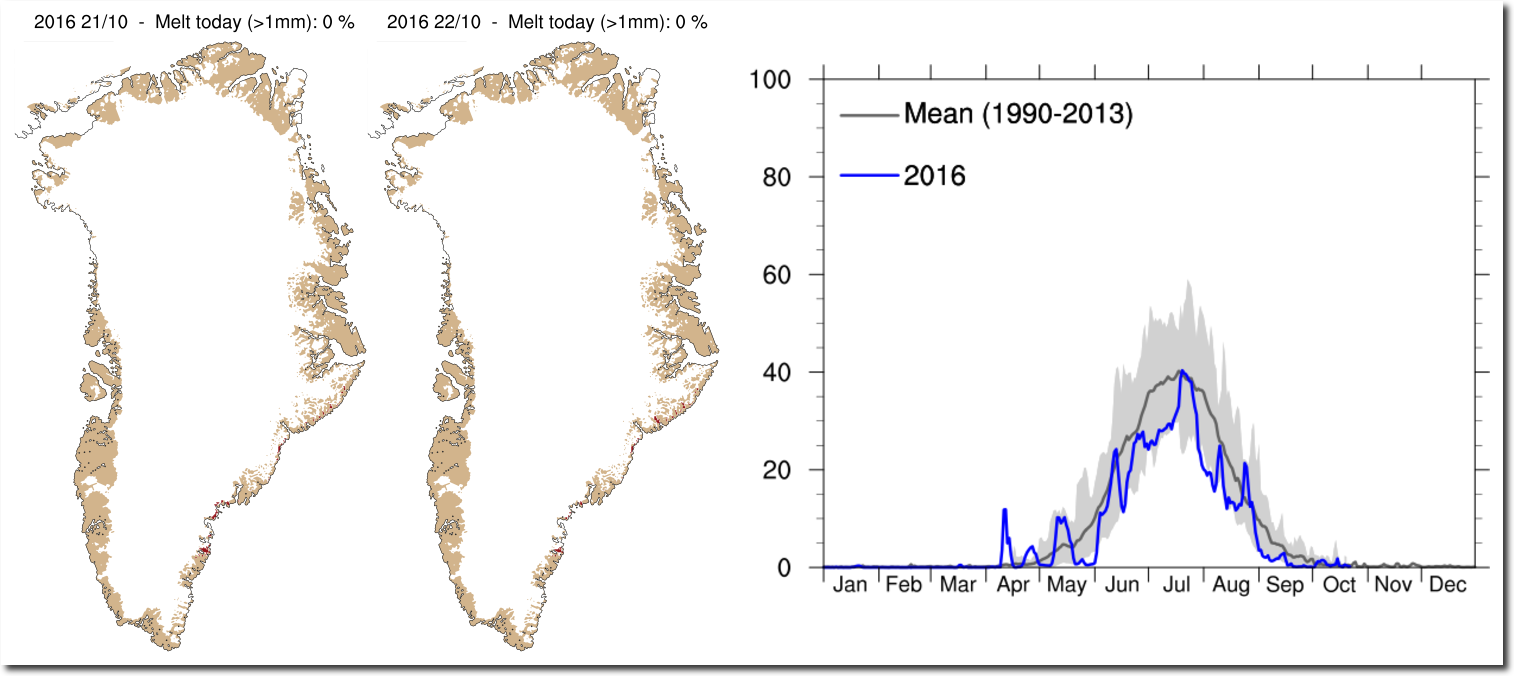
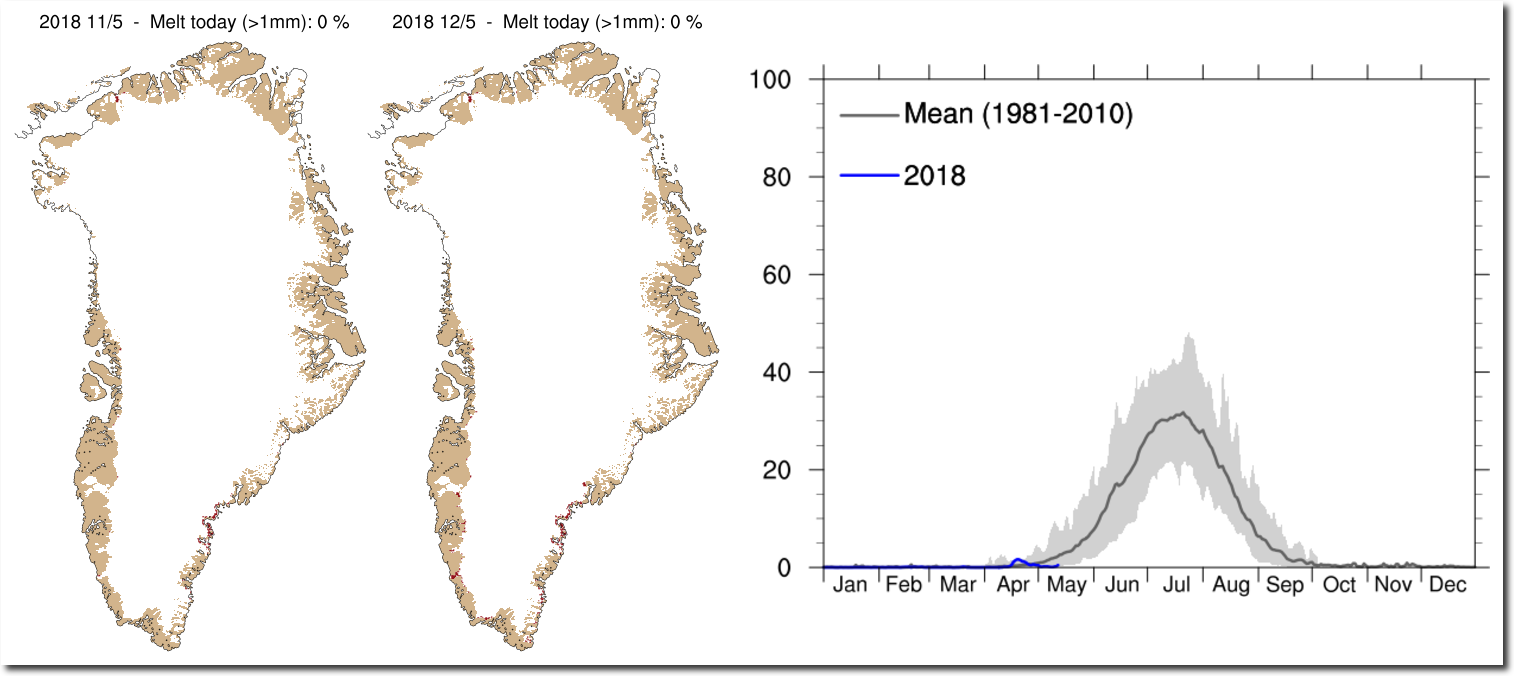
The constant stream of lies from climate scientists never ceases.
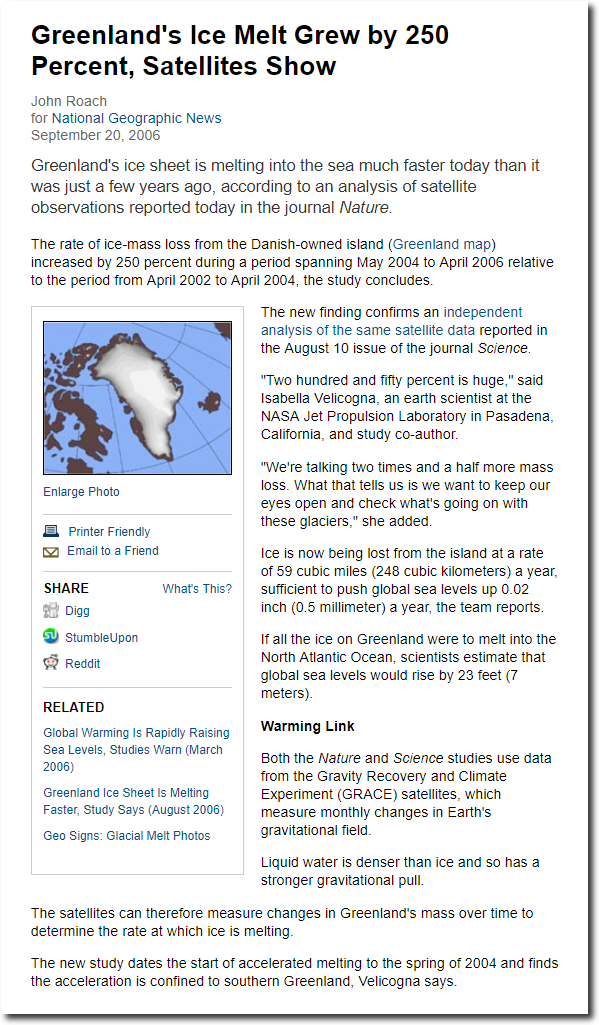
Greenland’s Ice Melt Grew by 250 Percent, Satellites Show
Ice does not melt at -20C.
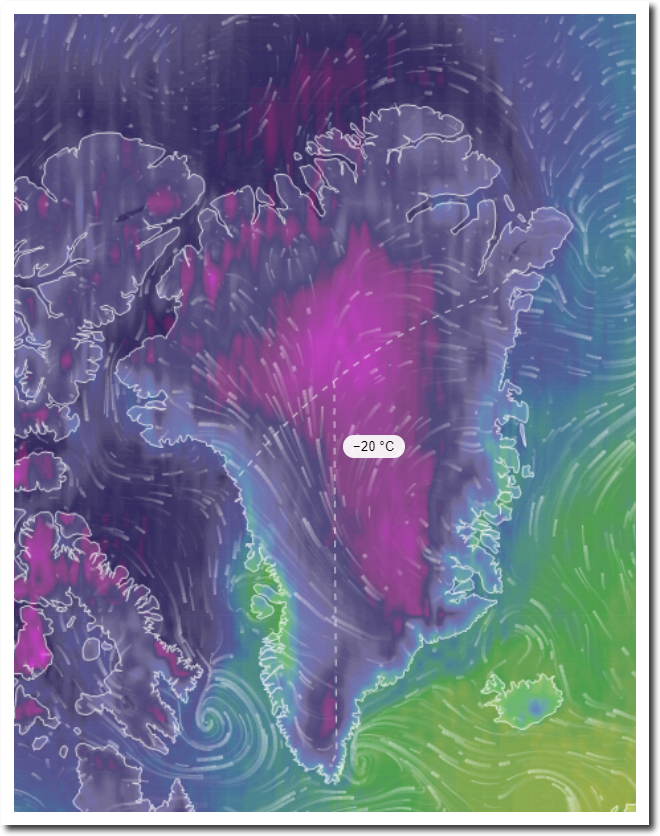
Despite all the endless hysterics from climate alarmists, there has been no change in Arctic sea ice extent since the start of MASIE records in 2006.

July, 1936 was about 15 degrees hotter than July, 2017 in the Midwest. The animation below shows the daily maximum temperatures at all Midwest USHCN stations during both years.
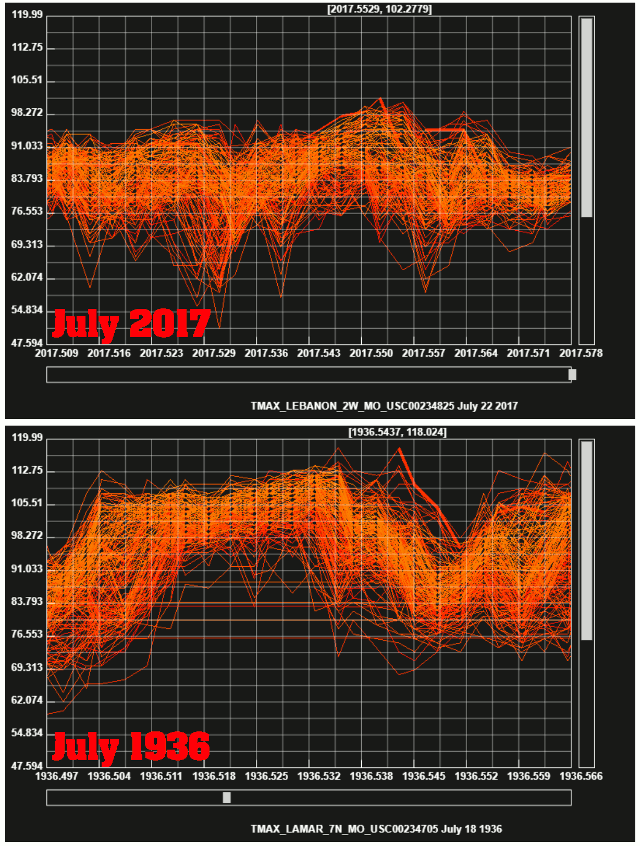
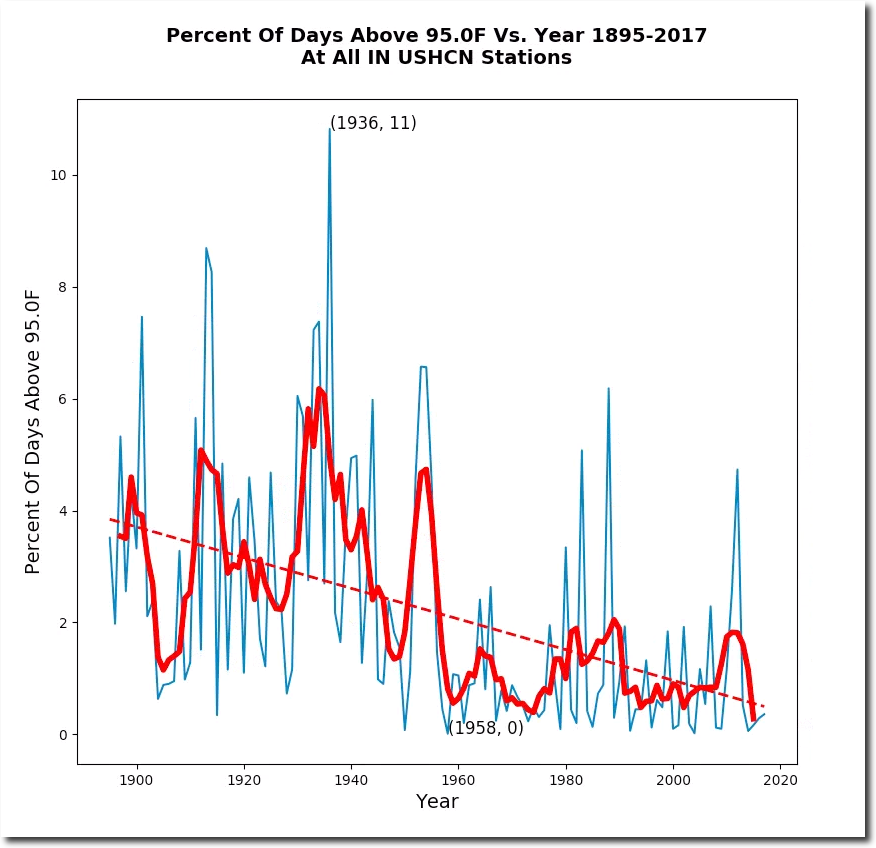
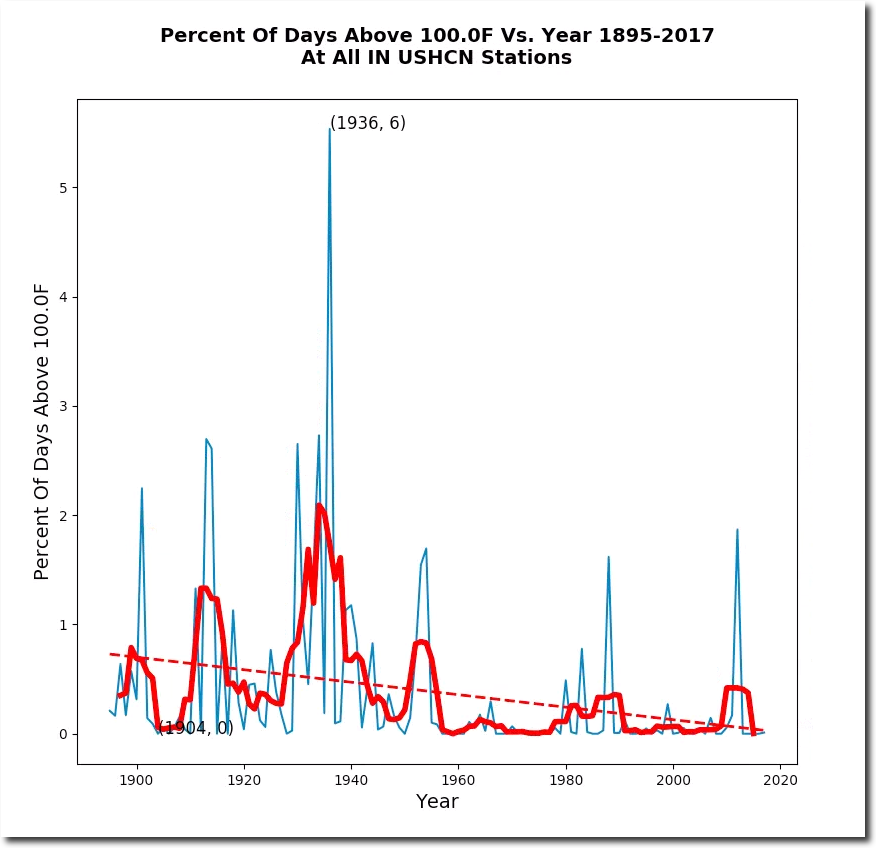
During the summer of 1936, Indiana had 100 degree temperatures from June 15 to September 16, with a peak temperature of 114 degrees on July 14. If this happened now, climate scientists would be 100% certain it was due to man-made CO2 and demand immediate world communism.
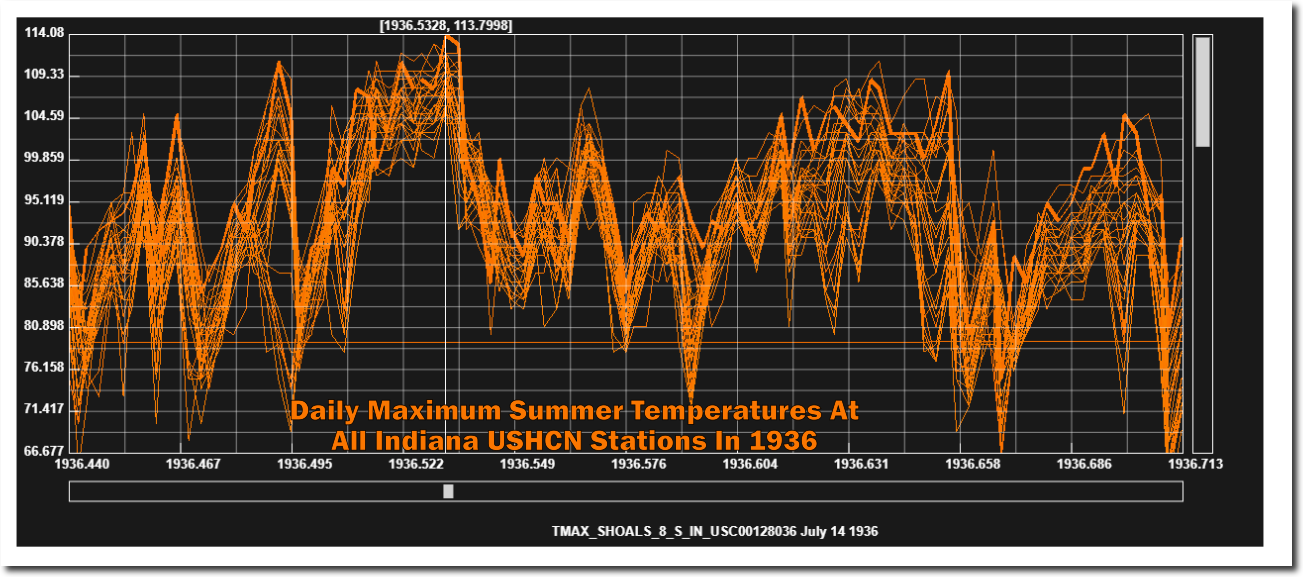
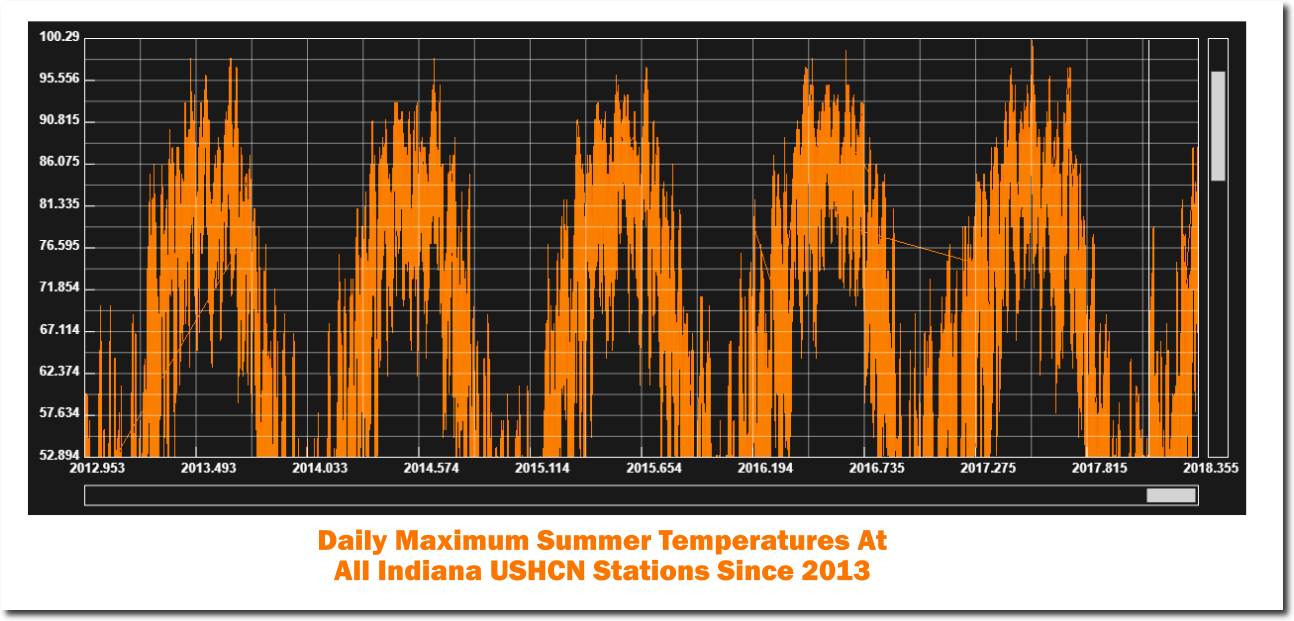
Over the past five years, Indiana has only recorded one (barely) 100 degree temperature.
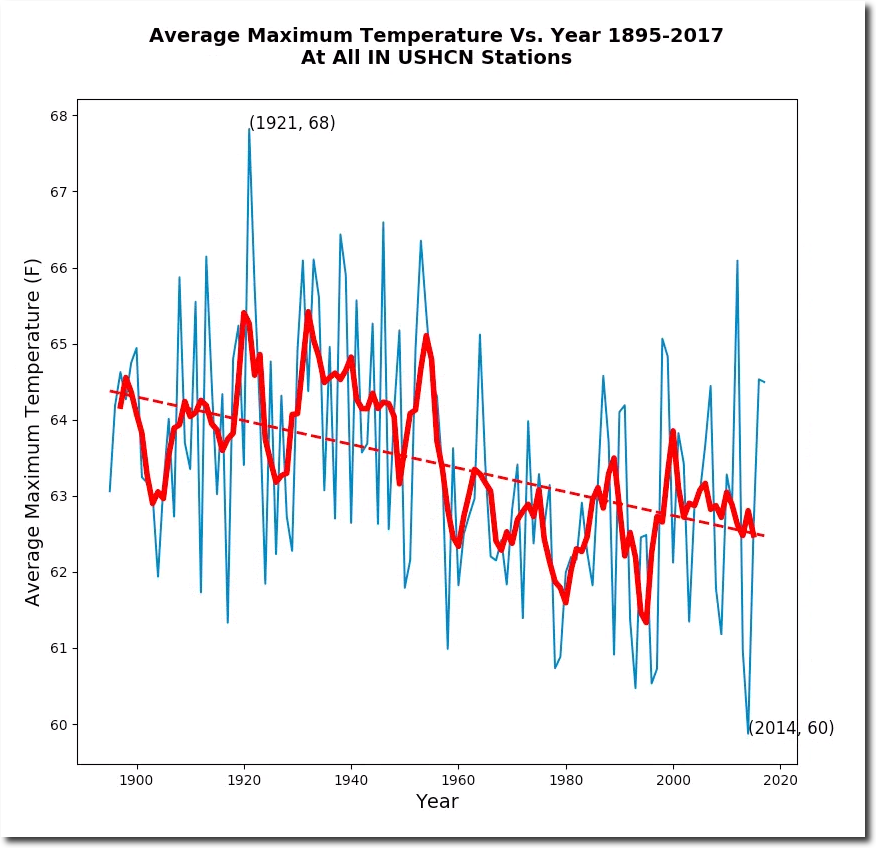
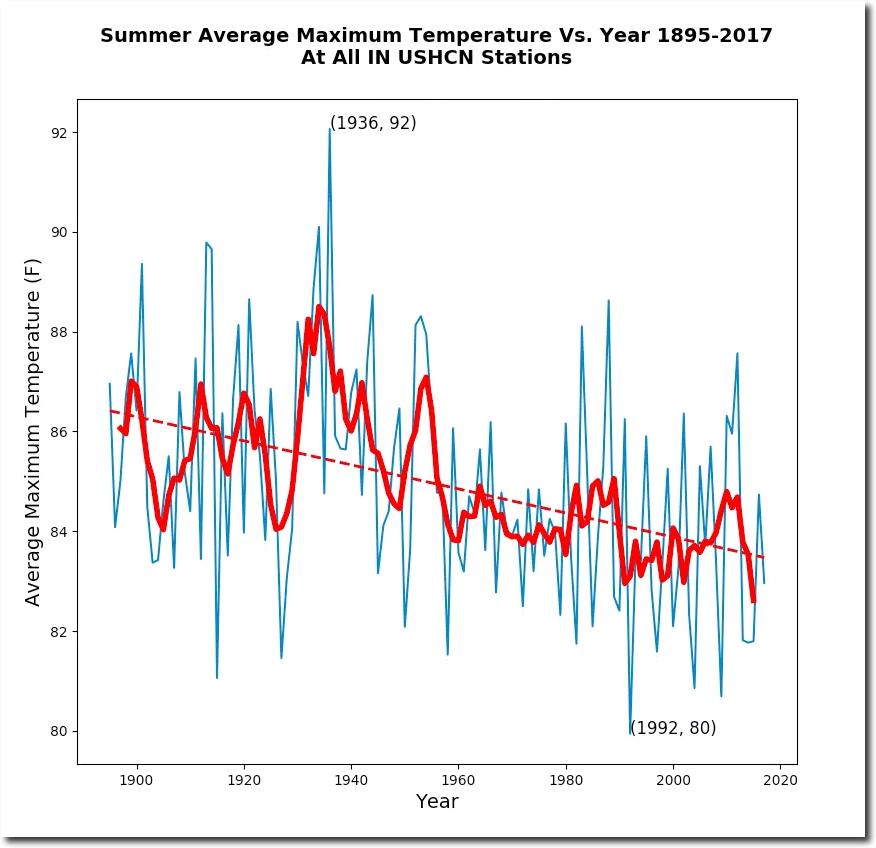
Afternoon temperatures have been plummeting in Indiana since the 19th century, and the frequency of hot days has also plummeted.
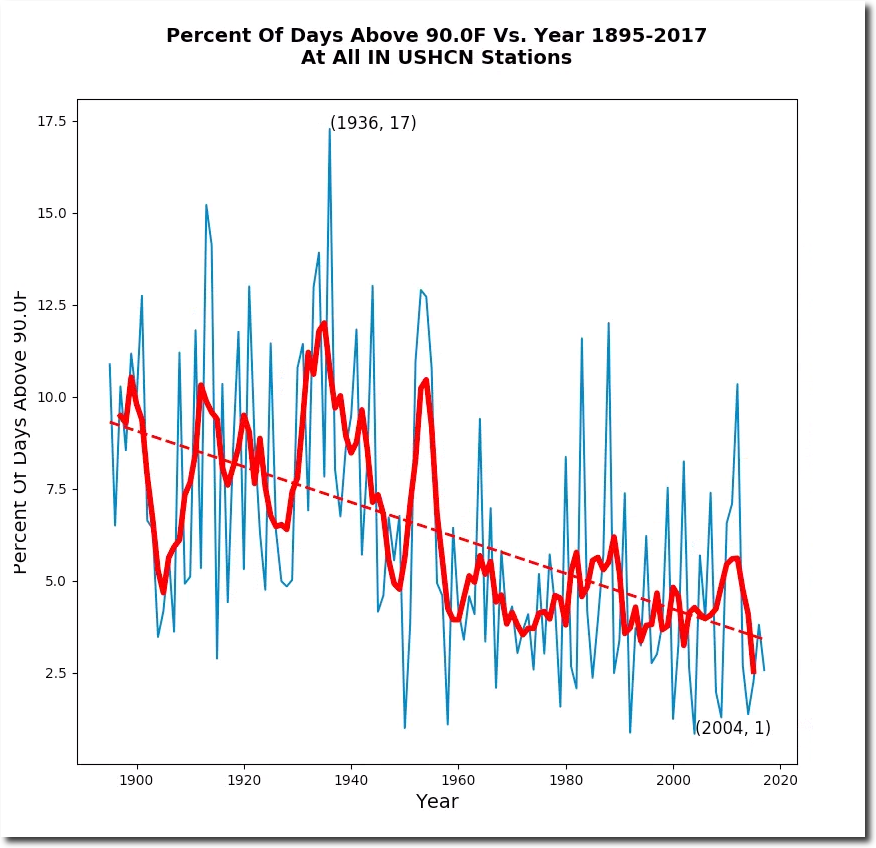
The fraudsters at Heidi Cullen’s Climate Central claim that Indiana summers are going to increase from an average of 83 degrees to 94 degrees.
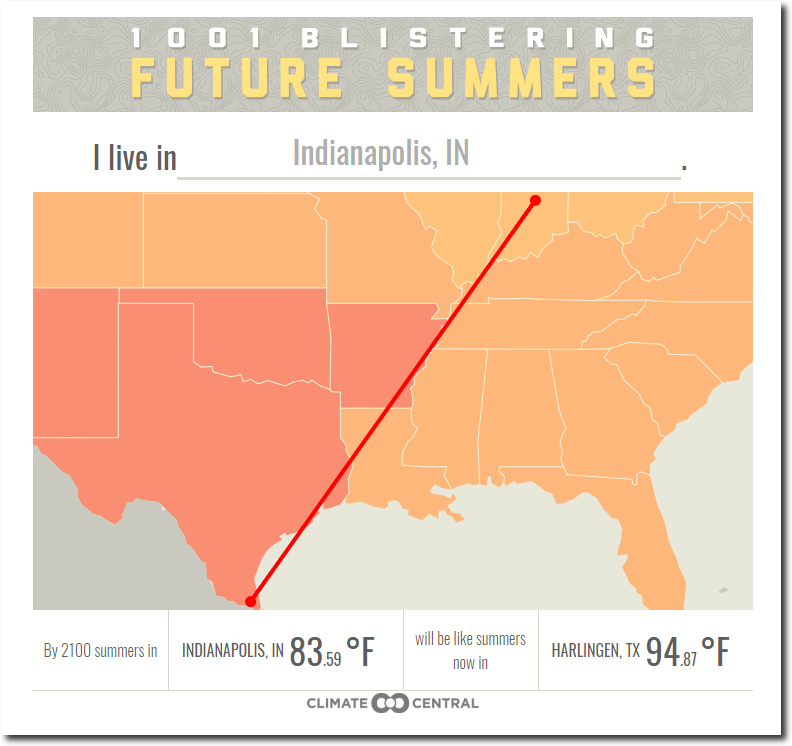
Blistering Future Summers for 1,001 U.S. Cities | Climate Central
Summer temperatures are doing the exact opposite of what Climate Central claims, having declined from 92 degrees in 1936 to about 83 degrees in recent years.
Fraud is the norm and the gold standard of climate science, which is why fake news organizations like the New York Times and CNN write articles about me, but won’t talk to me.
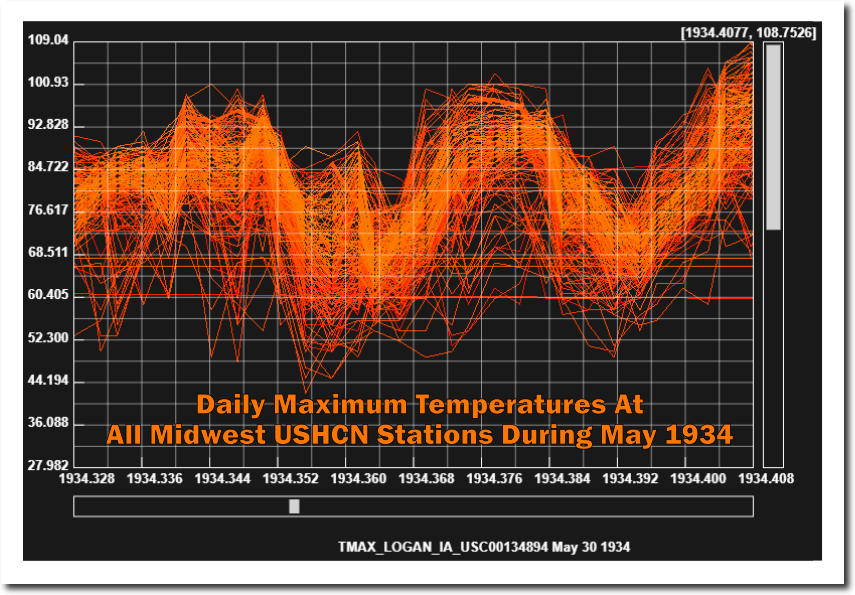
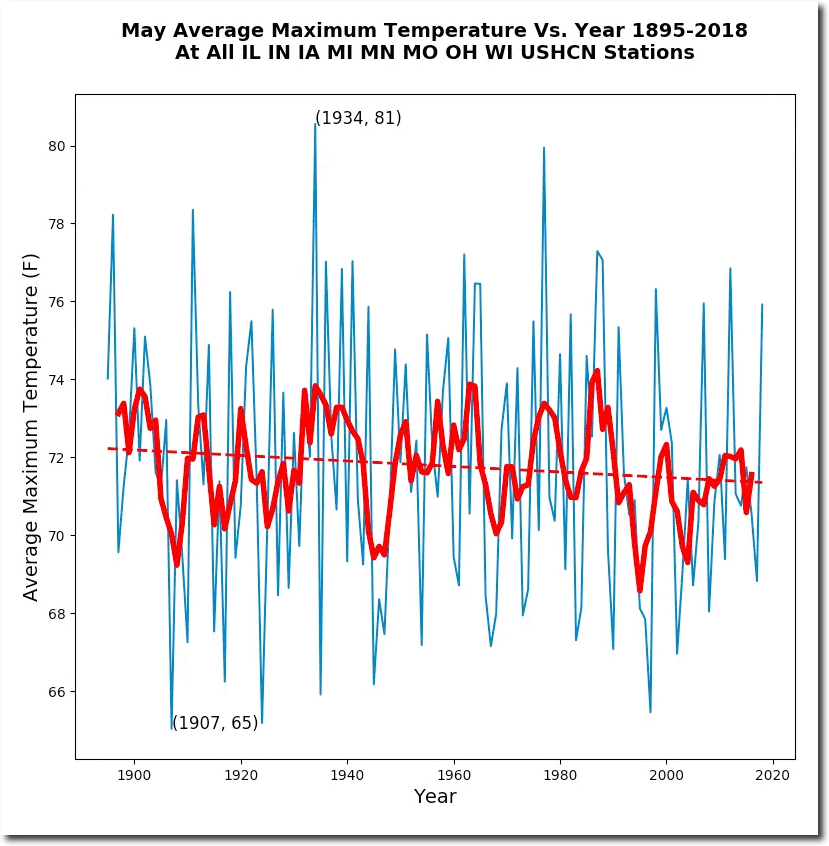
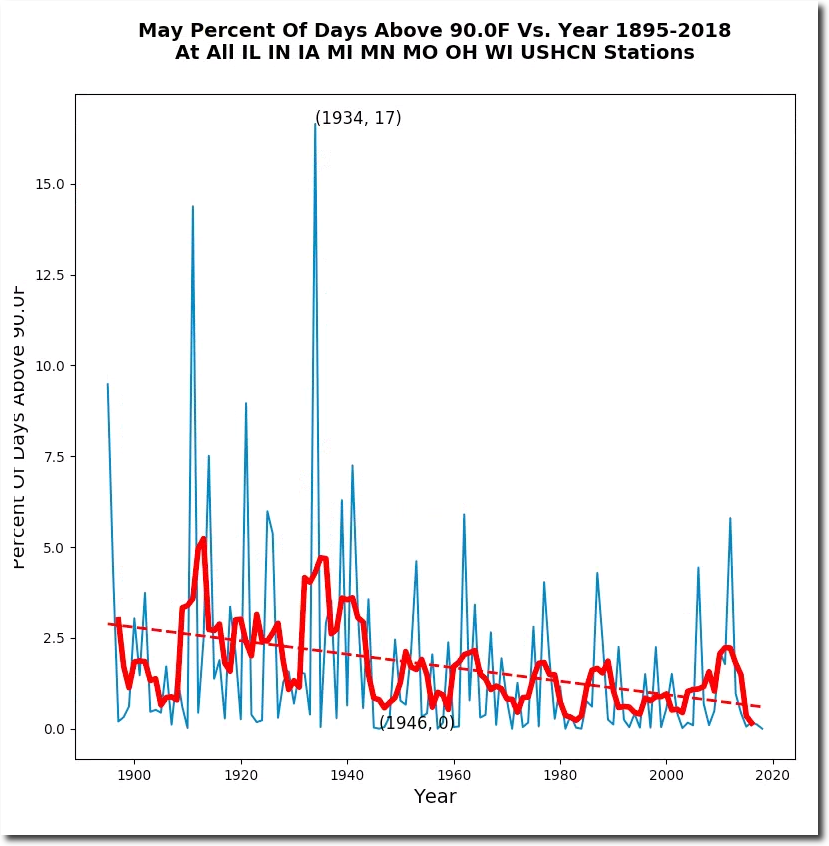
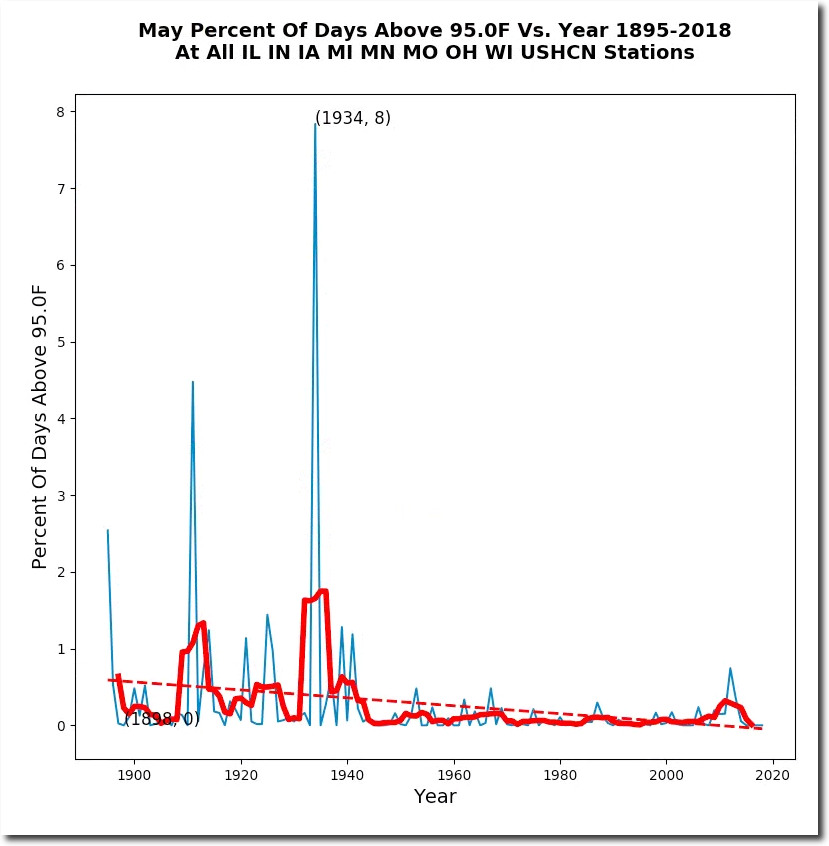
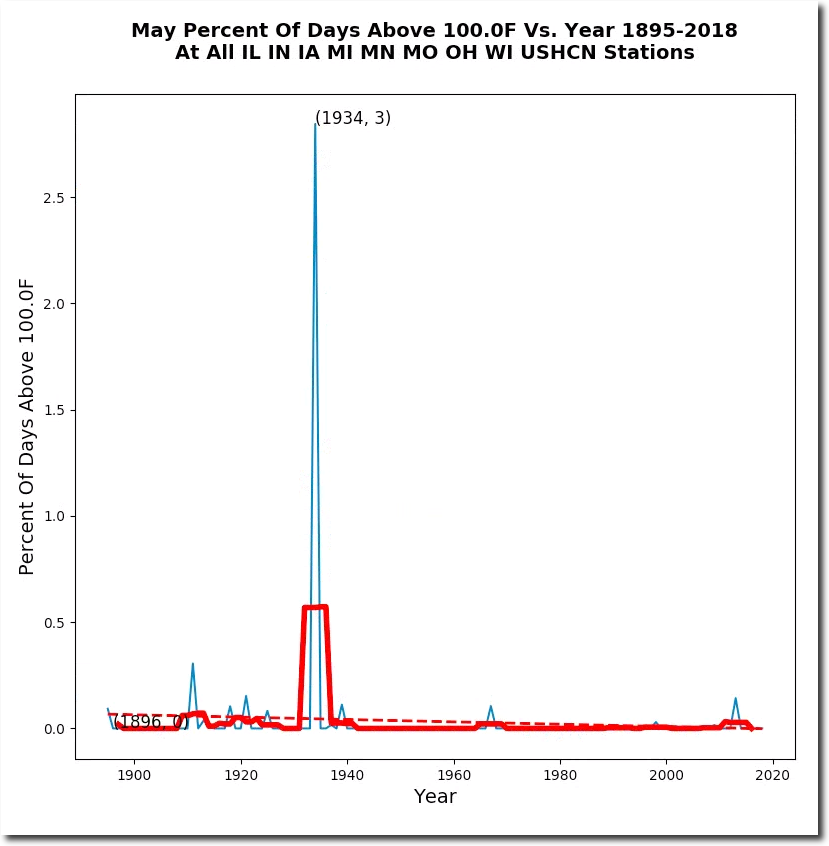
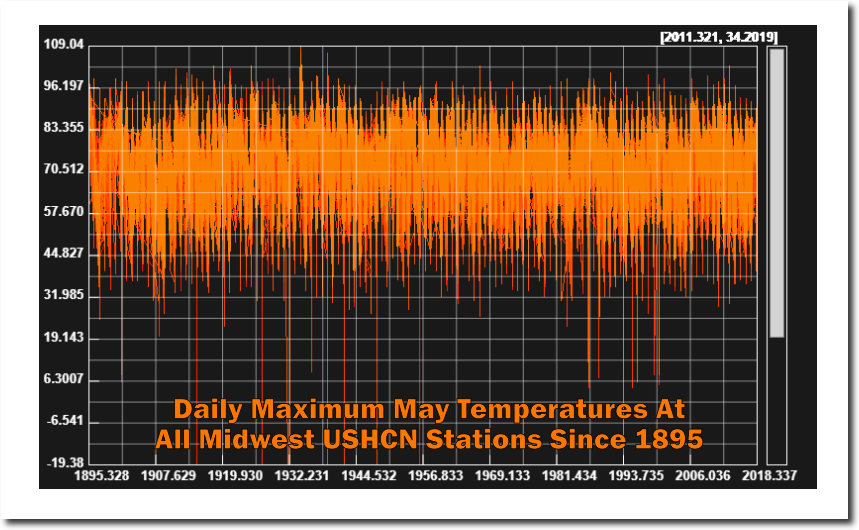
Ninety-five degree temperatures were common in the Midwest during May prior to 1940, but almost never happen any more. May afternoon temperatures have been declining in the Midwest since the 19th century. The hottest May (by far) was 1934, when 100 degree temperatures were widespread across the Midwest, including 101 degrees at Algona, Iowa on May 7th, 1934.
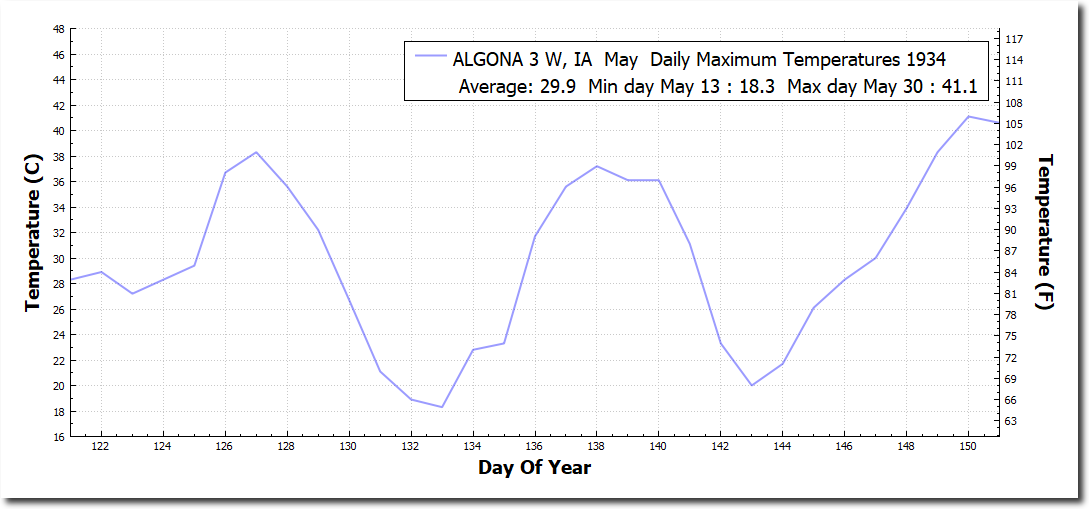
By May 30th, 1934 – the Midwest was seeing temperatures of 109 degrees.