

Disrupting the Borg is expensive and time consuming!

Google Search
-
Recent Posts
- Greenland Ice Update
- Wyoming Gold
- Three Years Since The Apocalypse
- Arctic Report card Summer 2026
- Elon Pushing Pushing Geoengineering
- Earth, Wind And Fire
- On The Road Again
- Vandalism At The Reflecting Pool
- Fifty Years Ago Today
- Truth Or Consequences
- US Climate Trend Maps
- Declining Spring Snow Cover In Northern New Mexico
- You Can’t Fool Mother Nature
- Cattle And The Climate
- One Atomic Bomb Per Hour
- New Video : Analyzing Oil And Gas
- Is Antarctica Melting?
- High Speed Analysis And Visualization
- El Nino To The Rescue?
- Fake News Update
- Growth Of Antarctic Sea Ice
- 65 Years Of Progress!
- El Nino To The Rescue?
- Worst March Drought On Record
- ChartGL Process Control Demo
Recent Comments
- Terry Shipman on Wyoming Gold
- Crispin Pemberton-Pigott on Wyoming Gold
- Bob G on Three Years Since The Apocalypse
- conrad ziefle on Three Years Since The Apocalypse
- Robertvd on Three Years Since The Apocalypse
- conrad ziefle on Three Years Since The Apocalypse
- Bob G on Three Years Since The Apocalypse
- conrad ziefle on Three Years Since The Apocalypse
- Bob G on Three Years Since The Apocalypse
- Gordon Vigurs on Three Years Since The Apocalypse
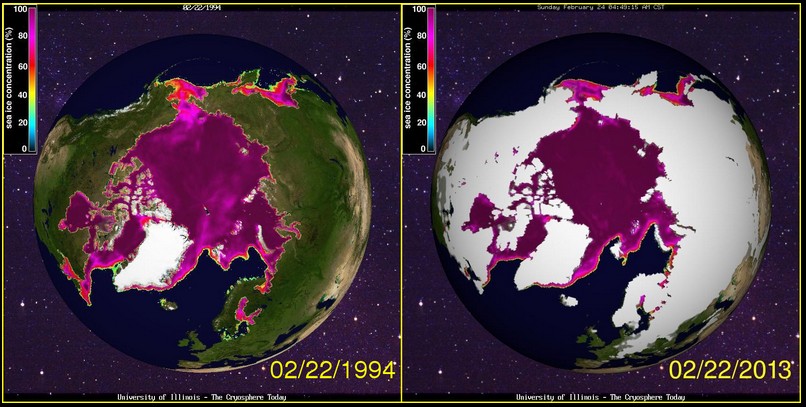
Except that since about 2006 there has been rather less ice in the Barents Sea. I wonder what’s going on there?
It is also more difficult on the recent Cryosphere Today maps to see the extent of the ice in the Gulf of Bothnia/Gulf of Finland and the St Lawrence.
If you use a microscope, you can detect an ice cube or two of missing ice near the coast of Labrador. We definitely need a few extra billion $ for further study!
Actually the %-concentration in 2013 appears much more wide-rangingly dark purple than in 1994. This seriously suggests more ice is present in 2013.