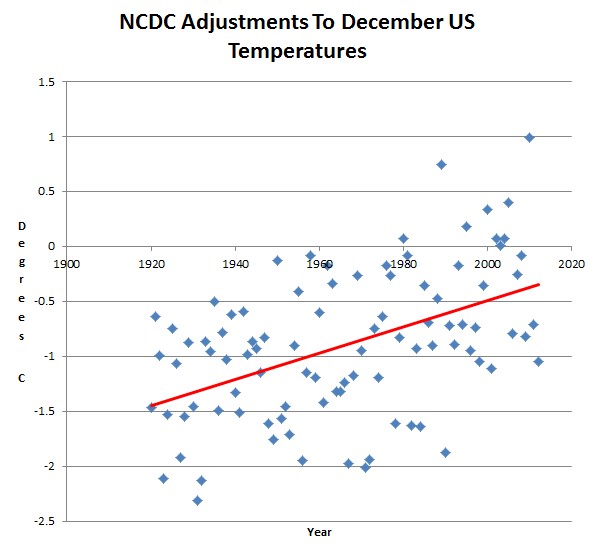
Fixing global warming is as simple as getting government scientists to stop tampering with the data
Any possibility of getting a blink comparator? I’m assuming each data point has been adjusted up or down to yield the upward trend line. Potentially damning chart.
thanks!
Good to know that 2002 was the only year in history they read the temperature correctly…
Good luck with that. 😉
Your email address will not be published. Required fields are marked *
Comment *
Name *
Email *
Website
Save my name, email, and website in this browser for the next time I comment.


Any possibility of getting a blink comparator? I’m assuming each data point has been adjusted up or down to yield the upward trend line. Potentially damning chart.
thanks!
Good to know that 2002 was the only year in history they read the temperature correctly…
Good luck with that. 😉