
Obama has implied that anyone who disagrees with him about global warming is an enemy of the state. He says that all scientists agree that the planet is warming out of control, and that it is unacceptable to disagree with the scientists whom he chooses to listen to.
Besides the fact that he is violating almost every principle which he swore to uphold. and is threatening our democracy – he has no idea what he is talking about.

http://uk.weather.com/weather/10day-Tiksi-RSXX1625:1:RS
– 50 ºC
right now -47 ºC. I hope they have survived the 3 ºC change.
We are living in “1984” [George Owrell (Eric Arthur Blair), “Nineteen Eighty-Four (1984)” Secker and Warburg, 1949]:
http://www.amazon.com/Nineteen-Eighty-Four-Centennial-Edition-George/dp/0452284236
With deep regrets,
Oliver K. Manuel
Former NASA Principal
Investigator for Apollo
http://www.omatumr.com
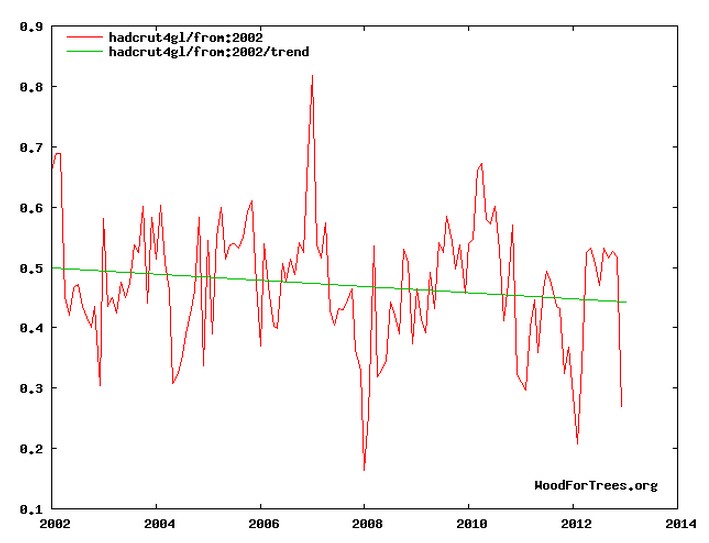
More garbage from Steve. The Woodfortrees graph displays a number of serious abuses of statistics.
1. The interval is much too short. A reliable trend is only possible over a period of decades.
2. The start date 2002 happens to lie on an outlier. If you take a different start date, for example 2000, you get a totally different (positive) result. Steve chose 2000 because, well, he likes it?
3. The end date is undefined. That means that because we have no idea if the end date happens to fall on the same date as the start date (it doesn’t), it means you have an automatic random bias built into the result.
What happens is that by shifting the interval backwards and forwards just by a few months, you can get any result of out Woodfortrees that you want to. Try this for example:
http://www.woodfortrees.org/plot/hadcrut4gl/from:1999/to:2013/plot/hadcrut4gl/from:1999/to:2013/trend
Hansen predicted 0.4C rise during the interval in question, and we are below scenario C.
Temperatures are far below the climate model forecasts. Bullshit statistical arguments aren’t going to fly around here. The interval I plotted was the last decade, a perfectly valid interval.
Looks to me like it’s following Scenario C pretty well. Certainly not flat-lining, is it?
ROFL Scenario C assumed zero CO2 emissions after the year 2000.
to JohnM …
Can you please describe what “Scenario C” is?
To John M
I am sure everybody would be happy for us to be following Scenario C, as that is based on zero emissions.
That should mean we aren’t all doomed, and therefore won’t have to pay carbon taxes, wreck economies or do all the other things Barry Zero wants.
Wake me up when we get onto Scenario B.
Blade:
I will help JohnM, C is FUBAR and always has been. The ASSumptions it was based on were unrealistic even when it was produced. B is also FUBAR because of the same factors. The ASSumptions that B was built around could not happen in an expanding society. Scenario “A” is the best example of the state of climate science in the mid eighties and the science has only gone down hill from that pinnacle. The fact that “Big Jim” used 10 to 12 years of warming to claim there was a trend happening, then claiming thirty years would be needed to determine the state of the climate. Well you get the picture.
Since the thirty year period was determined by the WMO, Ocean/Atmosphere weather patterns that last between 40 and 80 years have been found to affect different regions of the globe. Those weather patterns average 60 years long. That means a 30 year period is to short even for regional climate, as it does not take known long term weather patterns into account. Maybe 10 cycles of known weather patterns would give us an idea what regional climate is.
I see you’ve given up on defending your WoodForTrees graph and you prefer to change the subject. Well, that’s one way to end a discussion. Where does that leave your claim that President Obama is “violating almost every principle which he swore to uphold. and is threatening our democracy”?
I see that you are determined to focus on only one tree through blurry glasses in the middle of a vast forest.
Which part of temperatures haven’t risen for at least a decade but CO2 has don’t you understand?
The models are broken. Actual measured temperatures show this to be so (ignoring the Hansen fraudulent fiddling).
AGW/Cimate change is just vehicle for a power grab by the socialists.
Is that why Hansen tells us
“In the summer of 1988, I testified to the U.S. Senate that the world was getting warmer and that the dominant cause was probably human-made greenhouse gases.”
After just 10 years of warming? Pity he did not wait a few more decades then.
@TPeel
What the graph shows is that there hasn’t been any warming in the HADCRUT4 data set for 11 years. Is this statement true or false? If you think it’s false, then refute it.
If you want to point out that the overall warming trend for, say, HARCRUT4, over, say, 100 years, is one of warming, that’s fine. But that’s a different claim about a different time period.
LOL,
I see that you chose a LOW starting date for 1999 and ran it to 2013 a total of nearly 14 years.The warming trend is less than .10 per decade which thanks to YOU disproves the IPCC 2001 and 2007 reports where they projected the decadal increase of about .20C and as high as .30C per decade.
Thank you for beating up on the IPCC reports for us here.
Now the warmistas (represented by TPeel here) are claiming selective end points – a subject they very much know about. Now, apparently, we must look at much longer periods.
How long, TPeel ? 100 years perhaps? or 1000 years? I fwe go back to the last glacial period, why yes indeed there was warming. But not due to CO2. So, if there has been warming before due to other natural factors, pray tell why you think the current short, 30 year period of warming, is not also due to natural factors other than CO2.
Using the most recent data point isn’t exactly being selective.
Nothing to say about the effect of using 1999 as a start date, I see?
I used 2002 as the start date – i.e the last decade. James Hansen just released a discussion of the last decade too. Are you anal retentive?
quote “I used 2002 as the start date – i.e the last decade.” If you seriously think you can get a meaningful trend out of just 10 years of data, then you are either stupid – which of course I doubt – or you are trying to fool everybody.
You are counting angels dancing on the head of a pin. The point is that temperatures are not rising rapidly as Hansen predicted. In fact,they are below his zero emissions Scenario C
Yes, 100 years is just fine. And afa natural factors playing a role over 30 years, that is quite possible – it ties in with factors like ENSO and La Nina, which probably account for anomalies of the order of up to 0.2°C – look at the recent paper by Rahmstorf et al – your problem with the “natural factors” argument is that there is no trace in the paleontological record of temperatures rising so much and so fast as in the last century.
That claim is patently absurd. Ice core records show that recent temperature changes are completely in the noise of natural variability.
Not to mention the 1990 IPCC report

TPeel, another climate koolaid drinker who couldn’t think his way clear of the koolaid stand. Drink up T.
Tpeel:
Actually 100 years only contains 1.4 data points for a region, so that would not be statistically significant when discussing regional climate that has average 60 year weather events. You would need 10 of those events to even start discussing climate factors and 100 to start to understand climate fluctuations due to natural causes of otherwise. That is just regional! Global is a completely different “Ball Game”! That would be like trying to use the rules for a Table Tennis match to judge a Soccer Game or a Baseball Game!
The Foster & Rahmstorf paper is a something of a cause célèbre of the Warmist movement. By subtracting all the components of the climate system that they could find that they believe causes cooling, they then show that the planet is in fact warming. (We just can’t measure it empirically.) It really is that dumb. If sceptical scientists attempted something as silly as that (given the arbitrariness of what you can decide to keep or subtract), Warmists would be laughing hysterically at the attempt.
quote “Ice core records show that recent temperature changes are completely in the noise of natural variability.” – the Vostok ice cores I suppose? The resolution on the X and Y scales prevents you from making any claims about natural variability on a timescale of decades- there simply isn’t enough resolution.
The graph shows 10C variability. Hansen claims 7% of that over the last 140 years.
That is hardly a six sigma event. ROFLMAO
The 10°C cycle is over a period of 10,000 years. AGW is 1°C in 100 years. Notice a slight difference in the rates?
TPeel. What areas of the world have seen temperature rise faster than *ever*?
You are talking about averages. More slightly above “normal” temperatures in a slightly larger area than a bit earlier – and an average temperature of an arbitarily selected time frame is not even the same as normal.
Temperature in on location can easily rise or drop tens of degrees during a few hours. In spring at the northern latitudes it is quite common to have -25C at 6 am and +5C at 1 pm. During a year the temperature can fluctuate even more from summertime temperatures of +35C to winter lows at -35C.
And compared to this 0,7C/century is unnatural and unmanageable? Please…
The fastest temperature rise ever recorded was 49°F in two minutes in Spearfish, South Dakota, on January 22, 1943
The fastest temperature drop ever recorded was 47°F in five minutes in Rapid City, South Dakota, on January 22, 1943
Both weather phenomena occurred on the very same day in the very same area.
One rather interesting thing to note about Chinook’s, where a warm air mass takes over a much cooler one, is that it rarely, if ever, triggers thunderstorms and tornado’s. I grew up in the southeast corner of Washington state, where we would get a couple of Chinook’s every year. I also lived on the great plains (North Dakota) for 25 years were we would get the same every year. In either location, I have never seen any severe weather spawn from a Chinook. However, here in Tennessee (where I now live), we get the opposite of a Chinook all the time (cold air mass taking over a warm air mass), and I can tell you from very recent experience, the latter phenomena most certainly does trigger extreme weather events. We have had 4 or 5 tornado’s touch down within 1 mile of our house just within the past two months from this phenomena. Strange how warm air masses don’t trigger extreme weather, but cold air masses do. … just an interesting observation on my part.
And what is to say variations of the order of 1°C in 100 years are not well within normal temperature bounds?
Tpeel:
Decades are not enough time to define regional climate let alone global climate. What the Vostok core shows is natural weather variation over part of the current “Ice Age” which is about 40 million years old. My research has found the globe has been cooling for the last five to eight thousand years, with short warming periods injected, such as the one we are experiencing.
Well the first part of your statement is quite correct, it’s cooled a few degrees since the last optimum – maybe you’d care to calculate that in degrees per decade? However, where is your evidence for “short warming periods” like the one we are experiencing? I’ll buy into anomalies of maybe 30% of the current values, but more than that you have to provide some real evidence with numbers.
Maybe if you read history and read up on research into long term weather patterns, you also might see where the globe experienced warming periods, such as the Minoan Warming, the Roman Warming and the Medievil Warming, to name a few of the warming events that were experienced in the last 5,000 years. there were cooling periods that disrupted the warming.
Most warming was equal to or even faster than this minor warming we are experiencing. You have been fooled by the Fabrications the advocates have provided as evidence of the warming that is not happening!
“The resolution on the X and Y scales prevents you from making any claims about natural variability on a timescale of decades…”
Notice how he switches the argument from providing *evidence* for his claims, to demanding that one now *disproves* what he claims. Unfortunately, science doesn’t work that way. If I want to claim UFO’s exist, I have to provide evidence for them. I can’t simply point out that my UFO claim can’t be disproven given the uncertainties…
Excuse me, but the issue is the claim that the ice cores provide evidence of decadal variability.
The claim is that temperatures are not rising exponentially as Hansen predicted. And they aren’t.
TPeel. See this: http://www.grida.no/graphicslib/detail/trends-in-the-ice-breaking-date-in-the-tornio-river-finland_5cf4
Now please tell me where is this unprecedented speed of warming you mention. Where is the hockey stick? What was the year that the speed of change exceeded the natural variation?
He probably agreed with the goalpost of the AGW crowd of yander created, but now he just wants to move them again because it doesn’t fit their story anymore, and now he claims cherry picking. 😆
quote “Not to mention the 1990 IPCC report” – not sure why you chose the 1990 report, why not AR4?
http://www.ipcc.ch/publications_and_data/ar4/wg1/en/ch6s6-6.html
All in all the statistically significant excursions are small compared the temperature change over the last century. To quote – “Considering the recent instrumental and longer proxy evidence together, it is very likely that average NH temperatures during the second half of the 20th century were higher than for any other 50-year period in the last 500 years.”
How exactly did history change after 1990?
Briffa’s trees agreed very closely with the 1975 National Academy of Sciences thermometer graph, before both were altered by Mann and Hansen.
I really know nothing about a 1975 graph, are you saying you prefer to ignore the last two decades of research?
I suggest that you find out about the 1975 NAS report, and then explain how the historical record changed sometime after 1990. Historical thermometer readings have nothing to do with theory, and there is no valid reason to change them.
“I really know nothing about a 1975 graph, are you saying you prefer to ignore the last two decades of research?”
We only have ignore the research promoted by Mann’s research team, because it is making outlier claims and has identified statistical problems. The rest of the research on this topic, even the newest papers, by other scientists, are consistent with past research.
TPeel:
AR4 does not even qualify as “Junk Science”! The IPCC is a Governmental group that is advocating a possible problem without real scientific research into the issue. Some of the proponents have provided “What If scenarios” Based on fabricated ASSumptions regarding the ability of some atmospheric gasses to control the temperature of the globe. History has proven them wrong and it is time to move on to real world problems that have been ignored since this fiasco started.
What you have come to believe are temperature records are really model outputs that are loosely based on some temperature records, according to NASA GISS!
For a better understanding of Surface temperature analysis read this:
http://data.giss.nasa.gov/gistemp/abs_temp.html
The HOPE you believe what they produce using computer models!
wow, serious stuff from a gun nut.
I am Not really a GUN NUT! I happen to own a few weapons for personal defense! Just like the study of weather I also experimented with various weapons to find the best weapon for my individual needs.
Nice deflection TPeel … next time, at least try to keep the ball on the same court!
The AR4 report is based on the hypothetical notion that human emitted CO2 was causing global warming. This has since been shown to be nothing but scaremongering. If you think otherwise, please explain why of temperatures haven’t risen for at least a decade but CO2 has.
The models are obviously broken.
The only sane reason for all the hype about AGW/Cimate change, is just vehicle for a power grab by the socialists.
I think your political bias is showing. Not one of your statements is correct.
Specifically?
“Global temperature has not risen in 15 years. It has stagnated, and in recent years has even shown a downward trend – despite the massive annual increases in CO2 emissions. (Why hasn’t the public been informed of this by the media?) For the politically motivated IPCC and its followers, it is now time to give up the dogma of CO2?s climate dominance and the marginalization and branding of those who differ with climate science. Just because one belongs to the mainstream does not mean he automatically has a better knowledge of the science.
Predicting a global warming of 4°C and associated apocalyptic consequences by 2100 by the CO2-dominated climate models (World Bank, PIK) is pure hypothesizing. As long as the solar effects and associated interactions are underestimated and the effects of CO2 exaggerated, no realistic climate conclusions can be expected.
The earlier analyses of climate allow only one conclusion to be made:
Compared to the integral solar climate effect, with all its complex, non-linear interactive mechanisms (ocean, clouds, albedo, biosphere, cosmic rays,…), the anthropogenic greenhouse/CO2 effect is only of subordinate significance. Also the media attempts to trace back singular weather events to an anthropogenic influence has no merit. History shows that hurricanes, tropical storms, tornadoes, droughts and floods have occurred on and off over the centuries as a result of synoptic constellations. However, because of the population growth to 7 billion, more and more people and their goods are being impacted by natural catastrophes.
Instead of attempting over-rated and ineffective climate protection, all efforts should concentrate on global environmental protection: clean air, clean water, uncontaminated soil and an intact ecosystem are among the fundamental rights of people. Measures for reducing CO2 can be justified by the limited fossil fuel resources and pollution that comes from combustion processes. So-called climate protection is, on the other hand, the least effective of all measures. There never has been a stable climate over the course of history, and there isn’t going to be one in the future.”
_____________________________________________________
Of course CO2 warmth may have its uses –
http://i53.photobucket.com/albums/g43/DerekJohn_photos/stuff/6a00d834519c3c69e200e553d605cf8834-.jpg
Tckev:
TPee has no friggen idea what you are saying, so S/HE/IT has to claim you are wrong, as S/HE/IT can never be wrong. Those type have to see a Proctologist for an EYE exam!
Good one 🙂
Ok, well thanks to your suggestion I did some research and found the NAS report 1975 says in the summary “Unfortunately, we do not have a good quantitative understanding of our climate machine and what determines it’s course. Without this fundamental understanding, it does not seem possible to predict climate-neither in short-term variations nor in any in its larger long-term changes.” So that was in 1975 – they said go out and do some research – and so everybody did.
Now tell me again Steven, why should I be placing more credence in a temperature graph that doesn’t even have a scale on the Y-axis published in 1975 in a document that says we need more research?
They did not say that the measurements were invalid, just that the interpretation required more study.
So what is wrong with the 1975 figures again?
TPeel:
The answer has not changed since 1975! We need to do more research to better understand weather and that study is CLIMATE! They should not have become advocates before they had truly STUDIED weather, because they are further behind than they were in 1975, due to false ASSumptions!
You really are talking complete bullshit. What do you know about climate research anyway apart from what Steve Goddard spoonfeeds you with?
Steven has only been on line a few years! I have been tracking Climate for a while longer than that! I have even consulted with IT people at Super Computer locations where they run those SIM Games they call Climate Models. Even the So Called “Climate Experts” need to Consult with “Trouble Shooters”!
Bull Excrement is actually a useful product and promoted growth! You get to figure out if it really is BS or based on real world evidence! I know the answer!
Quote: “stevengoddard says: I see that you are determined to focus on only one tree through blurry glasses in the middle of a vast forest.”
Not a word about his original post with its crappy misleading graph and insulting comments about the President of the United States. Come on Steve defend yourself like a man. Did you or did you not say Obama is violating almost every principle which he swore to uphold. and is threatening our democracy??
I criticised your claim and you never responded to me. Part of what you wrote is actually gibberish… But even if we focus on the part of your claim that is amenable to comprehension, it doesn’t hold up very well either.
What part of “below scenario c” isn’t clear?
The part where TPeel has to read and comprehend written english.
Most likely the part that disagrees with his pet belief in AGW.
Senor TPeel may be using the ancient Assyrian alphabet where there was no C.
“Not a word about his original post with its crappy misleading graph and insulting comments about the President of the United States. ”
The graph is factually true, feel free to prove it is not.
What exactly is wrong with the statement “Obama has implied that anyone who disagrees with him about global warming is an enemy of the state.” ?
In Obama’s kingdom, you are not allowed to criticize him.
It was going to be my point if he ever replied.
I’d still like him to reply to my answer above.
I already explained in my first post why Steve’s WFT graph is baloney. Did you read it? afa Steve’s “enemy of the state” is concerned, it appears to be grammatically correct but otherwise it’s a statement of opinion.
You appear to be emoting excessively.
Let me repeat, there is nothing wrong with the graph, it is obviously detrimental to your agenda but it stands as an excellent piece of work for what it shows. And it show that for the last 10 year has no warming at all. Do you not agree?
Hansen said last week that there has been no warming for ten years. Your argument is baloney.
Obama said that the US is threatened by global warming, and that people who didn’t accept this were getting in the way of saving the country. This is sending a very clear message that skeptics are enemies of the state. It is McCarthyism at its absolute worst.
TPeel says:
February 17, 2013 at 2:50 am
Quote: “insulting comments about the President of the United States.”
Respect is earned, not entitled.
When Obama stops insulting me with his stupid hypocritical climate fraud, then I will stop insulting him. eg:
“We can’t drive our SUVs and eat as much as we want and keep our homes on 72 degrees at all times … and then just expect that other countries are going to say OK,” Obama said.
“That’s not leadership. That’s not going to happen,” he added
[ afp.google.com/article/ALeqM5h-wpxs1Re-8vx2Zk5xnYygW1W67w ]
.
Obama Cranks Up White House Thermostat: “You Could Grow Orchids In There
“He’s from Hawaii, O.K.?” said Mr. Obama’s senior adviser, David Axelrod,
“He likes it warm. You could grow orchids in there.”
http://www.huffingtonpost.com/2009/01/29/obama-cranks-up-white-hou_n_162127.html
.
Obama is right about one thing, “That’s not leadership.”
I see this is deteriorating into an Obama bashing session, which I suppose was the motivation behind Steve’s blogpage in the first place.
The US government is bankrupt. Obama can introduce a broad based consumption tax (‘carbon tax’) without risking damage to his voter base. What part of his strategy here is not clear?
VAT, GST, Carbon Tax doesn’t make any difference what they call it, the bottom line is it will always be passed down to those that can least afford what they need.
And another note Zero really don’t care about risking damage to his voter base now, why would he!
😉 we are saying kinda the same thing, ya know that right? 😆
Still no response from Steve in response to my specific criticisms of his graph.
That is because the graph, as shown is accurate and shows the point. The point is the graph shows no warming (at all) for 10 years, do you agree?
What part of Hansen says there has been no warming for a decade is not clear to you?
Still showing how ignorant you since the chart Steve posted explodes the last TWO IPCC reports decadal temperature trend predictions.
tpeel, his response was direct and clear. You are the one squirming from a real conversation. You brought up Obama, were give many reasoned statements on clear criticism of his agenda and ideaology, and then you changed the subject you brought up. You have done this at least 1/2 dozen times in this thread alone. You may not be a troll, but your behaviour is troll like, your logic is sadly lacking, your thought porcess is inane.
David, I’ve been trying to keep this thread on-topic. You may not have noticed, but it is the other posters, including Steve Goddard himself, who have been indulging in thread drift.
Let’s go through this once again –
1. Steve Goddard posted a graphic based on the misuse of statistical data.
2. Steve Goddard then used this misuse of data as a pretence to attack Obama.
3. When challenged as to the validity of the graphic, SG switches tactics and drags in a decades old prediction from Hansen.
4. He then switches to the Vostok ice cores as a further deviation tactic.
5. When I challenge the use of invalid data as a pretext for making personal attacks on the President, he switches into paranoid McCarthyism mode.
In the meantime we see the entire chorus line jump in singing the IPCC fraud, the UN communist takeover and Michael Mann refrain from your favorite musical.
If you want to accuse anybody of changing the subject, I suggest you read the threads more carefully.
TPeel, whose very first statement in his quest for reasoned debate was”More garbage from Steve.”, then went on to improve our knowledge of unbiased logic and rational argument with
“wow, serious stuff from a gun nut.”
“You really are talking complete bullshit. What do you know about climate research anyway apart from what Steve Goddard spoonfeeds you with?”
“Come on Steve defend yourself like a man”
.
.
.
Bertrand Russell, please yield the gavel…
A “gun nut” is someone who believes that the US Constitution forms the basis of our legal system.
Tpeel writes:
“Nothing to say about the effect of using 1999 as a start date, I see?”
You chose a low point in the last 14 years and thus claim a warming trend.Since you whine that 10 years is too short a time and you went over 13 years.I will add another year for you and see what the trend is:
http://www.woodfortrees.org/plot/hadcrut4gl/from:1998/to:2013/plot/hadcrut4gl/from:1998/to:2013/trend
Now here is the UNADJUSTED global mean from 1998:
http://www.woodfortrees.org/plot/hadcrut3gl/from:1998/to:2013/plot/hadcrut3gl/from:1998/to:2013/trend
RSS from 1998:
http://www.woodfortrees.org/plot/rss/from:1998/to:2013/plot/uah/from:1998/to:2013/trend
UAH from 1998:
http://www.woodfortrees.org/plot/uah/from:1998/to:2013/plot/uah/from:1998/to:2013/trend
All rates well below the IPCC’s predictions for the first TWO decades that was .20C per decade
It is also well below the warming trends since the 1850’s as well:
http://globalwarmingskeptics.info/thread-1103-post-8790.html#pid8790
You are running on babble since the warming trend is clearly slowing down quite a bit despite the continued rise of CO2 level in the atmosphere during the same time frame.
sunsettommy – it is a well known fact that there was an extremely powerful El Nino event in 1998 that caused a very strong spike in the temperature record for that year. That means that any trend data that starts with the year 1998 shows a spurious and misleading effect. And obviously it certainly has mislead you.
Ha ha ha ha ha…….,
YOU chose a low point that coincided with a powerful LA-Nina event that lasted over two years.
I have known about the 1998 el-nino event for ….. about 14 years now thus I knew about the effects you people went orgasmic over back then and idiots such as Mann and Trenberth thought the runaway warming trend was near and went apocalypsic on it.It has not been warmer ever since.
You are so bad you are funny.
The graph starts in January 1997 at a low point. Not 1998.
Wow, a response from Steven. Well now Steve, if I plot a graph starting at 1997 until 2012, will the trend line include the 1998 data or not? Try and concentrate…
Maybe I should start the graph in 1998, so that it will show a steep decline.
I think TPeel is complaining that a natural part of the climate system that affects the global temperature shouldn’t be included in a graph that plots the global temperature. Because this is unfair or something… to his belief system…?
Hansen et al., were claiming that global warming were causing strong El Nino’s. Now TPeel is unhappy that they are included at all. Perhaps Steve, to keep him happy you should remove all the La Nino’s from the temperature record – no hang on – I don’t think that would produce the result he wants either. 😉
El Nino’s… ouch.
Is it possible that my comments are invisible to this TPeel fellow?
Is it possible we are in totally different time zones? I don’t spend all day sitting in front a computer, least of all on weekends. Regarding your first post, this seems to be a non sequitur – what are you trying to tell me? Regarding the 2nd post, the graphic is very interesting, and as you say, doesn’t display a hockey stick, but then it doesn’t display the LIA either. I’m wondering whether some of the spikes might be associated with volcanic events.
I’d like to point out that this is getting more and more into thread drift – I challenged Steven specifically on the validity of his WoodforTrees graph, and he’s decided to go silent on the issue, which seems rather inadequate behaviour for someone running a web blog.
Below scenario C. Temperatures are lower than if we quit producing CO2 thirteen years ago
@TPeel,
If the purpose of the graph is to show the longest possible period that displays a cooling trend backward from the most recent available data, in what way does this graph misrepresent?
If you think the data was mischarted then show how it was mischarted. Don’t whine about how the graph is nonsense because you wanted to chart up some other data. That’s childish. Is that cooling trend real or not?
Yes, my bad. I am so used to forums on my time zone I forget that other people might be on the opposite sides of the world.
It starts right in the middle of the LIA and the first half is measured during the LIA. Notice how there is nothing to separate the recovery from LIA from the temperature rise in the 1900’s. The graph shows that the climate has been warming for the last 300 years pretty much steadily. No acceleration. No weird speed-up at the end.
But the single most interesting thing about the graph is that if you take another graph that shows the number of sunspots, for example this one: http://en.wikipedia.org/wiki/File:Sunspot_Numbers.png
Invert one of them, scale them correctly and put them on top of each other, you can’t help but notice two things:
1) Almost without exeption when there is a solar maximum, the ice breaks earlier. The ice never breaks early when there is a solar minimum – instead it usually breaks late. So clearly sun’s activity somehow correlates with the ice breaking date in Tornio.
2) The long term average seems to have an effect too. It seems to be a limiting factor to how late the ice can break. If the long-term activity is high, short term minimums cannot cause the date to be very late. It’s seems like many decades worth of warmth is stored somewhere? Where can that be? Oceans?
Comparing the two graphs it is undeniable that sunspot numbers affect the yearly temperature in Tornio in both yearly and multidecadal scale. Climate scientist say that sun sports don’t affect global temperatures. So there must be a mechanism for the sun to affect *only* the temperature in Tornio. How is that possible?
Or could there be some misunderstanding about how the climate works?
Will Nitschke: I stated the reasons why the graph is misleading right in my first post. The data excursions are so large compared that there is no meaningful trend over such a short time window, and what you get is to a large extent the result of pure chance. You can verify this by calculating the correlation factor between the trend line and the data. In spite of this Steve uses his meaningless graph to attack Obama and claim that Obama doesn’t know what he’s talking about. The irony is of course that Steve is the one who is displaying that he doesn’t understand statistics.
You just wrote there is no meaningful trend over that period. Exactly. Any trend of warming or cooling is not significant. That means no warming. Which is exactly the point Steve was making and you agree with it… So what are you whining about since you’re not disagreeing either?
Below scenario c
Define the 10 year Rate of Global Temperature Change, as the slope of the least squares linear regression line, fitted to 10 years of global temperature data.
This can be done easily using monthly data, using 120 data points for each 10 year period.
Identify each 10 year period by the final month in that 10 year period.
So the 10 year Rate of Global Temperature Change for December 2012, is the slope of the least squares linear regression line, fitted to the global temperature data for the period January 2003 to December 2012.
And the 10 year Rate of Global Temperature Change for March 2011, is the slope of the least squares linear regression line, fitted to the global temperature data for the period April 2001 to March 2011.
From the Hadcrut4gl temperature series (which runs from January 1850 to December 2012) we can calculate 1837 10 year Rates of Global Temperature Change, one for each month, from December 1859 to December 2012.
If the 10 year Rate of Global Temperature Change is greater than zero, then this shows that warming occurred over that 10 year period.
If the 10 year Rate of Global Temperature Change is less than zero, then this shows that cooling occurred over that 10 year period.
==========
Out of the 1837 10 year Rates of Global Temperature Change, 1159 show warming, and 678 show cooling. (a ratio of about 12 warming rates for every 7 cooling rates)
The period from February 1987 to January 2011 (this is 288 months, or 24 years), shows CONTINUOUS WARMING.
The period from September 1979 to January 2011 (this is 377 months, or 31 years and 5 months), show CONTINUOUS WARMING, EXCEPT FOR 2 MONTHS (December 1986 and January 1987 were very slightly negative, -0.02 and -0.05 degrees Celsius per Century respectively).
The period from February 2011 to December 2012 (this is 23 months, or nearly 2 years), shows CONTINUOUS COOLING.
To find another continuous period of cooling this long (23 months), we need to go back to August 1979 (the period from October 1977 to August 1979).
In fact, the entire period from February 1975 to August 1979 (this is 55 months, or 4 years and 7 months), shows CONTINUOUS COOLING. This is the period when Alarmists tell us that scientists DIDN’T warn us about a PENDING ICE AGE.
==========
In summary, the last 23 months has shown CONTINUOUS COOLING, based on the 10 year Rate of Global Temperature Change.
The last time that this happened, was in August 1979, about 33 years ago (it doesn’t happen very often).
23 months of CONTINUOUS COOLING, is an UNEXPECTED EVENT, IF YOU BELIEVE IN AGW/GLOBAL WARMING. Because we have only had 2 months of cooling in the 31 years from September 1979 to January 2011.
Can anybody who believes in AGW/Global Warming, please explain this.
1/3rd, the whole problem is that given the range of fluctuations in the data, the 10 year period is too short to get a statistically meaningful result. Calculating the correlation coefficient between the trend line and the temperature data, for a ten year sample you typically get values of correlation coefficient r in the range between zero and 0.2 – this is simply statistically insignificant -try it yourself, it’s easy enough with Excel. To get a strong correlation, meaning a value of 0.5 or more, you need more data, typically at least 20 years, and better 30 years.
So when climate scientists like Phil Jones tell you that the warming or cooling or whatever over a ten year period is “not statistically significant”, they don’t mean that there is no warming/cooling, or they are trying to dodge the issue, they are simply stating a fact.
If you don’t like this, then there’s no use complaining to Phil Jones or me, you’ll just have to complain to Mother Nature for giving us such noisy data.
Tom, the 10 year rate of global temperature change is statistically meaningful enough to show almost continuous warming for 31 years and 5 months (377 months), despite all natural fluctuations. Isn’t that every Alarmists dream?
The probability of getting a non-warming rate over that 377 months, is approximately 2/377 = 0.00530504
Given that AGW is supposed to be happening, and that CO2 levels are increasing rapidly, the probability of getting a non-warming rate should be decreasing over time.
What is the probability of getting 23 non-warming rates in a row? My speadsheet gives an answer with an exponent of -53 (as in 10^-53). This is assuming that things are totally random, with AGW, the answer would be even smaller!. So the latest 23 months having non-warming rates, is HIGHLY SIGNIFICANT.
What do you mean by a statistically meaningful result? If there is little (or no) AGW, would you expect to get a statistically meaningful result?
Why are you trying to calculate the correlation coefficient between the trend line and the temperature data? You are looking for a straight line, when there isn’t one. What do you expect to find?
There is a second period in the temperature record (the last 163 years), during which there was almost continuous warming for 404 months (33 years and 8 months). Only one non-warming rate occurred in 404 months. How statistically meaningful is this?
You see Tom, it has all happened before. But you don’t want to believe me.
regarding TPeel says:
February 17, 2013 at 9:08 pm
——————————————————————————
Six or more comments in a row all directly about the post, on target and on thread, and the troll, instead of responding to the comments, complains we are off thread, when in fact it is he who consistently diverted the thread.
David: if I understand you correctly, the thread topic is not climate, the real thread topic is finding pretexts for Obama bashing? In that case I was mislead by the blog title “Real Science”. I do apologize.
The thread topic is that Obama is willing to wreck 250 years of history and the US constitution over junk science which he doesn’t understand.
No Tpeel, you only understand yor own prejudice, logic and rational discussion yet elude you, alas.