
Disrupting the Borg is expensive and time consuming!

Google Search
-
Recent Posts
- Worst March Drought On Record
- ChartGL Process Control Demo
- The Biggest Money Laundering Scam
- Drought In The Headwaters Of Lake Powell
- Unrealistic Expectations Of Water Availability
- Did Bill Gates Do This?
- Worst March Drought On Record In The US
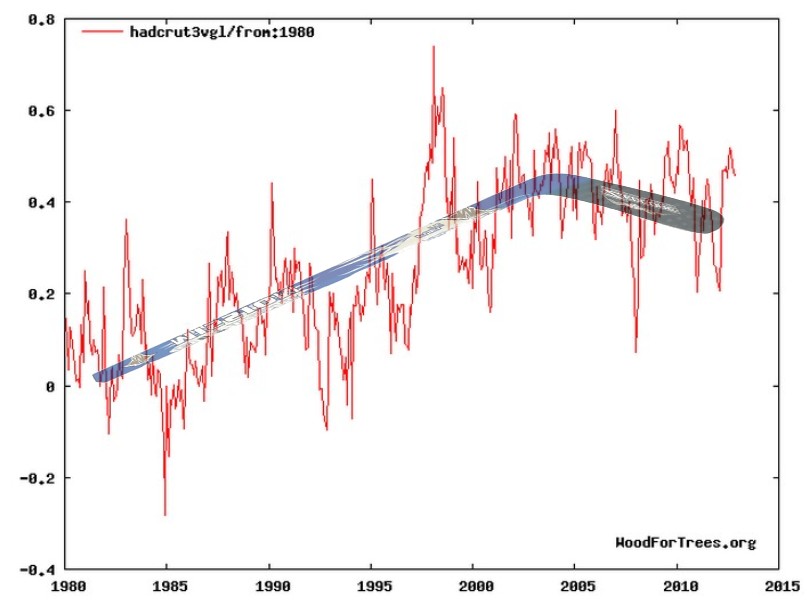
- The Real Hockey Stick Graph
- Analyzing The Western Water Crisis
- Gaslighting 1924
- “Why Do You Resist?”
- Climate Attribution Model
- Fact Checking NASA
- Fact Checking Grok
- Fact Checking The New York Times
- New Visitech Features
- Ice-Free Arctic By 2014
- Debt-Free US Treasury Forecast
- Analyzing Big City Crime (Part 2)
- Analyzing Big City Crime
- UK Migration Caused By Global Warming
- Climate Attribution In Greece
- “Brown: ’50 days to save world'”
- The Catastrophic Influence of Bovine Methane Emissions on Extraterrestrial Climate Patterns
- Posting On X
Recent Comments
- Gordon Vigurs on Worst March Drought On Record
- Robertvd on Worst March Drought On Record
- Bob G on Worst March Drought On Record
- GW on The Biggest Money Laundering Scam
- Don B on Worst March Drought On Record
- Ulric Lyons on Worst March Drought On Record
- conrad ziefle on The Biggest Money Laundering Scam
- conrad ziefle on The Biggest Money Laundering Scam
- D. Boss on The Biggest Money Laundering Scam
- Bob G on The Biggest Money Laundering Scam
I’m afraid I’m going to have to call ‘high sticking’, as that graph is a head and shoulders better than Mikey’s. 😉
A good “high sticking up side the head” might be the adjustment that Mikey really needs.
Nice one!
Brilliant!!! [& Dead accurate]
A very nice graphic. I love the invention and the truth inherent in this version. Send Michael his own special autographed copy!
Demonstration if any that Mike ‘no bel’ Mann inverted the truth.
Stick it to the Mann!
Since he flipped proxies around that showed cooling trends and turned them into warming trends, I suppose he can’t really object to this either. 😉
Good one! 😆
Doesn’t even look like a hockey stick, more like one that’s broken or has been significantly flexed for one’s purposes, referring especially to the AGW nutjobs
Steve McIntyre just posted a nice revelation on Mann’s talk at AGU last fall. Mann hid the temp data after 2005.
Look carefully at Steve Goddard’s most excellent graphic.
Now why do you suppose Mendacious Mike’s 2012 presentation chose to leave off data after 2005?
If I recall that post correctly he also misrepresented by comparing ocean-land models to land only measurements. He is a tricky little fellow. Count your silverware afterwards if you invite him over for dinner. Or better yet, stick to fried chicken and fresh fries.