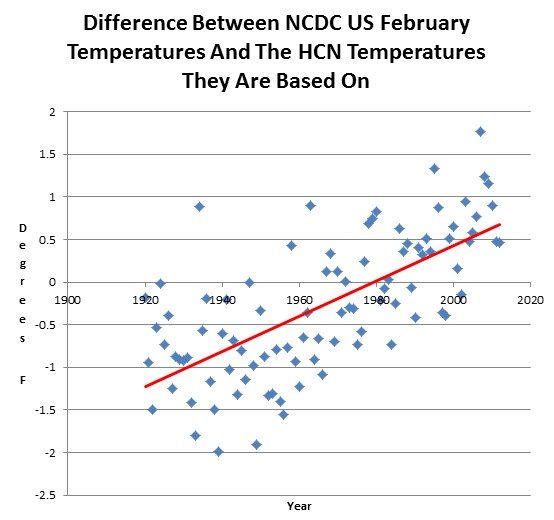
Wow! That looks like a spread of nearly 4 degrees! These people have more brass face than a monkey! The temperature hasn’t been flat for fifteen years, it’s been plummeting down.
Steven or anyone else here.. I tried to bring up the 1900 and 1930s BoM aus data for marble bar , probably the hottest spot on aus from past history
they housekept the data and the new system appears to be collated so 1900 to 11 are one chunk and averaged?
ditto 1930 to 41 or something similar only gives 2 lines a top and low temp average.
I admit they make it hard to figure out how to find single year data, and i am not used to som of the programs they sem to store stuff in.
but I KNOW i read a chart there about 3 yrs ago showing longreach marble bar and ceduna? as charts and they were damned hot weeks over high 40c and 50s.
it got vanished. to an obscure data list and now even thats gone?
aus media lying full bore the last yrs hotteste ever lowest rain etc.
needs to be exposed.
they also ceased marble bar on 2006, odd.


Spot on!
Wow! That looks like a spread of nearly 4 degrees! These people have more brass face than a monkey! The temperature hasn’t been flat for fifteen years, it’s been plummeting down.
Steven or anyone else here.. I tried to bring up the 1900 and 1930s BoM aus data for marble bar , probably the hottest spot on aus from past history
they housekept the data and the new system appears to be collated so 1900 to 11 are one chunk and averaged?
ditto 1930 to 41 or something similar only gives 2 lines a top and low temp average.
I admit they make it hard to figure out how to find single year data, and i am not used to som of the programs they sem to store stuff in.
but I KNOW i read a chart there about 3 yrs ago showing longreach marble bar and ceduna? as charts and they were damned hot weeks over high 40c and 50s.
it got vanished. to an obscure data list and now even thats gone?
aus media lying full bore the last yrs hotteste ever lowest rain etc.
needs to be exposed.
they also ceased marble bar on 2006, odd.