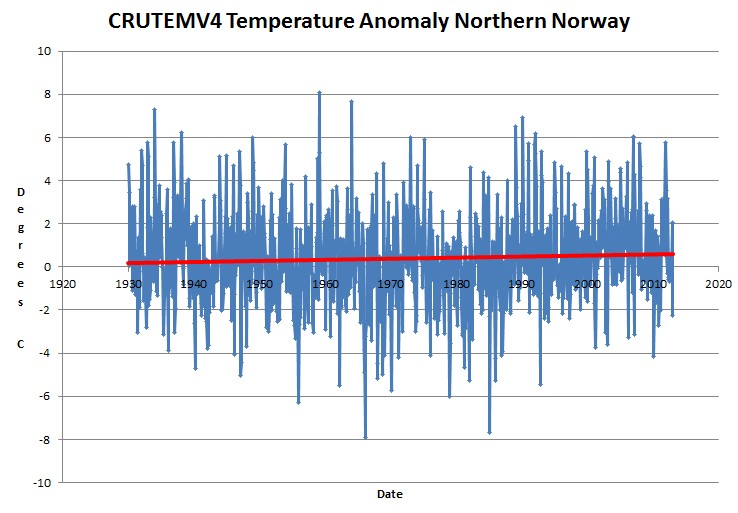
I normally agree with you, but in this case, your claim of “no change” clearly has an upward slope, so I don’t think that your claim is accurate in this case.
Peter … tsk tsk … you call that a slope? Seriously? Did you pay any attention to the temperature itself? (ie: +/- 8C) .. that “slope” you are seeing isn’t even a fraction of the data error itself. Come on … perspective, perspective …
It is a netcdf file with the entire CRUTEM4 database. That is the standard format for distributing weather and climate data. Just pass it on to the guy so he can become aware of the fact that he is out of league.


I normally agree with you, but in this case, your claim of “no change” clearly has an upward slope, so I don’t think that your claim is accurate in this case.
Noise.
The previous graph for Greenland has a downwards slope and I also wrote that off to noise.
Peter … tsk tsk … you call that a slope? Seriously? Did you pay any attention to the temperature itself? (ie: +/- 8C) .. that “slope” you are seeing isn’t even a fraction of the data error itself. Come on … perspective, perspective …
Steve —
Re-posted at Defending The Truth dot com.
This poster made an assertion. You might want to look at what he says:
http://defendingthetruth.com/current-events/29969-northern-norway-temps-no-change-80-years.html#post549855
I’ll gladly re-post an answer.
http://www.cru.uea.ac.uk/cru/data/temperature/CRUTEM.4.2.0.0.anomalies.nc
Steve —
I cannot access this file, sorry.
It is a netcdf file with the entire CRUTEM4 database. That is the standard format for distributing weather and climate data. Just pass it on to the guy so he can become aware of the fact that he is out of league.
Passed it on.