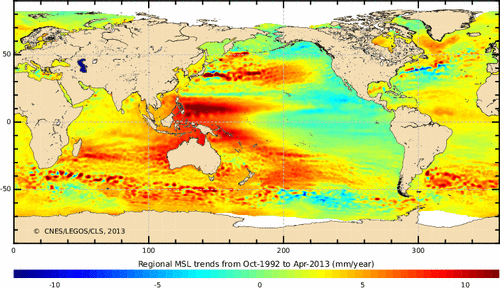
Climate experts believe that huge amounts of ice are melting in Antarctica at -30C, and the melt water is flowing thousands of miles to the Philippines – where it pools up into a mound.
Disrupting the Borg is expensive and time consuming!
Google Search
-
Recent Posts
- Gaslighting 1924
- “Why Do You Resist?”
- Climate Attribution Model
- Fact Checking NASA
- Fact Checking Grok
- Fact Checking The New York Times
- New Visitech Features
- Ice-Free Arctic By 2014
- Debt-Free US Treasury Forecast
- Analyzing Big City Crime (Part 2)
- Analyzing Big City Crime
- UK Migration Caused By Global Warming
- Climate Attribution In Greece
- “Brown: ’50 days to save world'”
- The Catastrophic Influence of Bovine Methane Emissions on Extraterrestrial Climate Patterns
- Posting On X
- Seventeen Years Of Fun
- The Importance Of Good Tools
- Temperature Shifts At Blue Hill, MA
- CO2²
- Time Of Observation Bias
- Climate Scamming For Profit
- Climate Scamming For Profit
- Back To The Future
- “records going back to 1961”
Recent Comments
- conrad ziefle on Gaslighting 1924
- arn on Gaslighting 1924
- Gordon Vigurs on Gaslighting 1924
- Bob G on Climate Attribution Model
- conrad ziefle on Climate Attribution Model
- Ohio Cyclist on Climate Attribution Model
- Bob G on Climate Attribution Model
- Bob G on Climate Attribution Model
- Bob G on Fact Checking NASA
- arn on Climate Attribution Model


Question: What year of the 21st century had the greatest annual average global sea ice area?
Answer: 2013, which is the only year with a global average anomaly above the 1979-2008 average.
http://friendsofscience.org/assets/documents/GlobalSeaIceArea.jpg
Year Anomaly
2000 -0.026
2001 -0.136
2002 -0.588
2003 -0.040
2004 -0.064
2005 -0.641
2006 -1.019
2007 -1.149
2008 -0.368
2009 -0.452
2010 -0.681
2011 -1.359
2012 -0.905
2013 0.058
Thanks. It’d be nice if we could have an extended version of this graph showing what happened in previous periods similar to present, like the 1930’s up to 1952, to better estimate the recovery of the Arctic ice.
Here is the graph from 1979
http://arctic.atmos.uiuc.edu/cryosphere/IMAGES/global.daily.ice.area.withtrend.jpg
Here is the digital data
http://arctic.atmos.uiuc.edu/cryosphere/timeseries.global.anom.1979-2008
One would think that with all the fasting Yeb and his followers are doing that there would be less gravitation pull in the Philippines and therefore lower sea level.
Climate experts believe that huge amounts of ice are melting in Antarctica at -30C….? No, but if you would like an explanation:
PASADENA, Calif. – Ocean waters melting the undersides of Antarctic ice shelves are responsible for most of the continent’s ice shelf mass loss, a new study by NASA and university researchers has found.
http://www.nasa.gov/home/hqnews/2013/jun/HQ_13-183_Melting_Ice_Shelves.html
Graph form of webpage map showing rising sea level:
http://www.aviso.oceanobs.com/fileadmin/images/news/indic/msl/MSL_Serie_ALL_Global_IB_RWT_GIA_Adjust.png
co2 has magical powers…!!
It’s probably not magic…just simple teleportation (“Downwelling’s not working! Beam the heat down, Scotty!”).
Environmental scientists have an average IQ of 87 so I don’t listen to them anymore