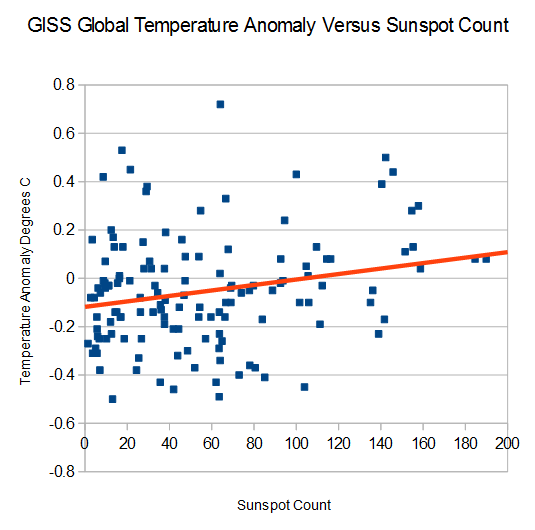
Data going back to 1866.
Disrupting the Borg is expensive and time consuming!
Google Search
-
Recent Posts
- Fact Checking NASA
- Fact Checking Grok
- Fact Checking The New York Times
- New Visitech Features
- Ice-Free Arctic By 2014
- Debt-Free US Treasury Forecast
- Analyzing Big City Crime (Part 2)
- Analyzing Big City Crime
- UK Migration Caused By Global Warming
- Climate Attribution In Greece
- “Brown: ’50 days to save world'”
- The Catastrophic Influence of Bovine Methane Emissions on Extraterrestrial Climate Patterns
- Posting On X
- Seventeen Years Of Fun
- The Importance Of Good Tools
- Temperature Shifts At Blue Hill, MA
- CO2²
- Time Of Observation Bias
- Climate Scamming For Profit
- Climate Scamming For Profit
- Back To The Future
- “records going back to 1961”
- Analyzing Rainfall At Asheville
- Historical Weather Analysis With Visitech
- “American Summers Are Starting to Feel Like Winter”
Recent Comments
- Bob G on Fact Checking NASA
- arn on Fact Checking NASA
- Gordon Vigurs on Fact Checking NASA
- Bob G on Fact Checking NASA
- Bob G on Fact Checking NASA
- arn on Fact Checking NASA
- conrad ziefle on Fact Checking NASA
- conrad ziefle on Fact Checking NASA
- arn on Fact Checking NASA
- Bob G on Fact Checking NASA


Correlation between lunatic NSA mass spying and the massive loss of orders of American IT industry and defense industry, although graph is still underway.
http://freebeacon.com/boeing-loses-4-5b-contract-with-brazil-nsa-leaks-cited/#
This country is run into the ground by the current clique of idiots in charge and theur clueless helpers.
unrelated, but you may be interested in this about areans and wind turbines.:
http://news.nationalpost.com/2014/01/16/p-e-i-arenas-say-their-new-wind-turbines-an-expensive-burden-want-them-removed/
John M Reynolds
https://www.youtube.com/watch?v=6TGbfyPzcLo
No correlation at all. Interesting.
Old Jedi Mind Trick
2/3 of readings above 120 spots have positive temperature anomalies.
2/3 of readings below 100 spots have negative temperature anomalies.
Odds of that being a coincidence are close to zero.
Might be so. Still think correlation is much weaker than expected. Never seen that plot before, by the way.
I wonder if the unadjusted numbers do any better
I’d be curious what the relationship is when you “lag” the temperature by a few years. That is, how does the data look when you compare sunspot count in Year X with temperature in Year X + Y?