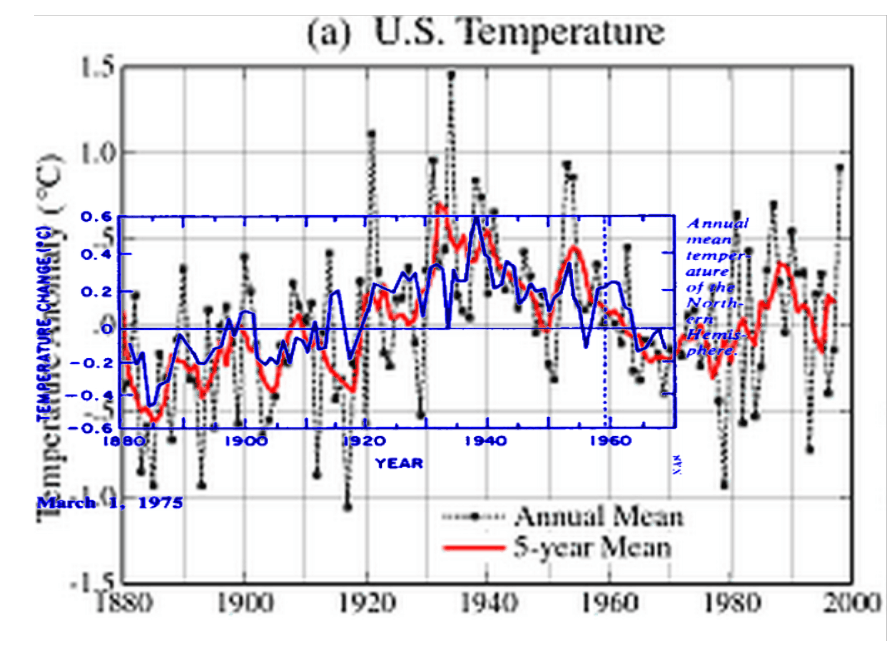
As of 1999, GISS showed that US temperatures (red) closely tracked 1975 National Academy of Sciences Northern Hemisphere temperatures (blue.) They both peaked around 1940 and declined rapidly thereafter.
Hansen was concerned that the US wasn’t warming like it was supposed to.
Whither U.S. Climate?
By James Hansen, Reto Ruedy, Jay Glascoe and Makiko Sato — August 1999
How can the absence of clear climate change in the United States be reconciled with continued reports of record global temperature? Part of the “answer” is that U.S. climate has been following a different course than global climate, at least so far
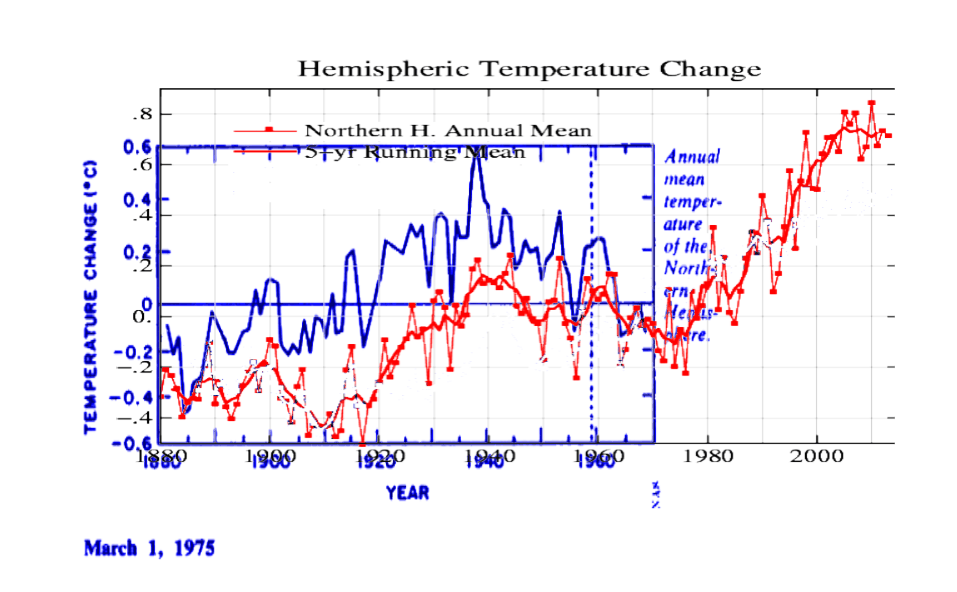
This was just before the hockey stick was invented, and in order to get rid of Briffa’s trees they had to create a divergence between US and global temperatures, and they had to make the post-1940’s cooling go away. They did just that, and now have almost completely eliminated the 1940’s warming spike. Current GISS northern hemisphere is in red below, normalized to the late 1960’s.
Data.GISS: GISS Surface Temperature Analysis: Analysis Graphs and Plots
https://ia801806.us.archive.org/7/items/understandingcli00un…
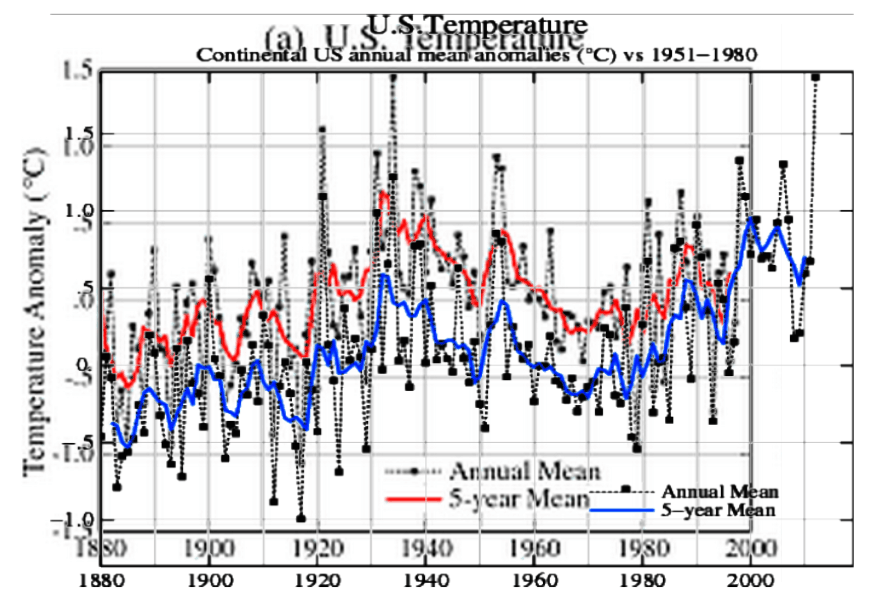
Simultaneously, they worked over US temperatures and made the Dust Bowl disappear. Graphs below have the five year means normalized to the most recent common date of 1997.
Bottom line is that Northern Hemisphere and US temperatures peaked in the 1930’s and 1940’s – and the hockey stick is government scientist manufactured junk science.
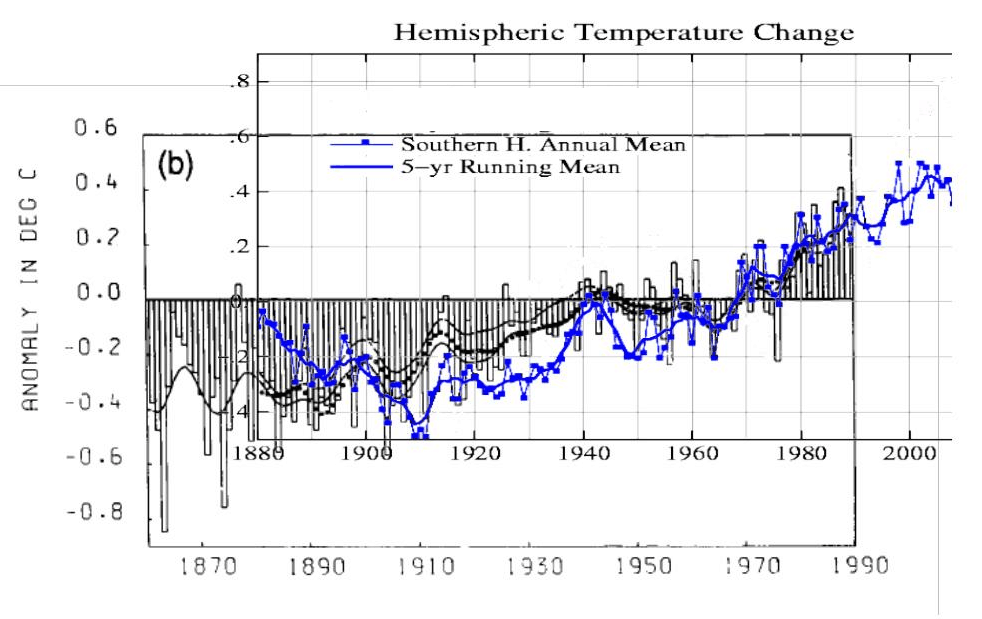
Extra credit. As of 1978, NOAA also showed strong southern hemisphere cooling, which GISS has completely eliminated and turned into a warming trend.
journals.ametsoc.org/doi/pdf/10.1175/1520-0493(1978)106<0755%3AGTVSMA>2.0.CO%3B2
The graph below shows GISS southern hemisphere temperatures in blue, vs. 1990 IPCC southern hemisphere in black.


There has to be a reason for the falling sea level. Canadians won’t like this news.
http://youtu.be/8EMoU8OOsBs
I couldn’t watch ice hockey at the Sochi olympics because of this. The very sight of a hockey stick gives me emesis.
Gotta wonder if the tampering of other continents records hadn’t commenced prior to the US tampering. Europe was ahead of us in this insanity. Russia said a few years ago their records have been altered by Western scientists…. not the original records, but those procured and used to determine global mean for presentation to the world. And I think it was NZ? who sued their government for altered records and won? I’ve seen articles of high 30s temps in Switzerland, (I think it was) and for Moscow also. For the US to see those temps, there had to be El Nino. That means the entire globe was warm. It’s virtually impossible for us to have been so warm while everyone else cooled. I say the 1930s were the “Grand Maxima” and it’s been a looping decline since.
Your graphs are powerful evidence of the manipulation that goes on. But I often think how posts on skeptical sites appear to the CAGW faithful or fence-sitters. Many people will just dismiss them because they don’t view the source as neutral. Most people don’t have the time or skills to plot graphs and the raw data is often not available anyway.
I was wondering if a step by step tutorial would convince more people -those skeptical of the skeptics. Perhaps a YouTube video showing where to get the original graphs, how to overlay one of on top of the other in Photoshop or whatever, how to move and stretch them till the scales match, etc.
I mentioned earlier that Wunderground (Jeff Masters) wiped out freezing temperatures and 6 inches of snow in my area that happened in the beginning of February and replaced it with temperatures just above freezing and rain with a trace of snow.
I just caught more “Fudging” of the data at my nearby weather station. This is a central North Carolina station and I am looking at Monthly temps 90°F and over for years, 2004 & 2010 & 2013.
First I was keeping track of the days with highs 90°F and above last summer. There was one day at 95°F and 4 days at 91°F as I mentioned several times last fall at WUWT.
I just looked at the data and low and behold there are now FIFTEEN DAYS instead of FIVE!!! Ten of those days occurred by the end of July so I would not have missed them. (see below)
As a Lab manager of a Quality lab for decades I learned the tricks for spotting ‘Flinching’ and other telltales of data fraud. (I got fired for catching the upper levels pet lab tech who was ‘Adjusting’ numbers so batches would pass and ship.)
One method for catching fraud is to look at the last digit and determine the count. If the data set is large enough the numbers should be equal. Since this is high temperature you would expect either equal numbers or a tapering off with more numbers at 0,1,2 3 than at 7,8,9
There were 105 days 90 and above for the three years I looked at so that is enough data to see a trend. The data is in °F but looked funny so I also included °C.
Temperature ———- COUNT
(32.2 °C) 90 °F..——..6 ALL in 2013
(32.8 °C) 91 °F..——..41
(33.3 °C) 92 °F..——..4 ALL in 2013
(33.9 °C) 93 °F..—–..10
(34.4 °C) 94 °F..——..0
(35.0 °C) 95 °F..—–..17
(35.55 °C) 96 °F..—..10
(36.1 °C) 97 °F..——..0
(36.67 °C) 98 °F..—..16
(37.2 °C) 99 °F..-..0
(37.77 °C) 100.°F-..1
Now that distribution is weirder than snake shoes. ALL the data for 90 °F and 92 °F is in 2013 and it just so happens to add up to the extra 10 above 90 °F that wasn’t in the same data set last year.
If you discount the 90 °F and 92 °F from 2013 (since they just mysteriously appeared) you get
(32.8 °C) 91 °F
(33.9 °C) 93 °F
(35.0 °C) 95 °F
(35.55 °C) 96 °F
(36.67 °C) 98 °F
(37.77 °C) 100.°F
32.2 °C is 90 °F where as 89 °F is 31.67 °C so that might explain the promotion of 89°F to 90°F as numbers got changed back and forth from °C to °F to °C. But it does not explain all the 96 °Fs instead of 97 °F which is 36.11 °C. As I said weird.
As a lab manager I would be asking some very pointy little questions of anyone who reported these type of numbers over a sixth month interval.
THIS IS THE DATA:
April 2004 (6)…April 2010 (1)…April 2013 (0)
2 days – 91F……..1day – 91F………(high 86F)
4 days – 93F……………………………………..
May 2004 (17)…May 2010 (4)….May 2013 (0)
6 days – 91F…….4day……. – 91….. (2 days 88)
6 days – 93F…………………………………….
2 days – 95F…………………………………….
1 days – 96F……………………………………
2 days – 98F…………………………………….
June 2004 (11)…June 2010 (18)…June 2013 (3)
1 days – 91F…….5 day – 91F………90F – 2
7 days – 93F……..5 days – 93F……………
none ……………….2 days – 95F………..95 F – 1
2 days – 96………2 days – 96F…………….
1 days – 98F……..4 days – 98F…………….
Jul 2004 (24)….Jul 2010 (15)…..Jul 2013 (7)
……………………………………………….90F – 3
4 day – 91F 91F – 4…………91F – 1
11 days – 93F 93F – 4………..92F – 3
1 days – 95F. 95F – 2
days – 96F 96F – 2
7days – 98F 98F – 2
………………………….100F – 1
Aug 2004 (12)…Aug 2010 (13)…Aug 2013 (4)
……………………………………………….90F – 1
1 day – 91F 91F – 4………….91F – 2
8 days – 93F 93F – 3………….92F – 1
3 days – 95F 95F – 5
0days – 96F 96F – 1
Sept 2004 (0)…Sept 2010 (11)..Sept 2013 (1)
0 days – 91F 91F – 5…………91F – 1
0 days – 93F 93F – 3………..
0 days – 95F 95F – 1
0 days – 96F 96F – 2
Steven,
Snowden has released information that confirms what I independently witnessed on some science blogs:
http://beforeitsnews.com/alternative/2014/02/snowden-training-guide-for-gchq-nsa-agents-infiltrating-and-disrupting-alternative-media-online-2906204.html?utm_source=direct-b4in.info&utm_campaign=&utm_term=http%3A%2F%2Fb4in.info%2FfUWX&utm_medium=verticalresponse&utm_content=beforeit39snews-verticalresponse
I agree Oliver.
I have pin pointed these “Change Agents” on several different blogs over the years.
They are different from the usual run of the mill troll because they seem fairly rational on a variety of subjects, agree with most of the prevailing thought and thereby gain people’s trust. However on one specific point and only on that point they go off the rails and will mock people who post reasonable evidence. They often post contrary evidence and NEVER EVER budge an inch no matter what evidence is presented to the contrary on the blog. This is not typical of a normal human. We all grow and modify our opinions as new data becomes available. These “Change Agents” never do. They are static on the propaganda they are tasked with protecting.
This creates “cognitive stress” among the group within the blog as they try to match the propaganda with reality. Because the person doing the propagandizing is ‘Trusted’ people give more weight to their words than they do to a troll. If the person has a PhD in the subject and it is not your area of expertise you are going to start doubting your view of reality. You can see this happening at various websites.
There is one person who ALWAYS shows up to ‘Protect’ the CO2 data base but generally doesn’t have much else to say. There is another who ALWAYS shows up to ‘Protect’ the “Sun/TSI does not vary” but generally doesn’t have much else to say. There is one person who ALWAYS shows up to ‘Protect’ the Temperature data base.
And I have been the target of someone protecting the Federal Reserve/banking empire and UN Agenda 21.
Correction: Snowden has released information that confirms what I independently suspected on some science blogs.
Consensus physics was successfully protected on PhysOrg
Big Brother is doing much more than watching you…
This is really offensive. All adjustments should be justified through peer-reviewed journal articles. All versions of the dataset should be archived and publicly available. All the code used to make adjustments should be publicly archived with all versions present using open source source-code management software such as git.
The security and reliability of the software and data of slot machines in Nevada exceeds that of the climatic record by order of magnitude.
Steve,
You are, indeed, the late John Daly reincarnated: http://pages.citebite.com/d2r8j2k7a0sfo