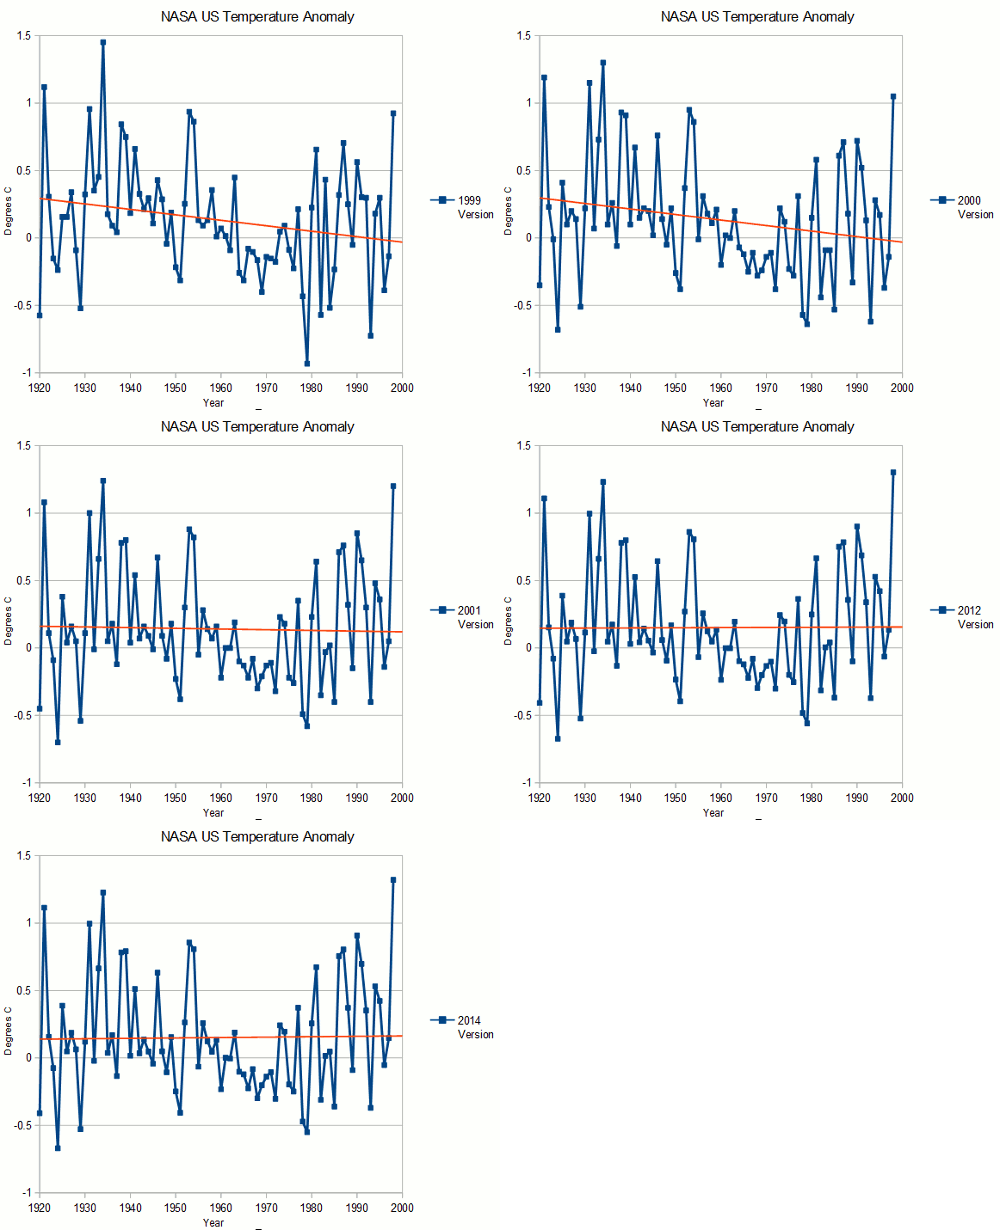
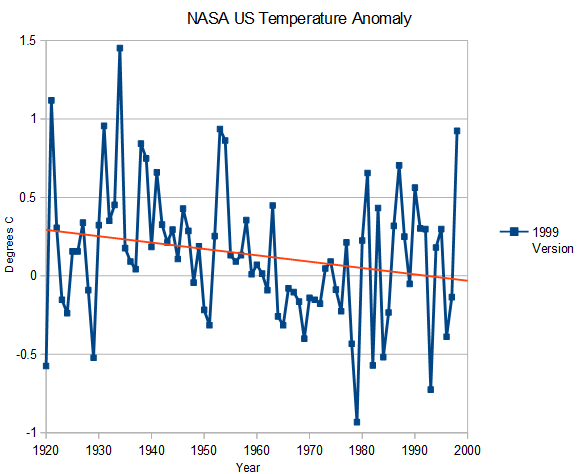
My previous animation of GISS US temperatures wasn’t quite right. What I had labeled as the 1999 version, was actually the 2000 version. The animation below shows the actual 1999 version.
As of 1999, 1998 was the fifth hottest year after 1934, 1921, 1931 and 1953. By 2000, it had been promoted to third hottest. B 2001, it had been promoted to the second hottest year, and by 2012 it was the hottest year.
An impressive demonstration of continuous and ongoing tampering – to create the impression of a non-existent warming trend.
Note the strong cooling trend which NASA showed in the 1999 version, and has since completely been erased.


I wish I got promotions like that.
In 5 years I could be a CEO without doing anything!!
That’s a pretty good trick, and nobody (well, very few ppl incl you and Dr Easterbrook) “really noticed” … if we had a functional ‘press’ in this country … well, we don’t. And we won’t. The press is becoming just another distraction …
Steve
Another guy has done some work with the GISS data and is report on WUWT
http://wattsupwiththat.com/2014/07/03/giss-hockey-stick-adjustments/
I wonder whether he’ll get the same flak you have got ? ( BTW there was a comment on Jo Nova’s site in relation the flak David Evans is getting –it went something like this ” When you are getting flak you know you are near the target” )
Everyone is jumping on the publicity ban wagon. That’s great , in my view. The more the merrier.
So, uh, It’s worse than we thought? 🙂
Some folks at NOAA and NASA seem to be running scared. Probably driving over their hard drives with their gas-guzzling SUVs. A lot of their most blatant chicanery is being discontinued, slowly, methodically, without any fuss or fanfare. Old high temperature records set in the in the 1930’s were smashed when July 2012 was pronounced hottest July ever. A few days ago July 2012 was expunged from the record books and the old one,1936 I believe, was once again the hottest month ever. In other news, Gov’t scammers had moved thermographs from shady grassy lawns to black topped parking lots, and next to A/C compressor hot air exhausts. Photos of these and similar tricks were all over the internet, along with snarky comments from “deniers” like myself. Reportedly, NOAA is removing those instruments quietly as well. I suspect that the trouble over at the IRS, with the likes of Lois Lerner being threatened with incarceration, has made corrupt climatologists want to cover up some of their bogus “science.” Lois Lerner, at least, can’t be said to have gotten anyone killed. Thanks to their false data and secret agenda-driven computations, crooks at NASA and NOAA have forced Americans to burn food in our cars. Grain prices soar; relief agency budgets can’t provide enough food; millions of poor people of color starve. There are a lot of people like me who would enjoy seeing Al Gore, and Michael Mann of Penn State, and Phil Jones of CRC East Anglia, and Jim Hansen of NASA’s GISS, and their accomplices on trial in the Hague for crimes against humanity. I’d assassinate my hard drive to prevent that happening to me. Wouldn’t you? End of snarky comments, all of which are opinion only.
They were giving Tony a bunch of grief, UNTIL they realized he was right. Plenty of room on the bandwagon of truth.
Cheat, cheat, never beat!
Giss already admits they fudge the answers! It has been on their web site for years.
For your reading pleasure:
http://data.giss.nasa.gov/gistemp/abs_temp.html
Excerpt:
Q. If SATs cannot be measured, how are SAT maps created ?
A. This can only be done with the help of computer models, the same models that are used to create the daily weather forecasts. We may start out the model with the few observed data that are available and fill in the rest with guesses (also called extrapolations) and then let the model run long enough so that the initial guesses no longer matter, but not too long in order to avoid that the inaccuracies of the model become relevant. This may be done starting from conditions from many years, so that the average (called a ‘climatology’) hopefully represents a typical map for the particular month or day of the year.
No two model runs are ever the same and the Al-Gore-Rhythm used to train the model results in the differences you see.
Did someone say there is a problem with the models?
http://www.youtube.com/watch?v=vJfx0d-mmIo
Never saw that last one coming, er, rather I did see it afterward …
If you don’t believe government agencies and people are capable of pencil-whipping temperatures and temperature trends to match their wacky AGW theory and without nefarious intent… read on.
The Ocean Ate My Promotion (courtesy of NASA – in their own words)
“Oh, no,” he remembers saying.
“What’s wrong?” his wife asked.
“I think ocean cooling isn’t real.”
“I was aware that they were not seeing this huge cooling that we were seeing in the ocean,” says Willis. “In fact, every body was telling me I was wrong.”
But if you have to watch your research go down in flames, it may help to regard it as an offering on the sacrificial fire of scientific progress. In the case of “ocean cooling,” Willis has plenty of reasons to consider the sacrifice worth it.
The first payoff for finding and fixing the XBT errors was that it allowed scientists to reconcile a stubborn and puzzling mismatch between climate model simulations of ocean warming for the past half century and observations.
“Those bumps gave everyone heartburn,” says Willis. There was no established physical explanation for them, and climate models didn’t reproduce them. The science community wasn’t sure whether the discrepancy cast doubt on the models or the observations, but fingers got pointed in both directions.
“being able to show that climate simulations and observations were in better agreement than they previously seemed was only the first payoff of the corrections to the XBT data.”
http://earthobservatory.nasa.gov/Features/OceanCooling/