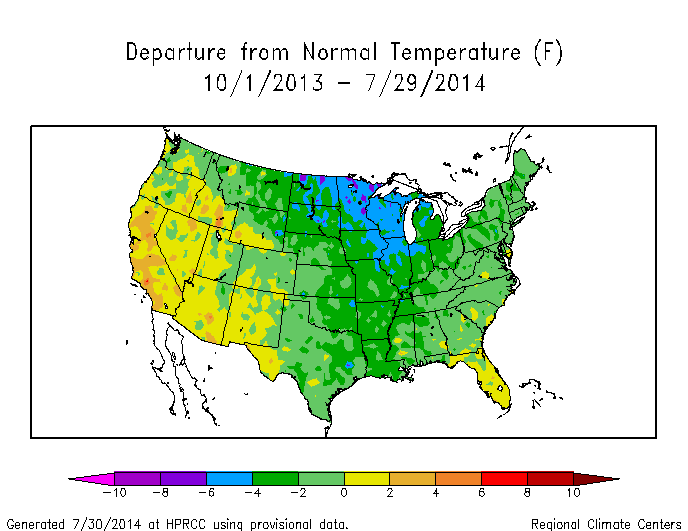
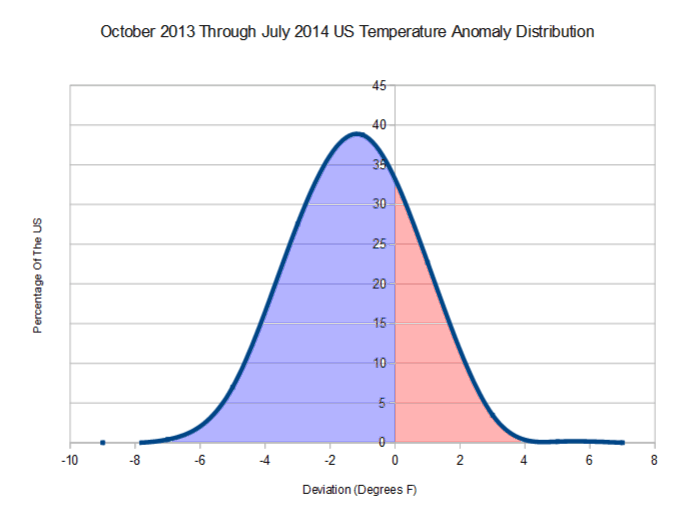
Over the past 10 months, 74% of the US has been below normal, with the average deviation being -1.25 degrees F.
Seventy four percent of the US has been below normal temperature over the past 10 months
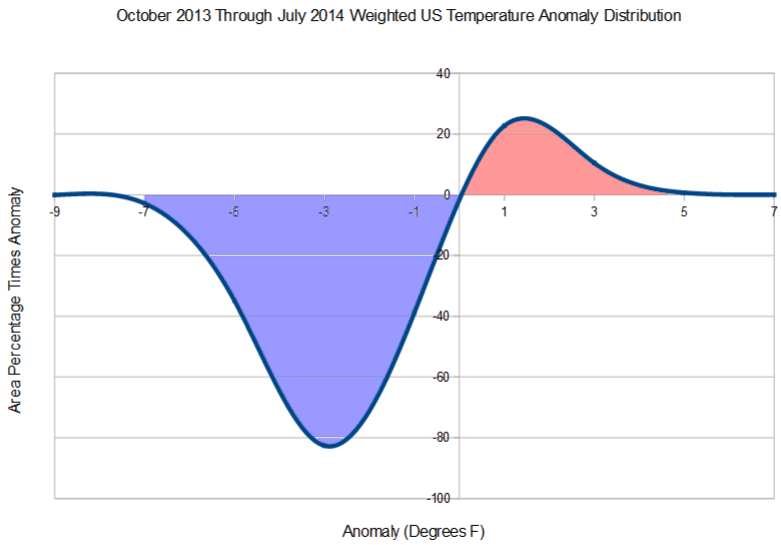
The temperature anomaly weighted by area shows that cold temperatures have been heavily dominating the US climate.


Until they “adjust” the figures.
But the US is only X% of the world, California is above normal, etc.
Yes but the rest of the world has not been exactly warm either not that you will ever hear that from the MSM. Please note that hail means fierce updrafts that transport energy straight up to the stratosphere.
2014 for just June 30, til July 31
H/T Argiris Diamantis and Robert Felix and the rest at IceAgeNow:
Rare snow blankets Bombala, a town in south-eastern New South Wales, Australia, approximately 485 kilometres south of Sydney.
http://www.bombalatimes.com.au/story/2436044/snow-blankets-district/?cs=12#slide=1
http://en.wikipedia.org/wiki/Bombala,_New_South_Wales
Russia – Large hail fell last night on the Omsk region. Crops suffered as a result of the “bombing.”The hail also left damaged power lines and broken glass in homes. According to eyewitnesses, the ice “artillery” literally bombed orchards and greenhouses in several villages, reports “Rossiyskaya Gazeta”.
http://www.classomsk.com/news/5440-krupnyj-grad-unichtozhil-urozhaj-v-omskoj-oblasti
Brisbane recorded its coldest morning in 103 years on July 13, 2014, with low temperatures also being felt across the rest of the Queensland state.
http://www.sunlive.co.nz/blogs/6890-brisbane-feels-coldest-morning-103-years.html
Temperatures in the North of Portugal are well below the average for decades, says reader Ingbor @ IceAgeNow. http://uk.weather.com/weather/10day/Porto+13+Portugal+POXX0022:1:PO
“Here in Serbia the summer is coldest is in my living memory,” writes Marijana. “It’s more like autumn than summer…. link
Everyone forgets to add in the land area of Canada to that 2% in the USA. If a Polar Express hits the USA it came via Canada donchta know. {:>D
Record lows in five Saskatchewan communities
http://www.cbc.ca/news/canada/saskatchewan/cold-weather-records-fall-in-saskatchewan-1.2706459
Record cold in Winnipeg – Coldest July 13th since 1884
http://www.cjob.com/2014/07/14/record-low-temps-hit-winnipeg/
Manali, India – Coldest summer season in decades
http://timesofindia.indiatimes.com/India/Manali-feels-coldest-summer-season-since-decades/articleshow/38231107.cms
Freak summer blizzard and hail hit Siberia, Urals ( town of Zlatoust in Russia’s South Urals )
http://rt.com/news/172468-freaky-snow-urals-siberia/
Brisbane – Vegetable prices expected to soar
Heavy snowfall in the Alps this week
http://www.blick.ch/news/schweiz/was-fuer-ein-mieser-sommer-jetzt-kommen-hagel-schnee-und-hochwasser-id2970581.html
http://www.srf.ch/news/schweiz/schlechtes-wetter-vermiest-den-bergfuehrern-den-saisonstart
More than a foot (35 cm) of hail in Spain
videos:
http://nos.nl/video/669973-spanjaarden-verrast-door-dikke-laag-hagel.html
http://www.canalsur.es/noticias/españa/nieve-en-pleno-verano/407409.html
Maltempo, Italy – 20 cm (8 inches) of snow today
http://www.youreporter.it/gallerie/MALTEMPO_Le_Alpi_questa_mattina_dopo_le_nevicate_di_stanotte/#1
Anecdotal reports:
Looks like September in Frankfurt said E. Philipp because his raspberry bushes have reddish leaves rather than true green as is normal here in Frankfurt
http://www.dailymail.co.uk/news/article-2675888/It-summer-nature-autumn-Fields-woodlands-showing-signs-change-normally-seen-August-September.html
Roman says on July 1, 2014 : At the begining of the last week 3 nights in a row the minimum officially recorded temperature in northern Poland was… 0 C or 32 F. and John McC says, Our local N. Ireland BBC news reported that the temperature in Katesbridge, Co. Down, fell to only 1C in the early hours of July 1st. It is so unusual for temperatures to fall this close to freezing point in July. It may be a record low for the time of year….
Portugal weather “more like late September” confirmation from readers (with links)
Steve I think Al Gore ate my last comment July 31, 2014 at 2:06 pm
I think that California needs to ask Al Gore to visit.
Really cold here in Adelaide Australia. We just had some snow fall at 200 mtrs elevation at Flagstaff Hill. It rarely gets below zero here and then only above 400 odd mtrrs.
See http://eyesonbrowne.wordpress.com/2014/07/31/unprecedented-snow-in-adelaide/
Where is Jim Hunt, I could use some laugh today
Outside of the EPA hearings in Denver, “The Climate Reality Project” was giving out ice cream as part of its “I’m Too Hot” campaign. In real life, it should have been giving out hot chocolate, as the record low temperature high (62F) was set for the date. Is the Gore Effect real?
http://nation.foxnews.com/2014/07/30/climate-doesn’t-cooperate-al-gore’s-group’s-visit-denver-epa-hearings
It may be a long series of coincidences. I like to think of it as karma.
Plus I think it’s hilarious that the climate keeps a small, cold, black cloud over Big Al for little publicity stunts like this.
IMAGE
Its the “Gore Effect” once again !!
Record cold !!
Check out the responses on here to Lagarde and the IMF in relation to Climate Change…
There is some hope… some folks even knew about NASA/NOAA altering data !!
http://news.yahoo.com/imf-urges-higher-energy-taxes-fight-climate-change-152243700–business.html;_ylt=AwrTWf1bb9pTlFkAmZjQtDMD
Steven,
Really like the last two charts – the weighted anomaly chart (last chart) is very good. How did you do them?
Are those charts of real data? Or representations of what a normal distribution with the same average and sigma would look like?
They look too perfect.
Lifted from Ice Age Now: Julember. From the older times, July through August were known as the “dog days” in the NH; very hot, very humid, and very stagnant. Anyone in the Mid-Atlantic through the South and over to East Texas knows those days well. So far this summer, the dogs ain’t hunting.