
NOAA/NASA are making moves towards claiming that 2014 is the hottest year ever, based on their bogus surface temperatures.
More accurate satellite data shows 2014 as quite ordinary, and 0.4C below the hottest year of 1998.
rss_monthly_msu_amsu_channel_tlt_anomalies_land_and_ocean_v03_3.txt
NASA knows that satellite data is more accurate than surface data, but they choose to ignore it because it doesn’t fit the global warming agenda.
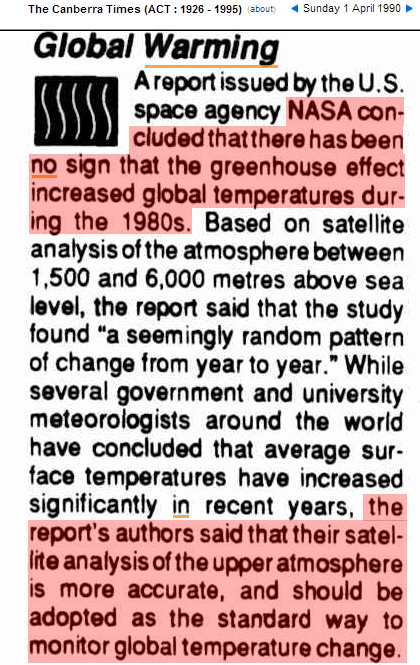
01 Apr 1990 – EARTHWEEK: A DIARY OF THE PLANET Global Warming

They are doing their hardest to stop the pause.
Aw c’mon man – what’s 0.4C between friends?
Thanks, Steven, for having the courage to call a spade a shovel.
Since NASA was established, NASA’s primary purpose has been to obscure the source of energy that generates energy, fuel and food with pseudo-cosmology, astronomy, nuclear and astro-physics so world leaders could themselves assume the historical role of God with totalitarian control over all humanity.
These three forms of the same commodity (energy, fuel and food) are natural products of spontaneous transformation of compressed nuclear matter (mostly neutrons) from cores of heavy nuclei, stars and galaxies into expanded atomic interstellar matter (mostly hydrogen) as our infinite universe expands in half of one cosmic breath [1-3]
1. “Is the Universe Expanding?” The Journal of Cosmology 13, 4187-4190 (2011):
http://journalofcosmology.com/BigBang102.html
2. “Neutron Repulsion”, The APEIRON Journal 19, 123-150 (2012):
http://redshift.vif.com/JournalFiles/V19NO2pdf/V19N2MAN.pdf
3. “Solar energy,” Journal of Solar Energy (submitted 25 July 2014) https://dl.dropboxusercontent.com/u/10640850/Preprint_Solar_Energy.pdf
Hiding the decline must be maddening to them. There has to be at least one true scientist in NASA who will come forward, someone with integrity.
The only requirement is to love truth more than self.
Actually, the hypothesis is that surface temps should increase and high altitude should decrease in temp. The greenhouse effect which was already present produces the temperature gradient, which in turn produces weather. Without it, we would have not air movement or life as we know it.
The hypothesis then predicted a cool spot in high altitudes over the tropics because of increase moisture there. It is the feedback of moisture which is in question.
The fact is none of the predictions have occurred and the only reasonable explanation is that any increase in warming due to an increase in CO2 is insignificant when compared to natural variability.
Likewise, the predicted increase in weather extremes due to a larger temperature gradient is therefore not even arguable.
Actually darrylb, you’ve got it exactly backwards. Standard enhanced “greenhouse” warming theory says that the mid and upper troposphere should warm faster than the surface. This is due to a more active hydrological cycle causing more (cooling) evaporation at the surface and more (warming) condensation at higher altitudes.
This is the source of the predicted “hot spot” (not “cool spot”) in higher altitudes over the tropics. Look at the IPCC reports for the big red oval over the tropics in their graphics.
You may be confusing this with the predicted cooling of the stratosphere, which is completely above the hydrologic cycle.
Interestingly, this hot spot prediction, reducing the vertical temperature gradient, along with the “polar amplification” prediction, which would reduce the horizontal temperature gradients, should serve to reduce extreme weather. But you never hear that out of the alarmists.
In the graph we see a plunge in temperatures in 1998-1999 and another one 8 years in 2008, which went even lower than 1999.
Now, taking into account the cyclic nature of the climate, 🙂 , it’s “safe to predict” that another plunge is about to happen, either now or in 2015.
This time though the temps should go even more negative than 2008.
In fact, I think this is the general trend indicated by ENSO
http://www.climate4you.com/images/NOAA%20SST-Nino3-4%20GlobalMonthlyTempSince1979%20With37monthRunningAverage.gif
Reblogged this on the WeatherAction Blog.
When it is cold we can think about their lies and that will make us feel all warm and fuzzy. Or throw another one on the fire………. Log I mean, not climate scientist. LOL
I prefer the idea of a Scientist.
+1
(just as long as it is a Climastrologist)
The warmists really really want to do this BTW: Burn Those Deniers Houses Down and IMAGE from Wackadoodle 350.org protesters disappear their KKK moment
No wonder the politicians want top censor the internet!
How many GT of carbon do we spew into the atmosphere if we throw all of their “Peer Reviewed” papers on the fire along with the model print outs?
Just burn them in multi-fuel power plants that are now burning wood chips and get some use out of them.
Since the paper (supposedly) came from trees (organic biomass) it is “GOOD CO2” not EVIL “Coal CO2” (from fosillized trees and biomass)
The loony logic of the left makes my head spin.
Hello, I have a background in statistics, with some experience in time series analysis. (I am not a climate scientist, not even close.) I have been following the global warming push closely for more than 10 years. I’ve never actually pulled the data, but am curious to do so. Question: what is the most widely “accepted” measure of surface temperature (if there is one), and can I download raw data for that which go back much earlier than 78? I’m curious to look myself at what the trend look like when the anomaly is calculated from different baselines. I’m also curious to look at trends prior to 78. (Albeit with less accurate, non-satellite data.)
Prescient.