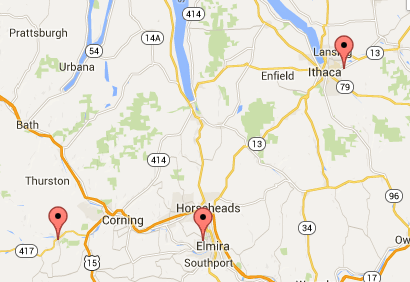
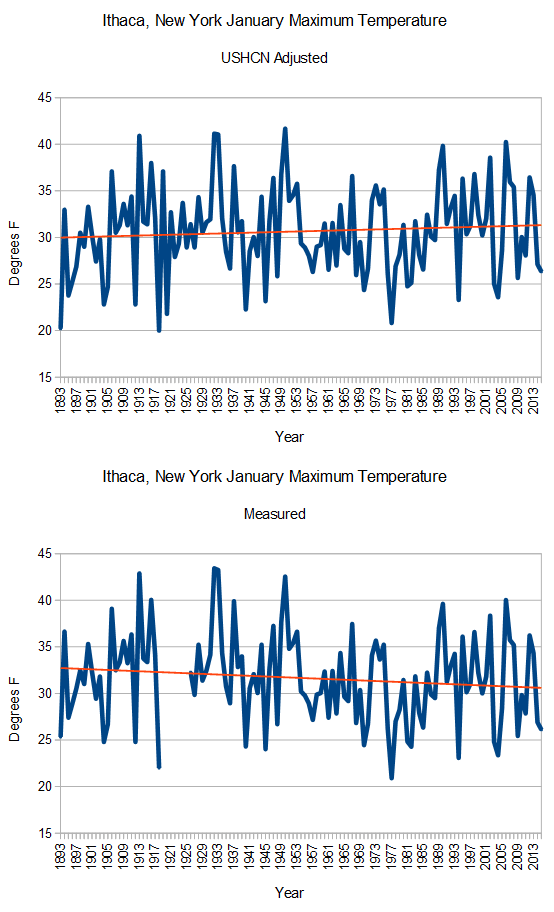
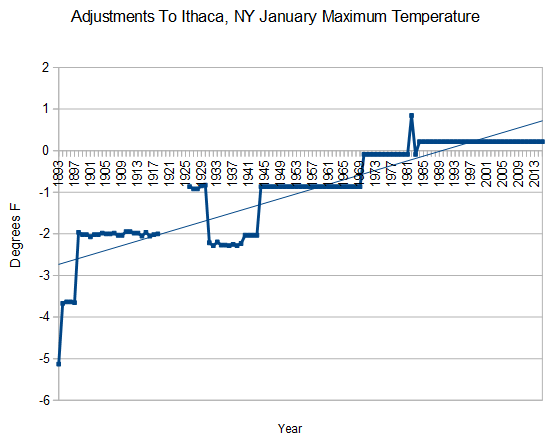
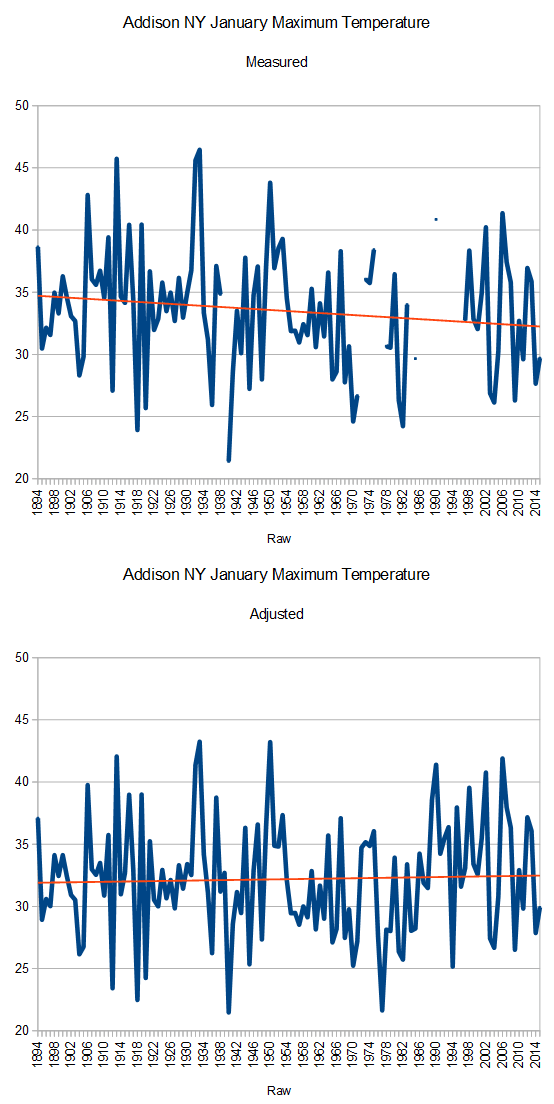
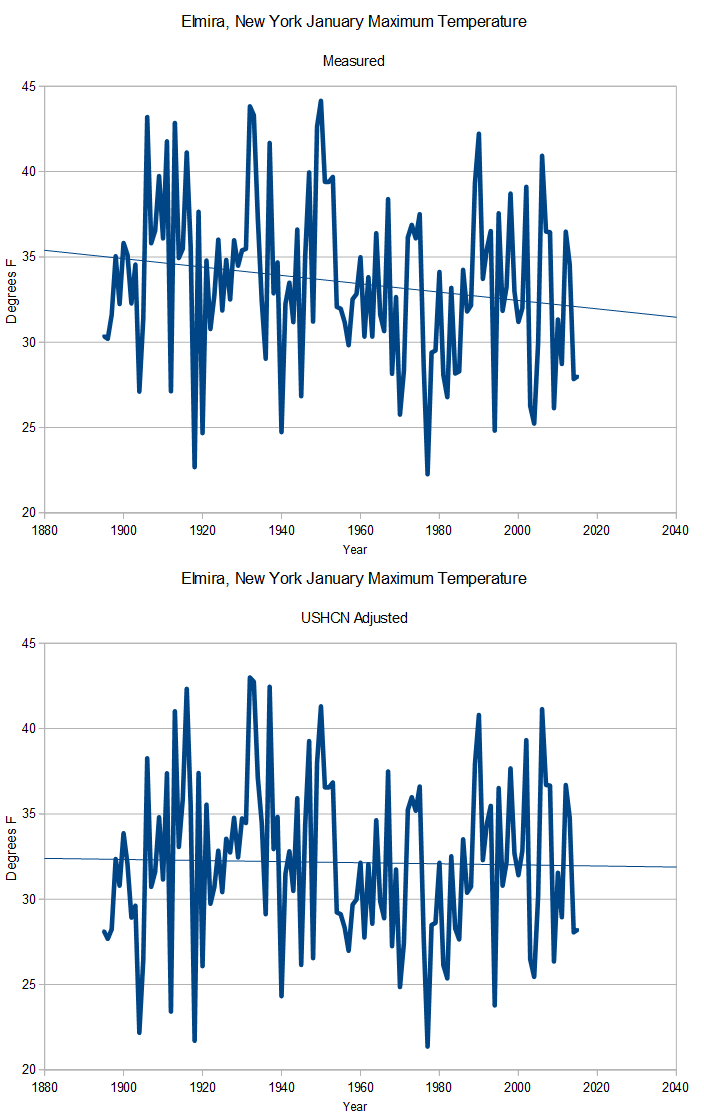
Moving on to the next adjacent town in New York, Ithaca has exactly the same pattern as Addison and Elmira. The past cooled by as much as five degrees, turning a strong cooling trend into a warming trend. Zeke and Mosher tell us this is all good.
It defies explanation how anyone could claim these adjustments are legitimate.

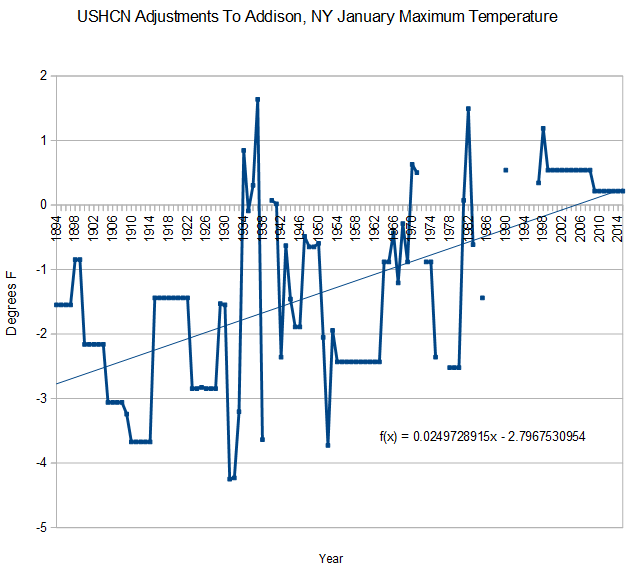
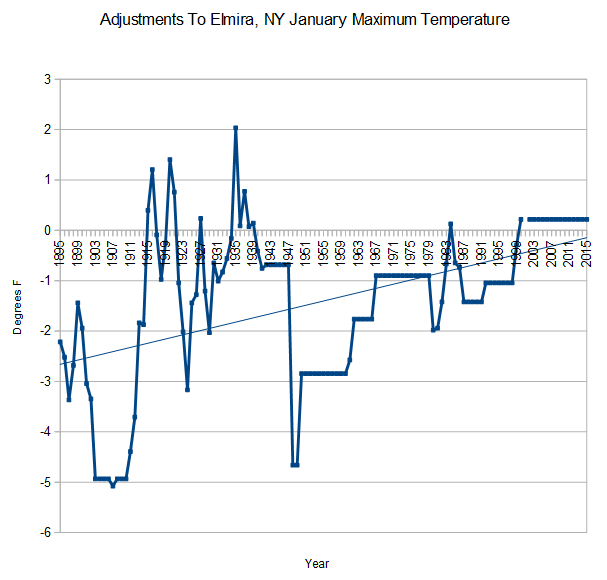

I could almost buy agjustments as being the result of a theory by which an honourable person got it wrong. But these adjustments would be constant with step changes to account for changes in equipment or environment.
The changes you have highlighted seem to be driven by a requirement to get a specific value for each year. Making the data fit the theory.
The real beauty is that after all these adjustments and all this global non-warming, the temperatures were STILL warmer in 1913, 1936, 1948 than now.
(dates read from graph so +/- a couple)
Keep an eye on these SG, Gavin will still be looking for more warming, if he can manufacture it.
With every stations being adjusted to show a warming trend, one almost gets the feeling that this has been done on purpose…
NAH.. Our government wouldn’t lie… much.
https://stevengoddard.files.wordpress.com/2014/10/screenhunter_3233-oct-01-22-59.gif
Changing wind patterns can cause step changes, and this is well documented. No need for siting, sensor or land use change, just a shift in the breeze is all it takes.
All it takes is a front going through. I had the misfortune of entering a wet cave while it was 70F and coming out 7 hours later to below freezing and a blizzard with a foot of snow on the ground. I hate having to cut my frozen boot laces to get my boots off. Changing out of wet clothes was a real treat too…
Actually all this adjusting of “break points’ is what has taken curves and straightened them out. You do not even have to do it by hand. As Motl said the BEST Team has a computer program do it for them.
https://stevengoddard.files.wordpress.com/2013/08/reykjavik.gif?w=640
Question? Has BEST ever done spot checks of their dicing and splicing algorithm to see how well it performs? Have they compared to metadata to find out if stations were actually moved or equipment updated etc… that might cause a breakpoint? I have my doubts but have not had the time to wade through their voluminous BS to find out.
“Pat, can i buy a 5 degree adjustment”…Wheel of Temperatures….
Here’s the TOB adjustment (max temp) contribution to these stations. It’s done first.
Ithaca
1893 – 1897 = -1.6
1898 – 1939 = 0
1940 – present = 0.2
Addison
1894 – 1984 = -1.7
1985 – present = 0.2
Elmira
1894 – 1910 = -0.4
1911 – 1947 = 0.1
1948 – 1949 = -1.6
1950 – present = 0.2