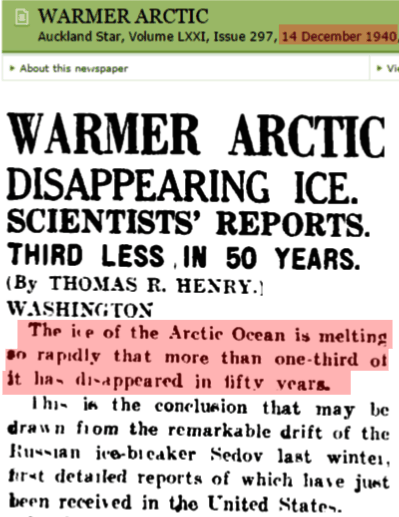
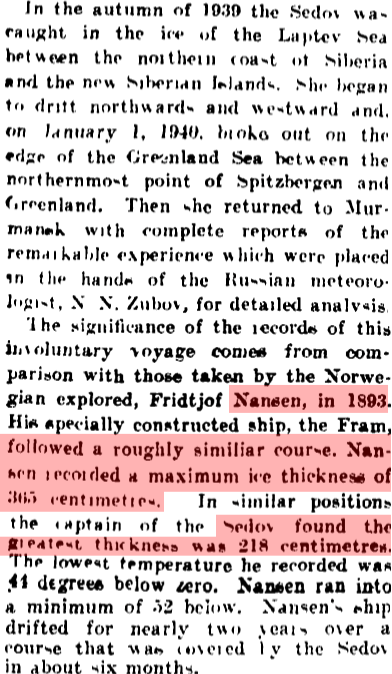
Between 1893 and 1940, maximum Arctic ice thickness dropped from 365 cm to 218 cm.
Papers Past — Auckland Star — 14 December 1940 — WARMER ARCTIC
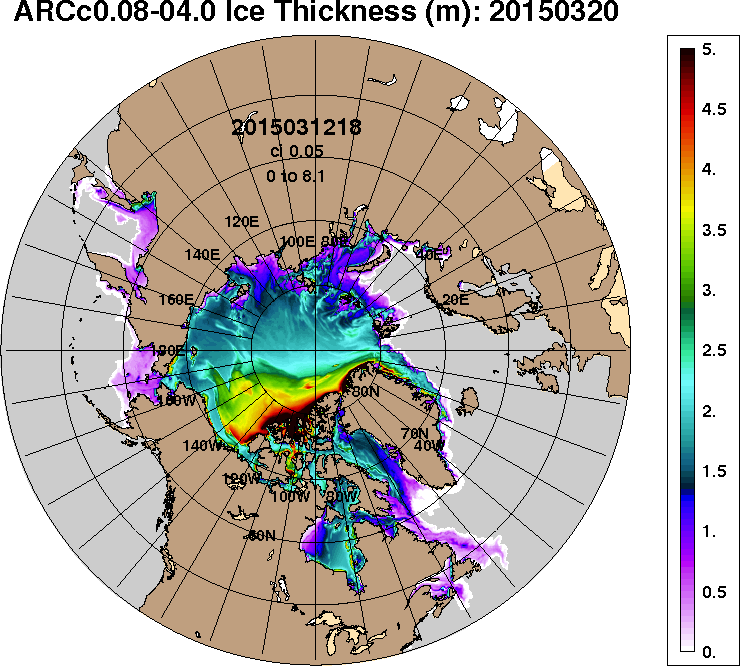
The US Navy reports that ice thickness between Spitzbergen and Greenland is currently two metres – the same as it was in 1940.
This is why government climate experts have been tampering with data to make the 1940’s blip disappear.
From: Tom Wigley <[email protected]>
To: Phil Jones <[email protected]>
Subject: 1940s
Date: Sun, 27 Sep 2009 23:25:38 -0600
Cc: Ben Santer <[email protected]>It would be good to remove at least part of the 1940s blip, but we are still left with “why the blip”.
Mike,
Can you delete any emails you may have had with Keith re AR4? Keith will do likewise… Can you also email Gene [Wahl] and get him to do the same? I don’t have his new email address. We will be getting Caspar [Ammann] to do likewise.
Cheers, Phil


So Arctic ice and world politics are back to the conditions of 1940. Great.
Hilary’s reset button worked. Problem is it was the wrong era.
https://www.youtube.com/watch?v=9sudCmrAsF4
And the wrong translation, maybe they should have consulted Condi Rice.
If that were the only screw up, it’d be amusing. Problem is these clowns came to office with their “open hand” stance toward Iran, North Korea, Russia, etc. as if we’ve just been treating them meanly and we just have to talk nice. I remember Obama arrogantly saying something about negotiating with Iran “at a time and place of my choosing.” As if he could just snap his fingers and Iran would come running. He said nothing as Iranians were dying in the streets protesting rigged elections, and now with 2 years to go is trying to get any kind of deal, no matter how bad to pretend he had a clue what he was doing.
gator69 I see what you did there, comrade.
If they were to adjust the Arctic sea ice from the 1940s it would might make it impossible for the convoys to resupply the Soviet war effort.
It will be interesting to follow Hudson Bay this summer.
Will it melt?
O yeah, the Arctic ice is disappearing all right, sure it is (sarc). But where is it disappearing to? Well, where would you like to go to yourself if you were raised in the Arctic? To Hawaii of course. That’s where the ice is going to today. Here some video that proofs that what I say is right.
http://www.bigislandvideonews.com/2015/03/12/blizzard-evacuates-mauna-kea-snow-removers-observatory-crews/
Around Mexico City too.
A story in Spanish:
http://www.eluniversal.com.mx/ciudad-metropoli/2015/cierran-la-mexico-puebla-por-malas-condiciones-climaticas-1083942.html
In English:
http://www.newsday.com/news/world/snow-closes-a-major-highway-into-mexico-city-1.10052154
And Wales…
on Friday morning the road was inaccessible in both directions between the A44 at Llangurig and the B4518 at Llanidloes.
Dyfed-Powys Police said there had also been disruption on parts of the A4215, A4067 and the A4059.
http://www.bbc.com/news/uk-wales-31866089
http://news.bbcimg.co.uk/media/images/80638000/jpg/_80638542_philweather.jpg
H/T Argiris Diamantis and IceAgeNow
Wow, they closed the observatory road in Hawaii due to the blizzard lasting more than a day???
Amazing.
http://www.theage.com.au/environment/climate-change/winter-ice-in-the-arctic-nears-alltime-record-low-20150314-14469b.html
Record Low Arctic AHHAHAHAHAAHHAHA WTFFFFFFFFFFFFFFFFF
You’re on thin ice, Steven.
http://onlinelibrary.wiley.com/doi/10.1029/2009GL039035/abstract
[1] The decline of sea ice thickness in the Arctic Ocean from ICESat (2003–2008) is placed in the context of estimates from 42 years of submarine records (1958–2000) described by Rothrock et al. (1999, 2008). While the earlier 1999 work provides a longer historical record of the regional changes, the latter offers a more refined analysis, over a sizable portion of the Arctic Ocean supported by a much stronger and richer data set. Within the data release area (DRA) of declassified submarine sonar measurements (covering ?38% of the Arctic Ocean), the overall mean winter thickness of 3.64 m in 1980 can be compared to a 1.89 m mean during the last winter of the ICESat record—an astonishing decrease of 1.75 m in thickness. Between 1975 and 2000, the steepest rate of decrease is ?0.08 m/yr in 1990 compared to a slightly higher winter/summer rate of ?0.10/?0.20 m/yr in the five-year ICESat record (2003–2008). Prior to 1997, ice extent in the DRA was >90% during the summer minimum. This can be contrasted to the gradual decrease in the early 2000s followed by an abrupt drop to <55% during the record setting minimum in 2007. This combined analysis shows a long-term trend of sea ice thinning over submarine and ICESat records that span five decades.