
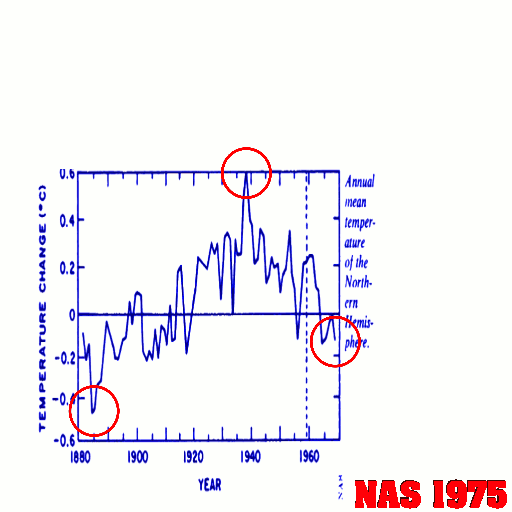
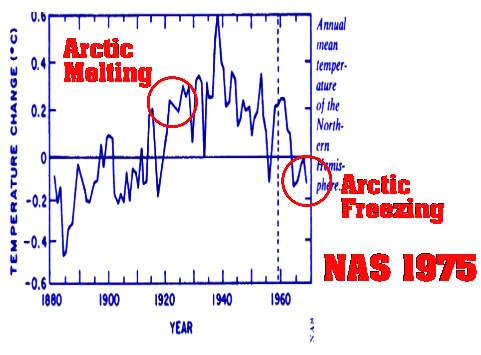
In 1975, the National Academy Of Sciences published this graph, showing about 1°C warming in the Northern Hemisphere from 1885 to 1940, and that all 1900 to 1940 warming was lost by 1970.
GISS has since reduced the 1885 to 1940 warming by half, and reduced the 1940-1970 cooling by two thirds.
The next graph shows an overlay of the two at the same scale, normalized to 1905-1940
The animation below shows how they reduced both the pre-1940 warming, and the post-1940 cooling. Neither are explainable by global warming theory, so government experts made both largely disappear.
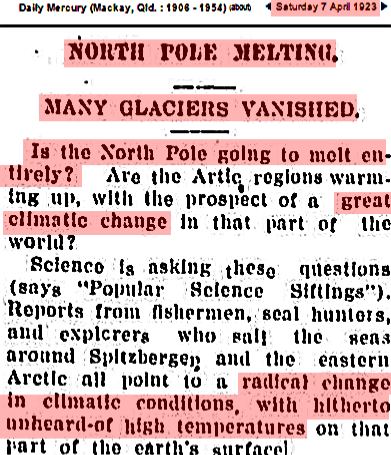
So which one is correct? In 1923, the Arctic was very warm and melting rapidly.
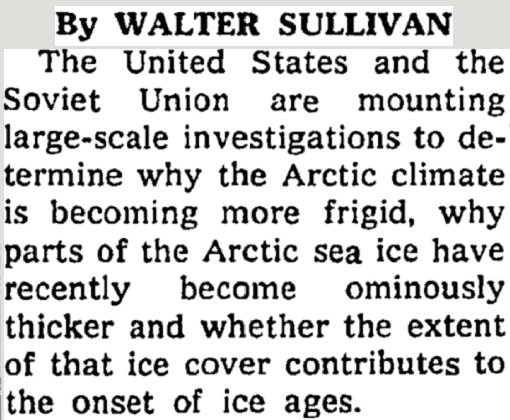
But in 1970, the Arctic was very cold, and ice was expanding rapidly.
TimesMachine: July 18, 1970 – NYTimes.com
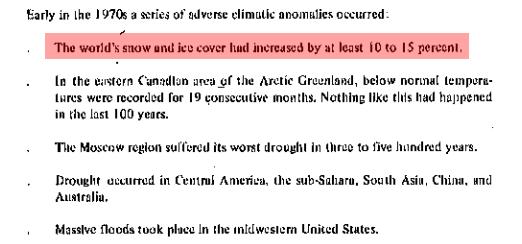
The 1975 NAS graph makes sense. The Arctic melting when it is warm, and freezing when it is cold.
But what about the current GISS graph? It shows the Arctic melting when it is cold, and freezing when it is warm.
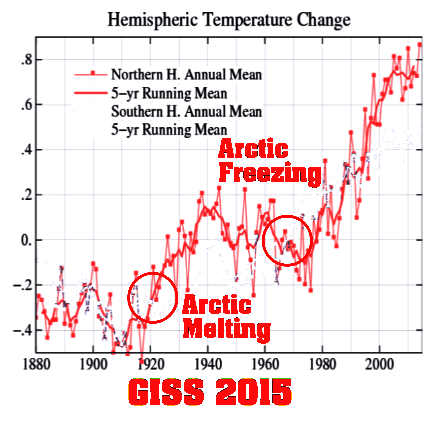
It is painfully obvious that the GISS temperatures are fraudulent, yet several prominent skeptics continue to enable this scam by pretending that the NASA/NOAA temperatures are somehow legitimate.

Reblogged this on Centinel2012 and commented:
George Orwell, “Who controls the past controls the future. Who controls the present controls the past.”
GISS has hardly any data on the arctic for the early part of their analysis, and none of the southern pole. The dishonesty is presenting the graphs as anomalies for the entire hemispheres.
The same is true for a lot of land area, there is almost no data, or none at all, for much of the land in the past. Using their recent surface data can be useful, but the old reconstruction certainly is bogus.
I disagree stx. The ice age scare was real, and the early NH T looks far more accurate. There was no call that the cooling was anthropogenic, and so no political basis for not being as accurate as possible. The CAGW advocates openly expressed the desire to remove the 40s blip, and they did. TOB does not begin to explain the difference ,
If the 70s graphic does not include arctic cooling, then it likely underestimated the drop in T from the 40s. The changes to global T are similar, just not as extreme as the NH graphics. The NH likely fluctuates more, because it has a great deal more land.
By “recent” I mean the last twenty years. Which clearly shows, even with adjustments, that global warming is not happening.
Tony, that was an excellent post. Thank you.
I have stated this before, but of all the global warming outright dishonesty, this info is at the heart of the nucleus of the propaganda which has me most, well
‘disillusioned’
At one time I had the understanding that scientists were all above reproach.
Now, we have to accept the fact that in all walks of life humans are just so ‘human’
Sometimes, I think we need more Spock’s or Data’s
Great post. The last two graphics make a very good point.
I’m curious who the skeptics are that were referenced?
Tony, your logic is impeccable:
“The 1975 NAS graph makes sense. The Arctic melting when it is warm, and freezing when it is cold.”
“But what about the current GISS graph? It shows the Arctic melting when it is cold, and freezing when it is warm.”
I predict the usual warmist morons will miss the obvious here.
You forgot to mention that the climate-gate emails talked about “eliminating the 1940’s blip.” So this is much more than just conjecture. It’s like reading Mein Kamph and then seeing the results!
Scott, don’t you worry: the clowns at NASA / GISS are well and truly rumbled by our host. He’s highlighted the bogus removal of the 40’s blip many times before. He knows, and funnily enough, so do they.
The National Academy of Sciences became part of the problem on 24 Oct 1945:
AGW is the fourth in a series of MAJOR LIES invented after nations (UN) and national academies of science (NAS) were united on 24 Oct 1945 into an Orwellian Ministry of Consensus Science Truths to forbid public knowledge of Neutron Repulsion – the major source of energy in cores of heavy atom, some planets, ordinary stars, galaxies and the universe:
1. SSM- standard solar model
2. SNM- standard nuclear model
3. BBC- Big Bang cosmology model
4. AGW- anthropologic global warming
My suggestion for society’s escape from this 70-year old matrix of deceit is a series of short papers for teachers of future generations:
https://dl.dropboxusercontent.com/u/10640850/Introduction.pdf
Your comments, corrections or criticisms would be appreciated.
The fraud being propagated will get people killed:
http://northwestpassage2015.blogspot.com/