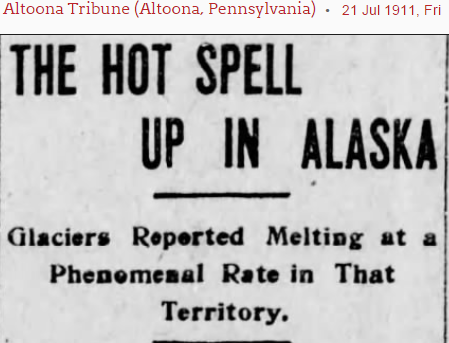
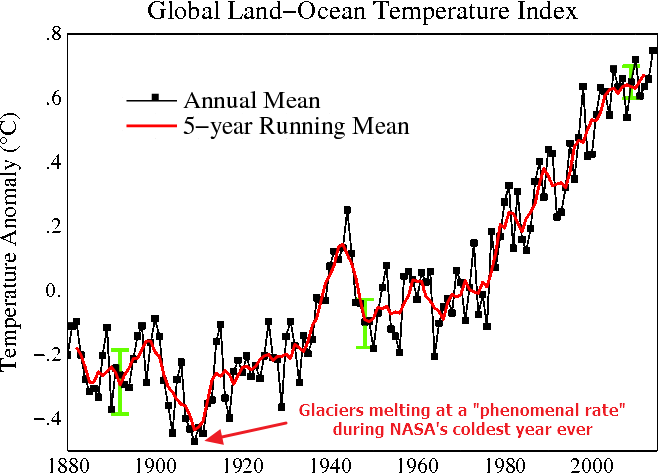
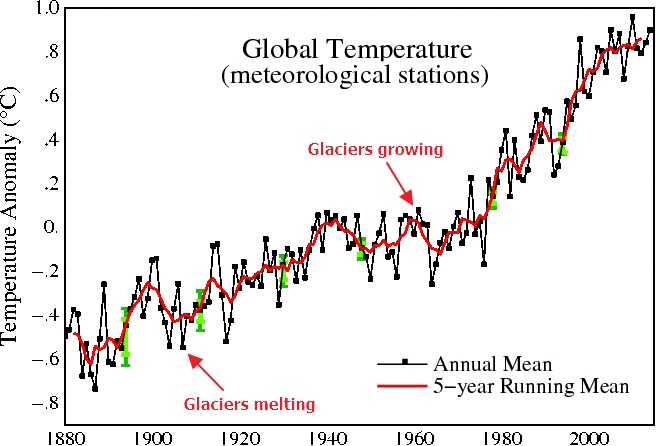
NASA says that 1911 was the coldest year on record, yet glaciers were melting at a phenomenal rate that year.
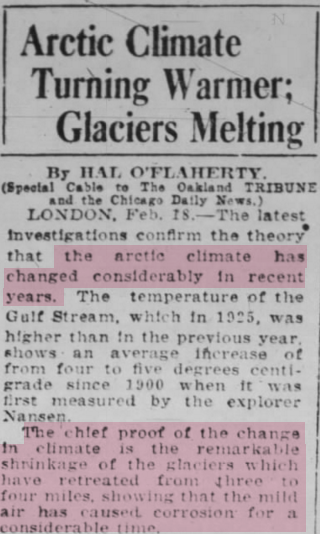
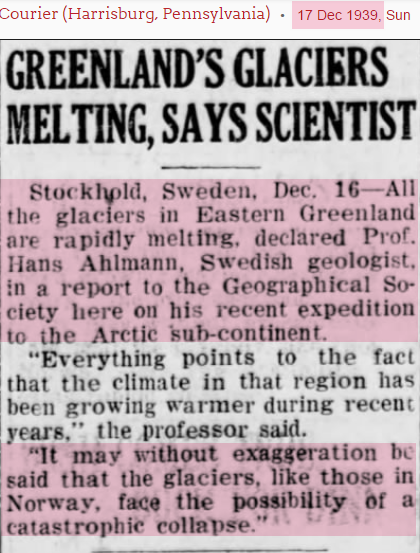
This rapid melt continued until 1940
1 Sep 1918, Page 9 – at Newspapers.com
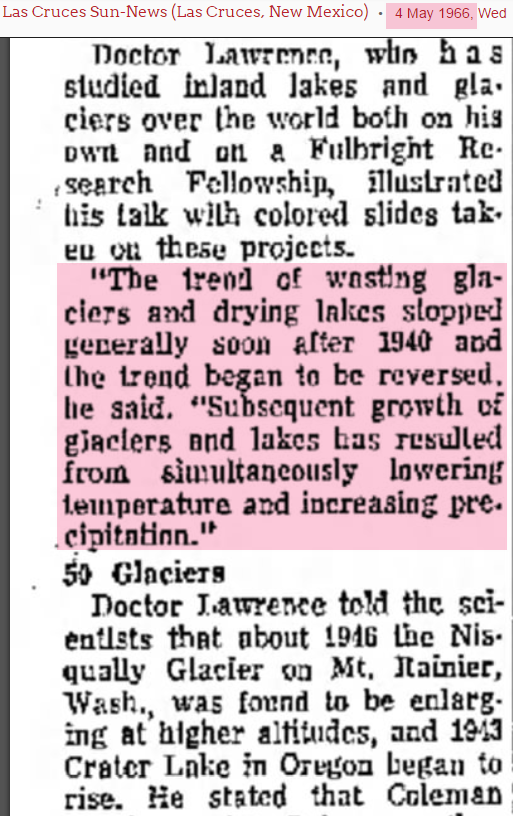
But after 1940, glaciers began to grow again
NASA shows glaciers melting when it was cold, and expanding when it was warm. Their graphs are untenable.
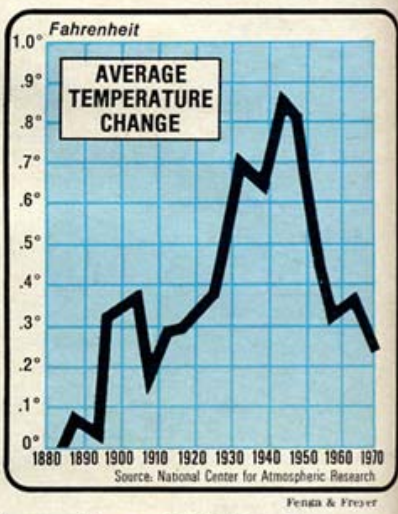
NASA has massively altered the surface temperature record over the last 40 years, when scientists knew that there was large scale cooling after 1940. NASA has completely erased this cooling – which glaciers showed unequivocally.
It is bad enough that NASA is wrong, but they keep tampering with the data to make their fraud even worse.
2005 version : Fig_A.pdf
Current version : Fig.A.gif (656×446)


We’ve had glaciers shrink during the early 1900’s, rebound from 1940-1980, shirk during the 1980’s and 1990’s, then rebound again in the 2000’s. None of it proves jack, except for the natural cycles and variablity of glaciieres. When we go from here is anybody’s guess.
Steven, the graphs are for global average temperature anomaly. The year you point to in each graph is 0.4C and 0.6C below the average for (I think) the period 1961 to 1990. That was 14C. So the global average temperature for the two years you point to was 13.6C and 13.4C. There is nothing contradictory about having melting glaciers in years when the global average temperature is 13.6C and 13.4C. The current global average temperature is about 0.8C above the average, so about 14.8C. And the glaciers are melting faster, aren’t they? And pretty much all of them?
You are a wildly irrational propagandist. Is someone paying you to write this bullshit?
Do you know that the Antarctic ice extent has been steadily above average (except for a few weeks this year) since 2011? Do you know that the Antarctic icecap corresponds to nearly 90% of the glaciers of the entire world?
Ummm…nope. not even close. Arctic, antarctic and Greenland ice are all about normal or above average. Did you not catch the hoo ha about IPCC announcing that the himalayan glaciers would disappear – when in fact they are also fine?
Settled science in action. Thanks for laugh!
The error bars kinda crown it.
Combining the last 2 postings.
https://stevengoddard.wordpress.com/2015/10/30/scientists-seeking-funding-recycle-the-same-stories-every-century/#comment-548360
NPS Visitor Brochure – http://www.nps.gov/glba/planyourvisit/upload/Complete%20brochure%20two%20sides.pdf Page 2.
Go to the detail map of current extent positions and note 1929, 1925, 1982, 1916 as the dates of some of the most melted back conditions. 1966 is further down.
https://stevengoddard.wordpress.com/2015/10/30/climochondriacs-have-blamed-every-hot-day-for-the-past-century-on-coal/#comment-548357
What a change we have seen.
Then – “Calculations made by Arrhenius and based on seemingly reliable facts tend to show…”
Now -“Global Climate Models based on constantly revised data project (not predict) ….”
Still Prof. Van Hise is completely wrong as the “revised historical temperature” graph now shows he was really freezing and near death in 1912.
Martin; returning to the Alaska glacier melt; is the global warming signal evident in that particular glacier?
Tony:
The founding fathers, if alive today, would be very proud of you.
They fought against tyranny.
You fight against tyranny.
God bless.
You are a national treasure.
Is the raw data still available, or has it been ‘disappeared’?
Available
Would then a graph of the raw data look like NASA’s 2005 plot or be colder? I ask because their 1930’s-40’s looks way too cold given anecdotal data from the period, like glacial melting and growing season starts and lengths. Would you do such a graph and add it to the mix?