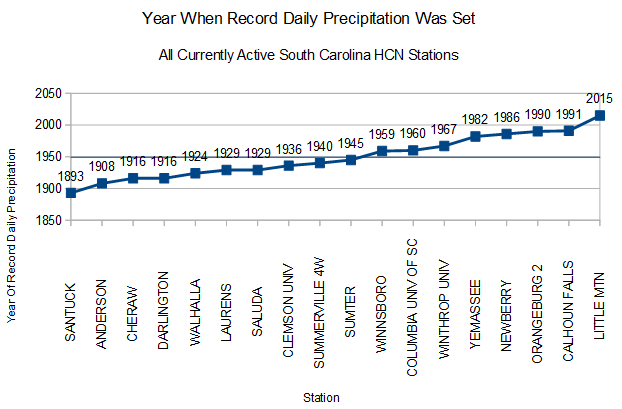
There are 18 currently active USHCN stations in South Carolina. Only one of them set their record daily precipitation during this year’s claimed 1,000 year rainfall. The average year for the precipitation records was 1950, and there is no indication that record rainfalls are more likely now than in the past.
As always, the claims of climate propagandists have no merit.


here’s the problem with rainfall
for example, UK rain
= if you look at the original dataset, any correlation looks like rubbish
http://s8.tinypic.com/o6h6bp_th.jpg
here is my interpretation of the data
http://i65.tinypic.com/2dbjiwy_th.jpg
I hope I get the bigger picture here
http://oi65.tinypic.com/2dbjiwy.jpg
it works a [pendulum] clock does it not?
….predictable
AKA Simple Harmonic Motion…
true.
I can tell with accuracy greater than 99% that total UK rainfall during 2015-2038 will be somewhere between 1078 and 1153 mm per annum – the pendulum has started his move swinging back but obviously time is moving forward.
The 1100 measured in the zero period , i.e. the HN cycle before 1927, is a bit higher than the expected 1060 but you can see that it is definitely off course from the swing up.
I suspect that as time progressed more weather stations were added giving us a slight inaccuracy when you look at the older figures, i.e. the figures for annual UK rainfall before 1927.
they all do if you look at the Hale Nicholson cycles
http://oi61.tinypic.com/2ng4lft.jpg
“1,000 year rainfall”
Given 1000 independent sites, you get 1/1000 event almost every time you look. Given several variables, you can choose which you claim important (draught, rain, flood, hot days, glacier melts…)