
Every time we get a big rain in the US, climate morons start claiming it was a 1,000 year event
So what are they doing wrong?
Your odds of winning the lottery are very small, but the odds of someone winning the lottery are quite high. What these geniuses are doing is conflating the odds of one individual station getting a 20 inch rain, with the odds of any station getting a 20 inch rain.
Big rains are not rare in the US. Alvin, Texas got 43 inches of rain in one day in 1979.
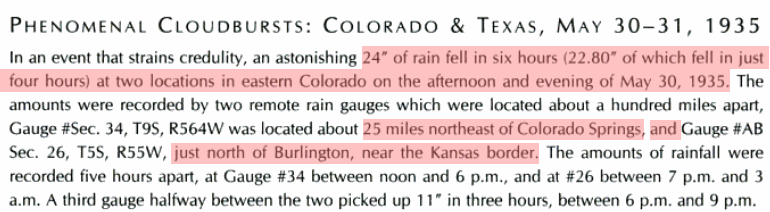
We heard exactly the same 1,000 year nonsense after the 20 inch rains of 2013 in Colorado, but Colorado got 24 inches of rain in six hours in 1935.
There are records of many other comparable rains in the US, but people make the same mistake generation after generation.
10 Jan 1871 – IMAGINARY CHANGES OF CLIMATE. (Pall Mall Gazette.)

Yep,
If a tornado blows down my house that is in all probability the most severe weather ever to occur at my particular house in thousands of years!
On the other hand, the USA’s weather (in terms of rain) was also influenced by the World War II. The winter of 1938/39 in the United States was abnormally wet particularly in the eastern United States and in the Southwest, with the larger part of the country having above–normal conditions. The spring of 1939 was exceptionally dry with only a few States from the Mississippi Valley eastward having somewhat more than normal rainfall. From the Great Plains westward, all States experienced deficient rainfall. The summer was relatively wet eastward of the Great Plains, except in the Northeast, where rainfall was deficient in almost all sections. The fall season was extremely dry over large areas, although amounts of precipitation were a little bit above normal in Utah, Colorado and Arizona. For all the areas eastward of the Rocky Mountains it was the driest fall on record. With regard to anthropogenic rain making due to military activities in Europe and Asia, and due to the fact that ‘aerosols’ from battle fields, for example in Poland during September 1939, could easily make their way to the USA, it should at least be mentioned here that in California precipitation in September 1939 was 370 % above normal (Alabama, 119%; Arizona, 335%; Nevada 327%; Utah 261%). However, in most States, September 1939 was unusual dry. Many details here: http://www.2030climate.com/a2005/02_32-Dateien/02_32.html#_ftn3.
Attribution of cause and effect is difficult. Going back inn history, there seem to be many examples of war and revolution during times of bad weather and climate shifts. Was the weather influenced by the wars? Or were the wars triggered by bad weather with its crop failures and various disasters?
The 1974 CIA report:
“A Study of Climatological Research as it Pertains to Intelligence Problems”
http://www.climatemonitor.it/wp-content/uploads/2009/12/1974.pdf
Holdren and the other Malthusians from Stanford University are not alone. The US government has been behind them since BEFORE the book Human Ecology: Problems and Solutions (1973) was published. The book just echoed the real thoughts of the US government of that time.
People do it all the time and such things get written into history. It is a matter of historical “fact” that the Storm in the English Channel that struck on June 19th which caused full gale force winds and waves which so damaged the fleets and the Mulberry artificial harbors along the Normandy landing beaches was the “worst June storm to hit the channel in 80 years” according to several authoritative histories. In reality, when someone really delved into the records it was found it was the worst June Gale to hit the Normandy coast in 40 years.
Typically a met station measures, rainfall, wind speed, temperature, humidity, pressure. There are at least two ways these can be extreme (max,min). There are nine months a year, and in the US 50ish states. So there are 6000 potential extreme events each year. If you then start taking combinations like “summer, winter”, “eastern states”, that goes up to perhaps 10,000. So, on average you should be getting around 100 “once in a century” extremes each year and some 10 “once in a millennium” events.
So, the real question is not why we get so many, but why we get so few.
Brilliant! And none of the CAGW cult members will understand why you are correct.
When Moscow had the severe heat waves a few years back, there were reports circulating that it was a “once in 15,000 year event!” Of course that totally refused to take into account the historical reports that showed similar events (and worse) occurring about twice a century or so. Once in 15,000 years? Do these people have any idea just how much variation we can have in weather events when you stretch the time line out to 15,000 years? For goodness sake, 15,000 years ago we had mile thick ice sheets where we now have orchards. And yet a severe heat wave (yes, it was a hot one!) is as rare as mile thick ice caps? So they tell us.
Governor said that this was a 1000 year rain event in the Low Country of South Carolina, no implications for anything nationally.
We continually see excuses for why temperature records from the past are inaccurate – not standard observations, recorded in the Sun etc.etc.- and hence require adjustments to bring them into line with today’s “best practice” !
Obviously this must apply to previous rainfall records as well – perhaps the idiots from the past must have been recording centimetres and not inches after all – adjust the hell out of ’em I say.
OH WOW!!!
“Somewhere” would be a carbon sink?
Of Course. He really tripped himself up on that one.
Gail: Anytime I come across a post by David Appell, I have to say he makes my day. I usually end up on the floor laughing. I have suggested several times to David that he should become a standup comedian and thereby enliven the lives of other people instead of posting rubbish on blogs such as this one.
David Appell, the gift that keeps on giving! Haven’t seen him on this site for quite some time. Has he been banished, or did he simply get tired of being a punching bag?
It’s a statistical measure, meaning a 1,000 year occurrence interval. It doesn’t mean once in a thousand years.
Everyone in history who has eaten carrots has eventually died. Carrots are deadly.
Life is lethal so we must ban life!
Yes. The very act of childbirth is lethal, given enough time. In fact, it usually kills BOTH parents! Some poor sufferers have been known to linger for six or eight decades before finally dying of the effects of childbirth.
And well before that they go crazy. Mental illness is genetic. You inherit it from your children.
Heavy rain continued in South Carolina Monday, adding to the already water-logged state’s woes. There have been at least nine weather-related deaths in two states due to the rainstorm.
Sunday was the wettest day in the history of South Carolina’s capital city Columbia, according to the National Weather Service. The rainfall total at the Columbia Metropolitan Airport was 6.87 inches, the most rain that’s ever fallen there in one day. One weather station near downtown recorded 17 inches in as many hours on Sunday..
No, do they ever check their own records?
7.30 inches fell on July 8, 1959
South Caroline gets rain. BOY, does it get rain! I lived there in the 1970s. You could pretty much set your watch by the 4:00 pm thunderstorm and it normally flooded down town Columbia. You either got out of work and home before the rains hit or sat and read a book until the rain was over if you had to drive through down town.
Lived in West Columbia in ’69-71. Know what you mean.
Thank you for the lesson in how to lie with statistics.
OT but climate alarmist morons will not know what to make of this.
http://www.abc.net.au/news/2015-10-06/microscopic-antarctic-food-source-predicted-to-double-in-size/6829060
If you double the bottom of the food pyramid, then more food is a good thing for every creature higher up on the pyramid. And mostly because the oceans have warmed slightly and more CO2 is available. In conjunction with the “Greening of the Planet” due to accelerated plant growth due to extra CO2 available, Earth is having a boom in land and sea plants.
Greenies think that extra green is a bad thing unless its green going into their bank account.
Steve, I put this on WUWT, but I think you’ll enjoy the Colorado perspective here.
So, to get a 1,000 year flood you fit a Gaussian to the observed data over your POR (period of record), and then go out on the wings for the probabilites over many more years. Sounds good in theory, and seems to work well for some things (like rolling dice). But here’s an anecdote using observations from my very own NWS co-op station.
I started obs. in 1982, and after 20 years figured I had enough points to draw that Gaussian curve. One thing of interest is heavy precipitation events, of course. There were several 4 to 5 inch events in those twenty years, and that Gaussian came up with a return interval for a 9-inch event as 6 million years. That would be ten such events since the dinos died.
The following year there was a 9-inch precip event (falling as 72 inches of snow!!!), and suddenly that 6-million year storm became a 21-year storm. Well, not really. Re-computing with one more year of data came out to once in 20,000 years.
Fast forward a dozen years: two years ago there was another 9-inch event. Re-calculating makes those 7,000 year events.
Then I found a guy up the hill who recorded a 12-inch rainfall event in 1969. If I put that into the calculation, a 9-incher becomes a 100-year event, and that 12-incher a 44,000-year storm (even if it happended only 46 years ago).
So that silly Gaussian still says an event that’s observed 3 times in 44 years is a once-in-a-century storm. Apparently there’s a population of extreme events that are disconnected from the normal well-behaved everyday storms.
Maybe rainstorms aren’t Gaussian. Ya think?
BTW, that 72-inch snow was the biggest in 33 years of record. The Gaussian says it’s a 330 year snow, and only had a 1 in 10 chance of falling on my shift.
Richard.. google… Log Pearson 3
I think we all need to understand the statistics behind these “ARI” (Average return intensity) events.
The problem is that we have a limited time period of rainfall data, so we have to try and use that data to estimate probabilities.
The issue comes from treating the data as a whole set, rather than a set with 2, maybe 3 different drivers.
A statistical trend process call Log Pearson III is used in Australia in ARR (Australian Rainfall and Runoff) I don’t know what is used in the US or elsewhere. On the east coast of Oz we have mostly modest rainfall events, but when the east coast lows hit, or the El Nino brings huge rainfall events like in Brisbane, they totally skew the data at the top end.
These large rainfall events are often quite localised and when rainfall is treated as a whole, they are way above the average event, and statistically are maybe 1:100 year or more events..
…but if you look at the rainfall data, you can see that they occur once every 30-40 years or so.
I have heard that the next iteration of ARR will try to take the “events” into account.
But it does illustrate that the statistical analysis of rainfall events, is really only in its infancy..
.
.
…..like most of the rest of climate science.
You CANNOT predict the size of 1:100 year events with only a hundred (or even 200) years of data. !!!
I am still very puzzled HOW the AGW farce ever got started, except as a political exercise…
….. the statistical evidence is so poor and so short term and flimsy that we CANNOT POSSIBLY make any predictions WHATSOEVER.
ps.. for the statisticians or budding mathematicians amongst you…. google “log pearson3”
Have fun. 😉
pps.. seems that the US does use LP3
http://streamflow.engr.oregonstate.edu/analysis/floodfreq/
Andy, thanks for that – I’m glad the USA doesn’t use Gaussians, since my point was weather is not Gaussian.
I went to that OSU website and while it looks like it can walk me through doing a LP3 analysis, the rationale behind it is clear as mud left over from a 1000 year event. When it got to “look it up in a frequency factor table” and your “regional skewness, is determined from a map”, I know there is some voodoo – i.e., engineering – involved here. Like much of engineering, it’s much better than relying on pure physicial theory (good luck designing an airplane from scratch, using Maxwell’s and Newton’s equations). But I’m curious how an LP3 distribution differs from, and is better than, a Gaussian..
“
This is the same lack of understanding about odds that occurs daily with the NWS forecast of probability of precipitation. If “my” forecast is a 90% chance of rain and it doesn’t, “obviously” the weatherman screwed up again. Same reaction when it pours with a 10% precip forecast.
Whom kept weather records 1000 years ago?…