
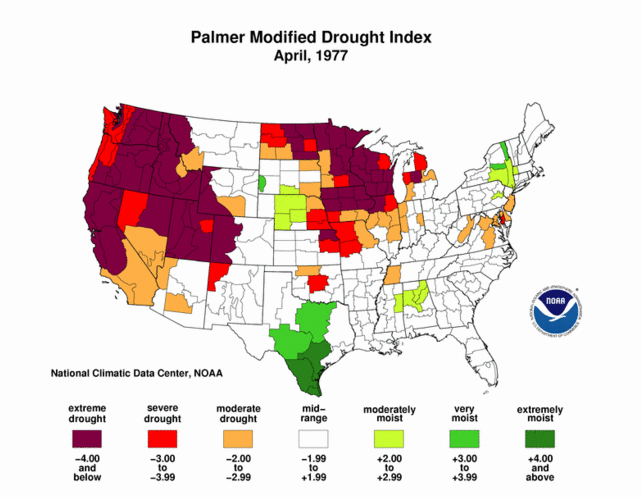
In 1977, an “errant jet stream” brought epic snow and cold to the east, while California and Alaska were warm and dry.
The Lewiston Journal – Google News Archive Search
Governor Jerry Brown warned of drought disaster.
Brown Warns of Drought Disaster – Says Hard Choices’ Face California – Article – NYTimes.com
National Geographic blamed global cooling for the wild weather.
But then the rains came, and California and Arizona flooded.
By 1980, the rain had turned into a 500 year flood which washed out all but one of the bridges over the Salt River in Phoenix. It took me hours to commute from Scottsdale to Tempe.
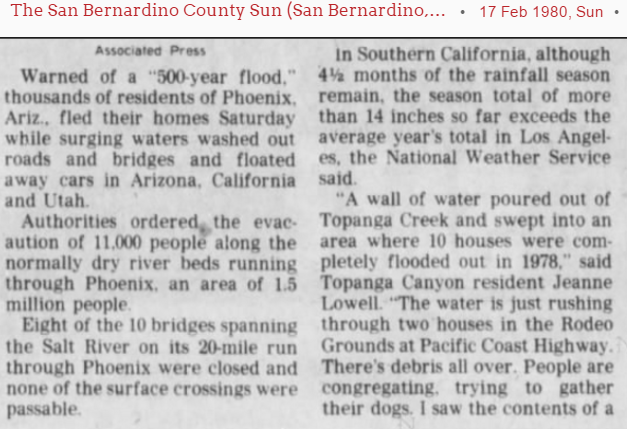 17 Feb 1980, Page 3 – at Newspapers.com
I remember skiing at Flagstaff, Arizona with the snow more than ten feet deep in 1980.
Fast forward to 2015. The identical weather pattern occurred, only this time experts blamed global warming instead of global cooling – and Governor Jerry Brown was again hysterical about the drought.
California and Arizona are about to get slammed with epic rain and snow.
Experts will of course blame the rain and snow on global warming, because that is where the money lies this time around.

Excellent presentation of stories I remember well.
The Russians have had an index for jet stream loopiness called the ACI for arctic circulation index for decades. http://www.fao.org/docrep/005/y2787e/y2787e03c.htm#FiguraC
Produced by: Fisheries and Aquaculture Department FAO
http://www.fao.org/docrep/005/y2787e/y2787e0Y.gif
Shifting the Arctic Circulation Index right by four years.
http://www.fao.org/docrep/005/y2787e/y2787e0Z.gif
Arctic Oscillation (AO)
The Arctic Oscillation (AO) is a climate index of the state of the atmospheric circulation over the Arctic. It consists of a positive phase, featuring below average geopotential heights , which are also referred to as negative geopotential height anomalies , and a negative phase in which the opposite is true. In the negative phase, the polar low pressure system (also known as the polar vortex) over the Arctic is weaker, which results in weaker upper level winds (the westerlies). The result of the weaker westerlies is that cold, Arctic air is able to push farther south into the U.S., while the storm track also remains farther south. The opposite is true when the AO is positive: the polar circulation is stronger which forces cold air and storms to remain farther north. The Arctic Oscillation often shares phase with the North Atlantic Oscillation (NAO) (discussed below), and its phases directly correlate with the phases of the NAO concerning implications on weather across the U.S.
….Favorable positioning of the geopotential height anomalies within the negative phase of the NAO appears to enhance snowfall potential in the eastern U.S. When negative NAO anomalies are positioned such that an area of high pressure is located near Greenland and a polar vortex (area of low pressure) is somewhere near 50°N 50°W, we find an increased potential for winter weather along the U.S. east coast.
Positive Arctic Oscillation
“A stronger Icelandic low and Azores high translates into lower than average 500mb heights near Iceland, and above average heights near the Azores Islands. In turn, above normal temperatures are seen over the eastern U.S. as the stronger westerlies transport colder air away from North America.”
https://climate.ncsu.edu/images/climate/enso/NAO_POSITIVE_1972.gif
Negative Arctic Oscillation
“When the Icelandic low and Azores high are weaker, above average 500mb heights are located near Iceland, and below average heights near the Azores Islands. This results in a phenomenon referred to as high latitude blocking, which allows cold air to drain from Alaska and Canada into the U.S. and become entrenched, resulting in cold air outbreaks and below normal temperatures.”
https://climate.ncsu.edu/images/climate/enso/January_1966_500_Negative.gif
Positional Effects
“Favorable positioning of the geopotential height anomalies within the negative phase of the NAO appears to enhance snowfall potential in the eastern U.S. When negative NAO anomalies are positioned such that an area of high pressure is located near Greenland and a polar vortex (area of low pressure) is somewhere near 50°N 50°W, we find an increased potential for winter weather along the U.S. east coast.”
https://climate.ncsu.edu/images/climate/enso/Positional_NAO.png
So the ice age scare was caused by global warming, and 2+2=5. I can’t wait to hear who won the 1934 World series this year!
I can’t wait to hear the spin from the Larry/Marty/Cfool trolls.
http://frozen-juegos.com/img/puzzles/2pag/Trolls_from_Frozen.jpg
Gail, Steve, anyone please see my question back at Wise King—–
The info is HERE:
https://stevengoddard.wordpress.com/2015/12/30/wednesday-will-see-the-usual-bs-from-climate-alarmists/
https://stevengoddard.wordpress.com/2015/12/31/just-in-the-nick-of-time/
https://stevengoddard.wordpress.com/2015/12/31/arctic-meltdown-update-2/
And
https://stevengoddard.wordpress.com/2015/12/31/1964-global-cooling-arctic-spike-was-larger-than-2015/
There were actually two different stories. One was a guy confused North Pole Alaska with the actual North Pole. The other was a very short (one hour) warming event at one buoy. This is not uncommon.
All the data is in those links (with graphs.)
We already know. The climate revisionists tell us the Tigers actually won.
Well, there IS precedent for that. The current world record high temperature was set in 2012, when the 1922 Libyan temperature of 136 was surpassed by the 1913 Death Valley temperature of 134.
It all makes sense, when you think about it. Modern methods for reading thermometers 100 years ago are much better than the methods they had back then. Why wouldn’t the same apply to baseball? I’m sure similar advancements have been made in our ability to count how many men ran around a diamond 80 years ago. I look forward to this year’s revision of that score. And next year’s revision will be even more correct.
I’m hoping they’ll revise last year’s Super Bowl score, proving that Seattle really won. Maybe then I can get Vinnie the Hammer to revise my kneecaps to “unbroken”.
Reblogged this on WeatherAction News.
This blast of snow will certainly help a lot but I doubt it will be a total drought buster for CA come spring even with the already heavier than normal snow packs in lots of places. Not quite enough in the mountains even if the forecasts are correct. It sure would have helped if Brown had not cancelled construction of several new reservoirs back then. But of course we will have to wait and see how much more precipitation is yet to come.
California always seems to be in drought with wild fires or too wet with mud slides and in between they get their earthquakes. It is a never ending cycle of disasters in one place or another out there it seems. But even if the floods come like back in the 70’s I doubt the underground sources will be recharged to the extent needed over the long run. It will still eventually come down to desalinate of depopulate.
Agreed. Most of the West is using ‘fossil water’
Yes, that is how desert areas work.
An intense long duration AR would help recharge the massively overdrawn ground water sources. The cost would be very steep in lives and $$, though. (Note: link in movie is dead. Link to USGS in description is still good.)
https://www.youtube.com/watch?v=8P-N-HA9iS8
The Sierra snow pack is running about average so far, but Southern California rainfall is still almost zero. As of yesterday, Santa Barbara is at 15% of normal for the season, and the county as a whole is at 40%. We’re not on the aqueduct, so Sierra snow doesn’t help us a bit here. Only rain. The forecast is for 1-2″ this week, which won’t even bring us to half of normal. And every storm so far this year has come in FAR short of the forecast. No, I don’t think our drought will be ending this year, either.
I am waiting for some CAGW enthusiast to comment:
“Well, sure, they claimed that loopy jet streams were caused by cold weather — but that was back in the 70s! We didn’t understand climate then, but now we do! Now we know that loopy jet streams are caused by too much warmth. You can’t deny climate science by turning up anecdotal evidence from decades ago.”
Nice obfuscation — but it totally ignores the fact that we really did get loopy jet streams back when it was really cold.
Loopy jet streams from when it was REALLY REALLY COLD!
https://stevengoddard.files.wordpress.com/2014/01/screenhunter_256-jan-22-16-42.gif
https://stevengoddard.files.wordpress.com/2014/01/shockingpolarvortexfrom20000yearsagovs20140122v001.png
Hey Gail! As you have pointed out before, those loopy jet streams do remind one of the boundaries of the Laurentide Ice Sheet. My (very simply stated) speculations are as follows.
The jet stream marks the effective boundary between temperate air masses and the colder air masses to the north. When the air north of the jet stream cools enough, the increased barometric pressure distorts the jet stream into a southerly loop. As the cold northern air moves south, the overall barometric pressure drops up north, sucking in a loop of warmer southern air mass at some other point along the jet stream — thus we get the loopy meridional flow. This is not stable however, because the cold mass that has moved south is warming rapidly as it soaks up heat from lower latitudes. Fairly quickly, the flow returns to a more zonal flow. But what would happen if the interior region of North America had already chilled down below the point where it was able to sufficiently warm that loop of cold air that had moved south? At that point, the meridional flow might become a permanent fixture, with ice and snow building up until you have a stable southern loop and a two mile thick ice sheet.
That shows a pretty simple way to get a system that two stable states — a warm state with most of the planet habitable and the northern cold air confined to the present arctic, and a colder state where the arctic air is free to move south over an already chilled interior of North America. Either state is stable — so how and why does it switch? My guess would be that it is not a one or two factor question; there are probably many factors involved and every so often we get a combination of solar output, cloudiness, orbital eccentricity, and even (maybe!) atmospheric composition, a combination that is the exact opposite of winning the slot machine. All lemons! We win an ice age!
You are right though about that correspondence between the “polar vortex loops and the ice sheet. Not sure how that works out for the Southern Hemisphere, but it looks scary for those of us in North America.
Sounds like an interesting conjecture (not yet hypothesis) Generally you see the Meridional flow in the winter but sometimes in the summer. Remember the Russian Blocking High?
On another note. (year old) Russia is kicking NASA out of the International Space Station in 2020
Looks like we had better vote for Trump! (The Ukraine situation is more the fault of EU/USA interference)
http://motls.blogspot.com/2014/07/brainwashed-sheeps-obsession-with.html
http://motls.blogspot.com/2014/08/comparing-obamas-putins-10-minute.html
If they could just go back and adjust those publications…
They try, They really really try. Or they say it was just a ‘few’ outliers.
“Nice obfuscation — but it totally ignores the fact that we really did get loopy jet streams back when it was really cold.”
We know now that it really wasn’t cold back then. More recent measurements of the 70’s show that they were much warmer than we thought. The 1976 winter Olympics have been retroactively cancelled, due to the 70 degree temperatures in Innsbruck that winter.
It happening more and more often these days, thanks to Arctic warming. Welcome to the new normal!
What is “happening more and more often these days”? And provide your evidence for your contention, what ever it is your referring to.
RAH, the bunching up of the jet stream is happening more often. It is happening every year now. I suppose you will demand that I do your research for you, but you will have to do it yourself.
Martin, what is the difference between MERIDONAL and ZONAL flow?
I don’t know, tommy. I suggest you enter those two terms in the google search box and see what you get. google is your friend.
Martin, doesn’t know the difference between MERIDONAL and ZONAL flow?
And he is trying to school us on what causes them??
http://4.bp.blogspot.com/-v4833RhLE_E/Tw22kabjfSI/AAAAAAAACSE/BuGRpVFctFQ/s1600/ROTFLMAO%255B1%255D.jpg
Marty was especially funny when he attempted to school Ted on Milankovitch Cycles. Another real keeper!
Marty is obviously on somebody’s payoll. Why else would he continuously make an utter fool of himself, and show himself to be a liar, on a daily basis? Well OK, there is the possibility of mental illness.
How can it happen “more and more”….when it’s just happening, that’s all?
If it happens when the arctic is cold…and it happens when the arctic is warm
…then temperature has nothing to do with it
Lat, you aren’t making sense. The cause is major reduction in the temperature difference between the Arctic air and the air down where you are. This reduction causes the jet stream to slow down and bunch up. The coils become stable. The cause has not changed, but our understanding of it has increased quite a lot. Don’t be left behind.
Like it’s never happened before?
Why did it happen before global warming then?
The cause is major reduction in the temperature difference between the Arctic air and the air down where you are.
So, that means it’s possible that the cause of the temperature difference is that it is cooler in the lower latitudes, which would decrease the temperature differential between the Arctic and lower latitudes, allowing the jet stream to slow down and bunch up.
It doesn’t have to be the Arctic that is warming to cause the temperature differential, somewhere else could be cooling. That seems to fit what Tony has been telling us for some time, if you remove the adjustments to the data, temperature at these lower latitudes are cooling, not warming, which is reducing the temperature difference between the Arctic and lower latitudes.
Lat, I explained that. No one but you said it never happened before. It used to happen once in a while. Now it is happening much more often, every year it seems, more than once. Why did it happen before global warming? The reason was the same then as it is now: A reduction in the temperature difference between the Arctic air mass and the air mass at the lower latitudes. This causes the jet stream to slow down, and when it slows down, it bunches up. The “bunches” become stable. That’s what caused the record warmth in the eastern US this past month.
Quite right, pin, that alternative is a possibility. But we know the Arctic is warming at nearly twice the rate of the rest of the planet, so it is much more likely that a warming Arctic is the cause. I posted a link to a map elsewhere in this thread that shows this.
The cause is major reduction in the temperature difference between the Arctic air and the air down where you are.
====
Well no…..you guys will have to guess again because that doesn’t hold up to history..or the sniff test
Florida freezes are a result of the jet stream dip…and nothing else
It’s easy to just look at the record of Florida freezes…
Coldest Florida freeze was 1835…..that means it was the strongest dip in the jet stream…when it was barely past the LIA…
http://flcitrusmutual.com/render.aspx?p=/industry-issues/weather/freeze_timeline.aspx
..and then there’s what is known as the “great freeze” which was back to back jet stream dips two years in a row…..in 1894 and 1895….that set the all time record low for the state
Only about 40 years after the so called end of the little ice age…..
You are still ignoring the explanation, Lat, willfully it seems. The jet stream has always slowed at times. The difference between then and now is: Now it happens every year.
Martin, it has not happened every year…stop exaggerating
Look at the history of Florida freezes….nothing has changed
Now it happens every year…
==
and it’s always happened every year….we used to call it winter
They just moved the goal posts….
A real dip is not into north Georgia..that’s normal…A real dip is into south central Florida or lower
While the jet stream ALWAYS has both meridional(what you so unscientifically call “bunching up”, and “coils”), and Zonal flow components, your claim as to the cause is off the mark by 180 degrees. One well understood cause for the greater amplitude of the Rossby wave is in fact a greater temperature difference between the Arctic, and the Tropical latitudes. During Meridional flow periods(which is more typical of Hemispherical Winter btw) the temp. difference between the Winter pole and the Tropics is enhanced, and cold frontal outbreaks are typically driven by the polar jet. Of course the backside of the jet necessarily ends up bringing warmer air northward in a rush to fill the pressure vacuum created by the polar outbreak. Seeing as the Troposphere is thinner at the poles, any gathered warmth from Southern latitudes is more quickly shed to space[Cooling]. This is evident by looking at the jet stream plots., In the N. Hemi. Winter the loopiness is in the North, while in the N. Hemi. Summer loopiness is in the South Polar jet. Again, less temperature disparity exhibits a more Zonal flow pattern which is evident in the jet stream plots of Hemispherical Summers, far less loopiness is seen.
“You are still ignoring the explanation, ”
That’s because he has shown that your explanation is ERRONEOUS… as usual.
We are getting VERY used to ignoring your continuous errors, little goreboy.
Right on schedule….
So WHAT ARCTIC WARMING?
1958
http://ocean.dmi.dk/arctic/plots/meanTarchive/meanT_1958.png
1978
http://ocean.dmi.dk/arctic/plots/meanTarchive/meanT_1978.png
1988
http://ocean.dmi.dk/arctic/plots/meanTarchive/meanT_1988.png
1998
http://ocean.dmi.dk/arctic/plots/meanTarchive/meanT_1998.png
Notice the SUMMER temps are average in the above sample.
2013 SUMMER temp below average
http://ocean.dmi.dk/arctic/plots/meanTarchive/meanT_2013.png
2014 SUMMER temp below average
http://ocean.dmi.dk/arctic/plots/meanTarchive/meanT_2014.png
2015 SUMMER temp below average
http://ocean.dmi.dk/arctic/plots/meanTarchive/meanT_2015.png
Meanwhile in the Southern Hemisphere where additional sea Ice reflects five times as much solar energy because it is much closer to the equator…
“Sea ice extended over 19.44 million square kilometers (7.51 million square miles) in 2012, according to the National Snow and Ice Data Center (NSIDC). The previous record of 19.39 million kilometers (7.49 million square miles) was set in 2006.”
“In late September 2013, the ice surrounding Antarctica reached its annual winter maximum and set a new record.”
“Sea ice surrounding Antarctica reached a new record high extent this year, covering more of the southern oceans than it has since scientists began a long-term satellite record to map sea ice extent in the late 1970s. On Sept. 19, 2014, the five-day average of Antarctic sea ice extent exceeded 20 million square kilometers for the first time since 1979, according to the National Snow and Ice Data Center.” — NASA
http://eoimages.gsfc.nasa.gov/images/imagerecords/82000/82160/spseaicemax_extent_chart_2013.jpg
Gail, by asking “WHAT ARCTIC WARMING?” you are being extremely silly.
Those graphs are of the air temperature in the Arctic.
So yes WHAT WARMING and the graphs are entirely relevant considering the Arctic, according to the ClimAstrologists, is supposed to warm faster than any where else and yet it did not.
Since it has shown no real warming in air temperature in the summer since 1958 and the last three summers (2013, 2014, 2015) have actually been cooler it kills your claim that the world is warming. It also kills your claim that the Arctic is warmer and the temp differential is smaller and that causes ‘loopy jets’
You are again demonstrating you can not follow even a simple bit of logic. My “WHAT WARMING was in answer to
>Those graphs are of the air temperature in the Arctic.
Yes, Gail, but they shed no light on the subject we are discussing, because there is nothing to compare them to. That’s usually true of the raft of diagrams you post. They just don’t mean anything relevant to the discussion. Here is the map that shows that the Arctic is in fact warming faster than the lower latitudes. The map on the right: http://www.arctic.noaa.gov/detect/global-temps.shtml
“Yes, Gail, but they shed no light on the subject we are discussing, because there is nothing to compare them to.”
What the heck do you think I put up the 1958 GRAPH from 57 years ago if not for comparision? Are you really that completely stupid?
Gail, comparing two one-year graphs is absolutely meaningless when we are talking about the trend. I posted a link to a map that shows the warming over decades. That’s how you show a trend. Comparing an old year with a new year, is silly. It doesn’t show anything except the difference between those two years. I’m not surprised you tried that, though, since you all used the same misrepresentation method to claim there has been no warming since 1997.
But Marty, everybody knows that there has been NO WARMING since 1997.. its in all the climate literature. But just ignore the consensus.. its what you do.
The ARCTIC IS COOLING
https://i0.wp.com/s19.postimg.org/i7k87yl9v/UAH_No_Pol.jpg
“Yes, Gail, but they shed no light on the subject we are discussing, because there is nothing to compare them to.”
Note that the green line in each of those graphs remains constant. It represents the average temperature on each day. SHE’S COMPARING THE TEMPERATURES TO THE AVERAGE. It’s truly awe inspiring how incapable you are of following an argument.
Thanks Ted, I thought the green line representing the average in those graphs was so blindingly obvious it did not need comment.
Don’t they teach ANYTHING useful in schools any more?
Your graphs always look impressive, Gail, but they always seem to be irrelevant.
Everyone else can understand the relevance it is just you who does not have the background.
Well, ok, Gail, if by “relevance” you mean “obfuscation.”
marty RSS shows the Arctic has been cooling since 2007!
Marty says “Well, ok, Gail, if by “relevance” you mean “obfuscation.”
>>>>>>>>>>>>>>>
What Marty really means is “everything you post is way way over my paygrade so I can’t understand it” as is evidence by his inability to define zonal and meridional for Sunsettommy.
Poor little goreboy doesn’t understand.
Gee Marty, don’t go blaming others for YOUR incompetence.
http://s19.postimg.org/i7k87yl9v/UAH_No_Pol.jpg
Marty, the Arctic is COOLING, not warming
And if we go back a bit further, we see the step in 2010, but apart from that.. COOLING
http://s19.postimg.org/sm42pougj/No_Pol2.jpg
So all your little attempts to blame Arctic warming are again shown to be a based purely on your base-level ignorance.
Steven, once again, you have deliberately misrepresented history. No, the cause of the jet stream waves has not changed. It is the same now as it always was. The waves form when the jet stream slows down. The jet stream slows down (mainly) because the temperature difference between the Arctic air and the air at the lower latitudes decreases.
Yes, this phenomenon is not new. What is new, Steven, is that it happens pretty much every year now. It used to only happen once in a while. Now it happens all the time. The reason for the increase in frequency of this phenomenon is AGW, which is having a more or less chronic effect that reduces the temperature difference between the Arctic air and the air at the lower latitudes.
Sorry, but your attempt fails again.
What is new, Steven, is that it happens pretty much every year now. It used to only happen once in a while
=====
Martin, that is so easy to dis-prove….it’s embarrassing
Key West Florida is a little rock sitting out in thousands of miles of water…in the Gulf Stream.
The Gulf Stream does not get below 75F, and dictates the temp of Key West.
The only thing that will make Key West temps go below that is a dip in the jet stream, strong enough to reach Key West.
All you have to do is look at the winter temp history of Key West to see every time the jet stream dip was strong enough to reach Key West…..
Every dip below 70F was the jet stream….since 1980,the dips have become less frequent and weaker……..Which is the total opposite of what you believe
http://sofia.usgs.gov/publications/ofr/2006-1026/images/fig2agraphx.gif
BTW…..the slight increase in winter temps for Key West is not because of global warming
..it’s because the jet stream dips have become less frequent and weaker
If you look at the winter high temps…which might indicate global warming if they were increasing….the winter high temps have decreased
Poor goreboy, again refuses to accept history.
It is not happening more often, and its nothing to do with AGW…
because AGW ISN’T HAPPENING… no warming for 18+ years.
“you have deliberately misrepresented history”
No he presents history.. You just want to ignore it.. as usual.
It so hurts the AGW scam.
As shown above, the Arctic is cooling..
https://i0.wp.com/s19.postimg.org/i7k87yl9v/UAH_No_Pol.jpg
so you little attempt to misrepresent the actual reality and ignore historic reality…
.. has again FAILED against REAL DATA. as it always does.
Gail is spewing graphs to misrepresent the truth again. The Arctic air temperature is in fact warming at about twice the rate of the rest of the world. See the map on the right: http://www.arctic.noaa.gov/detect/global-temps.shtml
Yea, Yea , Yea, whatever. Have a nice day.
And YOU are lying again. NOAA tossed the far north stations remember? That is why I use the Danish data. They are not going to lie since it is their butts that are going to be frozen off.
From over 600 individual temperature series and more than 540 combined series with records of more than 20 years, the thermometer record in Canada peaked in approx. 1975
https://diggingintheclay.files.wordpress.com/2010/04/canadastations1975.png
By 2009 there are less than 30 locations reporting temperature that are used by the Global Historical Climate Network (GHCN) prepared by the U.S. National Climate Data Center (NCDC); this data is also used as the input to NASA’s GIStemp program.
You can see the locations of the stations on the map (below) and the most obvious ‘hole’ is the lack of stations above latitude 60N. (Black Triangles are all that are left.)
https://diggingintheclay.files.wordpress.com/2010/04/canada-bypopulation.png
And used that as a way to increase the temperature when Mother Nature didn’t cooperate.
https://diggingintheclay.files.wordpress.com/2010/04/canadadt.png
Here is the areas sampled in 2009 by (uses a 250 km ‘smoothing’ the smallest option. )
https://chiefio.files.wordpress.com/2010/01/ghcn_giss_250kmnov_anom11_2009_2009_1881_1990.gif
NOAA then smears the data
https://chiefio.files.wordpress.com/2010/01/ghcn_giss_1200km_anom11_2009_2009_1951_1980.gif
Nobody is lying, Gail. Not ev en you. You are just posting gibber, as usual.
Well NOAA sure is lying look at all the stations on the far north islands that NOAA no longer uses. (No dark triangle around the green dots) NOAA instead INFILLS the data aka they GUESS the temperatures in the Arctic. Even the Russians complained that NOAA tossed their station data too.
I can not link the Russian papers anymore since WordPress censors those sites.
DMI data shows that most of the mythical Arctic warming in NOAA is a FRAUDULENT LIE.
Marty is showing again that he cannot accept REAL DATA, only fraudulent fabrication.
The Arctic is cooling , not warming
https://i0.wp.com/s19.postimg.org/i7k87yl9v/UAH_No_Pol.jpg
I’d say Marty, that your brain tumour is growing at twice the rate…seek medical attention before it is too late.
Its now baseball size, a magnitude bigger than his actual brain.
…. and has taken over most of his cognitive functions.
Jet streams loop in the troughs between colder air and warmer air masses. During winter in the NH there is a greater contrast between polar air and the warmer air in the tropics making the winter jet streams generally much stronger than those we have in the summer. In short it is the contrast between the colder air and warmer air masses that drives the direction and intensity of the jet streams. Not the lack of contrast.
Again Marty shows he has done ZERO research to back up his blathering.
The reason the jet stream changes from zonal to meridional (loopy)
?UV(1)(2) ===> ?Ozone (3) ===> ?Stratospheric Temperature(4) ===> ?tropopause height(4) + ? wind strength of jets(5) and motion**(6) + ?strength of the stratospheric vortex (7)(8) + ?Ozone hole (9)
(? = Changes in)
(**Blocking phenomenon is part of Loopy jets)
REFERENCES:
(1) NASA 2007 before the deep solar minimum.: ” In recent years, SIM has collected data that suggest the sun’s brightness may vary in entirely unexpected ways… “We have never had a reason until now to believe that parts of the spectrum may vary out of phase with the solar cycle, but now we have started to model that possibility because of the SIM results,” …
“Between 2004 and 2007, the Solar Irradiance Monitor (blue line) measured a decrease in ultraviolet radiation (less than 400 nanometers) that was a factor of four to six larger than expected.” (wwwDOT)nasa.gov/topics/solarsystem/features/solarcycle-sorce.html
(2)NASA 2009 “…A 12-year low in solar “irradiance”: Careful measurements by several NASA spacecraft show that the sun’s brightness has dropped by 0.02% at visible wavelengths and 6% at extreme UV wavelengths since the solar minimum of 1996….” science(DOT)nasa.gov/science-news/science-at-nasa/2009/01apr_deepsolarminimum/
(3)Solar Spectral Irradiance Data
(4)Changes in Ozone and Stratospheric Temperature
http://www.giss.nasa.gov/research/features/200402_tango/ozone_temperature_graph.gif
(5)CHARACTERISTICS OF THE GENERAL CIRCULATION OF THE ATMOSPHERE AND THE GLOBAL DISTRIBUTION OF TOTAL OZONE AS DETERMINED BY THE NIMBUS III SATELLITE INFRARED INTERFEROMETER SPECTROMETER
(6)Top-Down Solar Modulation of Climate: evidence for centennial-scale change
(7a)The NAO Troposphere–Stratosphere Connection “Using monthly mean data, daily data, and theoretical arguments, relationships between surface pressure variations associated with the North Atlantic Oscillation (NAO), tropopause height, and the strength of the stratospheric vortex are established.”
(8)Quasi-biennial oscillation and solar cycle influences on winter Arctic total ozone
(9)Climate System Response to Stratospheric Ozone Depletion and Recovery
>Again Marty shows he has done ZERO research to back up his blathering.
Gail, I always have science to support my claims.
1. The Arctic is warming twice as fast as the global average:
Recent Arctic amplification and extreme mid-latitude weather
http://www.nature.com/ngeo/journal/v7/n9/full/ngeo2234.html
2. Global warm in g is causing the jet stream to slow:
Evidence linking Arctic amplification to extreme weather in mid-latitudes
http://onlinelibrary.wiley.com/doi/10.1029/2012GL051000/abstract
Martin, your theory seems to be that the warming arctic causes the jet stream to slow and dip?….am I right?? not sure
If that’s so, it does not explain why the jet stream dipped exactly the same in the past.
Florida freezes are only caused by dips in the jet stream….it’s easy to qualify that by just looking at the history of Florida freezes…before global warming, at the end of the LIA..before Arctic warming
Recent Arctic amplification and extreme mid-latitude weather
“The Arctic region has warmed more than twice as fast as the global average — a phenomenon known as Arctic amplification. “
Seems they forgot about the positive NAO which AndyG has been trying to bring to your attention. They also start at the bottom of the last cycle as Steven Goddard has been at pains to point out. In other words it is a SWAG.
“..because of incomplete knowledge of how high-latitude climate change influences these phenomena, combined with sparse and short data records, and imperfect models, large uncertainties regarding the magnitude of such an influence remain…”
And then comes — “we need more money” —-
>>>>>>>>>>>>>>>>>>>>>>>>
Evidence linking Arctic amplification to extreme weather in mid-latitudes
“….These effects are particularly evident in autumn and winter consistent with sea-ice loss, but are also apparent in summer, possibly related to earlier snow melt on high-latitude land.”
Too bad they did not do their research. I see a recovery in the snow cover since the 1990s
Northern Hemisphere snow cover
Febuary
http://www.ncdc.noaa.gov/sotc/service/global/snowcover-namgnld/201402.gif
March
http://www.ncdc.noaa.gov/sotc/service/global/snowcover-namgnld/201403.gif
April
http://www.ncdc.noaa.gov/sotc/service/global/snowcover-namgnld/201404.gif
The newer 15% DMI Arctic sea ice coastlines not masked
http://ocean.dmi.dk/arctic/plots/icecover/icecover_current_new.png
Sea ice extent in recent years for the northern hemisphere.
The grey shaded area corresponds to the climate mean plus/minus 1 standard deviation.
Sure looks like the spring ice for March April, May is near or within 1 standard deviation of the mean for 1979 to 2000.
(About 68 percent of the data values are within plus/minus one standard deviation of the mean.)
I hate the way people play on those ice charts….making a big deal out of the extremes highs and lows….
That’s the most delicate stage and can be affected by wind, burps…..butterflys
We should just look at Jun-Dec….that’s the only real indicator
marty do you even read the abstracts from your links? 1) “The possibility of a link” ,” reveal three potential dynamical pathways linking Arctic amplification” “We conclude that improved process understanding, sustained and additional Arctic observations, and better coordinated modelling studies will be needed to advance our understanding”
conclusion we’ve burned through our grant money and need more!
2)”National Centers for Environmental Prediction Reanalysis are analyzed” equals more computer modeling, ” possibly related to earlier snow melt” equals not really sure but possibly! “which may lead to an increased probability” WooooHooooo! That is definitive!
computer reanalysis of previous computer modeling MAY or POSSIBLY increase our future grant funding efforts.
What is sad is you actually believe this BS
The Arctic is COOLING , not warming
https://i0.wp.com/s19.postimg.org/i7k87yl9v/UAH_No_Pol.jpg
Gail, when are you getting your PhD in Meteorology? With as many papers as you have read, you probably have learned more than most PhD climate scientists already.
I have been a meteorologist for over 40 years now and because of my interest in forecasting, I have looked at the surface and upper air weather patterns almost every day over that period. My subjective experience is that there is not any noticeable change in the frequency of “buckling” of the jet stream and formation of upper level omega blocking high pressure systems around the northern hemisphere. The prevalent location and duration of these blocks does change from year to year and that drives weather changes from year to year, especially in the winter and higher latitudes.
The GFS is currently forecasting a blocking upper level high to set up next week over western Canada and associated with the first real arctic cold front of the year that is currently forecast to push all the way into the deep southern US late next week.
GFS 500 mb forecast northern hemisphere:
http://wxweb.meteostar.com/models/ipsm_looper.php?PROD=2016010406_NHC_GFS_500_HGT_WINDS
(this link will not work beyond about 24 hours from this posting)
GFS surface temperature forecast northern hemisphere:
http://wxweb.meteostar.com/models/ipsm_looper.php?PROD=2016010406_NHC_GFS_SFC_TEMP_IMAGE
(this link will not work beyond about 24 hours from this posting)
Use this link beginning January 5th or later and select the appropriate options:
http://wxweb.meteostar.com/models/list_model.php?aoi=NHC&model=GFS
Another very powerful and flexible weather visualization tool with GFS past and forecast data (click and drag to move the globe, use mouse roller to zoom in and out, select different overlays by clicking the “earth” link lower left):
http://earth.nullschool.net/#current/wind/surface/level/overlay=temp/orthographic=-99.57,46.67,414
The GFS doesn’t have the best track record at forecasting more than about 3 or 4 days, so we will have to wait and see if it is right this time. But it is just a matter of time, because there are always arctic cold fronts that develop every winter affecting the eastern US. Some years, like the last two, just per chance happen to have more of them and I don’t believe “climate change” is involved. This is purely the normal chaotic weather. Global temperature change of plus or minus 0.5C to 1.0C is much too feeble to have much effect on these intense weather patterns. Now when you start talking about global temperature changes of plus or minus 8C to 12C or possibly more, as happened in each of the last glacial periods, then we will see some major impacts on the weather patterns.
I see no evidence that the pattern of glacial cycles over the last million years is going to be broken any time soon. In fact, our best reconstructions of the paleo record indicate the glacial periods are getting longer and slightly colder, lasting over 100,000 years, while the interglacial warm periods are staying about the same at 10 to 20 thousand years but getting slightly warmer than over a million years ago. The next glacial period appears to be inevitable and the gradual descent into extreme cold and dangerously low CO2 levels could start at any time. This will be a MAJOR challenge for humanity. Imagine deep ice covering places like most of Canada, the northern US and Rocky Mountains, as well as much of northern Europe. Also, vast areas where crops are grown now will be turned into tundra, deserts and will expand greatly, vegetation will wither and barely be able to survive with the low CO2, and earth will not likely be able to support near as many humans as is possible now.
It certainly does not appear that high CO2 levels have prevented any of the recent glacial periods, so in my view CO2 is not a problem and the higher we can keep it, the better for plant and crop growth. In thousands of years, humans may be looking for ways to get more CO2 into the air to help mitigate the detrimental effects on vegetation caused the next glacial period and decreasing CO2 as more is absorbed into the increasingly colder oceans. By then, fossil fuels may be largely exhausted. Trying to remove CO2 now is very short sighted and certainly not worth the terrible economic impacts from greatly increased energy costs that will be the result of current policies in many developed countries.
We don’t really know what ends the interglacial warm periods and starts the glacial periods. It is probably the result of a complex interplay of multiple factors over time. Maybe in a few hundred thousand years, there will be climate models that can accurately predict these cycles if humanity survives. But until then, I have no confidence in our very crude and totally unvalidated climate models.
…agree 100% thank you
oz4caster,
Thank you very much.
I am just curious and trying to figure out what is actually going on with out the money generated hype. It would be nice to have an idea of what the climate is going to do in the next few decades or hundred years.
I think it is extremely foolish not to be putting a lot of this wasted money into nuclear power, desalinization and plant biology. (With fusion as the next generation power.)
With enough power we can feed humans going forward although it might take specialized greenhouses. We can also produce CO2 from limestone to feed those greenhouses as needed. Instead the Elite rather make sure most of us die. Unfortunately that never seems to occur to activists despite all the evidence of mass murder by government in the 20th century.
We really need Mother Nature to give us a major wake-up call and that wake-up call is due fairly soon. Solar Cycle 24 will start bottoming out in the next few years.
http://www.solen.info/solar/images/cycles23_24.png
As J. Feynman et al said in a recent paper “Such a leveling off or decline of the long-term solar component of climate change will help to disentangle its effects from that of anthropogenic greenhouse warming “ — Solar variability and climate change’ Geomagnetic aa index and global surface temperature
Let’s just hope that a bit of honesty shows up in the scientific community at the same time, but I doubt it.
” We can also produce CO2 from limestone to feed those greenhouses as needed.”
Funny thing is you get cement as a byproduct of that process.
http://joannenova.com.au/2014/03/solar-output-correllates-with-the-north-atlantic-jet-stream-over-a-millenia/
If there was less of a gradient between the Equator and the Poles as MS claims, we could expect a more Zonal jetstream, and less wild swings of the weather, less vorticity. But, as Ol’ Sol winds down for a nap, we’re seeing quite the opposite.
Lectrikdog you are correct. The shape of the Laurentide Ice Sheet follows the shape of the weather patterns we saw in the cold weather of the late 60s and early 70s and the cold we are seeing now. Only the brain dead could not add 1+ 1+1 and see meridional jets are a sign of a cooling not a warming world.
Here is another peer-reviewed science paper based on actual physical evidence that Martin hates so much.(They show he is uneducated.)
Thanks again for a wonderful time, people.
+1
I guess Martin is done strutting around the board, knocking over pieces, and will now fly back to his flock to declare victory.
Yes, it’s time for a new batch of trolls, Marty has become a half smart condescending prick. I can no longer be bothered with his idiocy.
I am a very patient man, but I cannot tolerate liars. Marty knows that he cannot make any definitive claim about man made global warming, and yet he continues to do so. He has had his nose repeatedly rubbed in the mess he makes and has been shown that NV is still the only known driver of global climates, yet he continues to mess on the carpet. If he were my dog, he would now be an outside dog, and would never be allowed back in the house.
Actually , Gator.
That particular dog needs to be sent to the pound to be “re-purposed”
Marty always quits when he is way behind.
Run, run, run little loser, you have succeeded in making a monumental FOOL of yourself, YET AGAIN.
Well, Martin, can you post a map of the Arctic stations that were used for the NOAA “warming”
I bet you cannot and will not.
Why?
Because most of the points are fudged.
Satellite data shows that the Arctic is COOLING !!
http://s19.postimg.org/i7k87yl9v/UAH_No_Pol.jpg
There is basically NO land data except that FABRICATED and smeared by the Fraudsters at NOAA/GISS. The warming as a FABRICATION, pure and simple.
Jan 4. And I’m tired of shoveling already.
I know exactly what you mean, Have you had any snow? 😉
I am tired of shoveling too… but the stuff, I am shoveling ain’t white.
Ted’s done one heck of a lot of shovelling the last couple of days. !!
Trying to clean up the BS left by someone else.
Heh. Yeah, don’t know of any kind of shoveling that’s enjoyable.
Deja vu is the right expression, you are right, since this kind of staff happen from time to time. For example, climate alarmists have run wild with predictions about the Monster El Niño active in the Pacific for several months. A corresponding situation existed in late 1939, and here are more details about that: http://oceansgovernclimate.com/storm-frank-el-nino-insufficient-explanation/.
Piers Corbyn has the handle on the jet stream,weather action ,the wild meanders of the jet is to do with low sun activity according to piers.
Of course it is. It is actually well known but that does not stop the Propagandists from rewriting ‘The Science’ to suit their political purpose.