Arctic sea ice extent is as high or higher than last year, 30% higher than 2012, and almost the same as 2013.
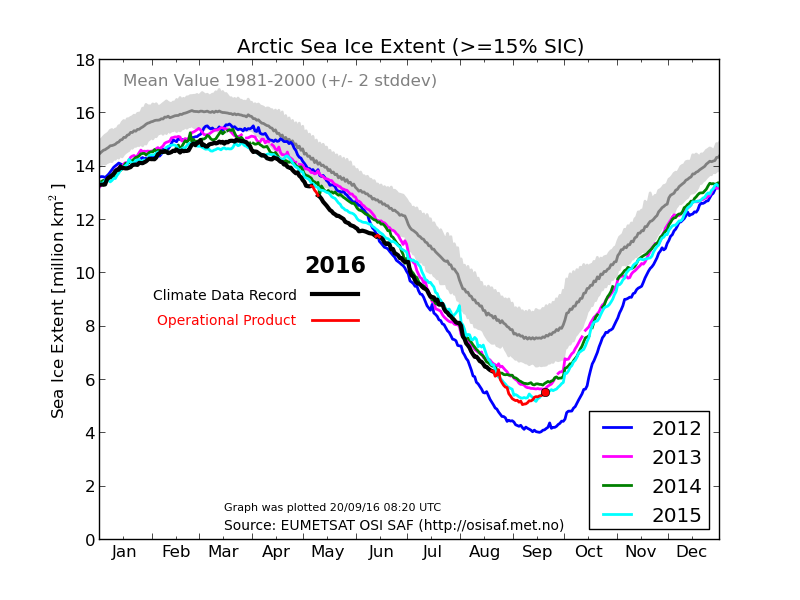
Ocean and Ice Services | Danmarks Meteorologiske Institut
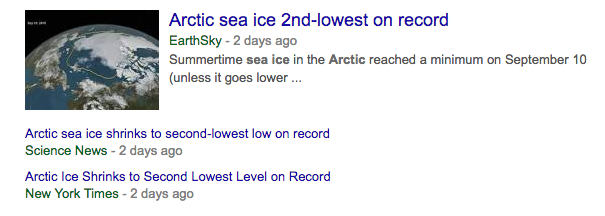
Meanwhile, experts say that Arctic sea ice is shrinking and near a record low.
Leading scientists also say that the Arctic is ice-free.
According to MASIE, 2016 Sept. average is already higher than 2007, with 11 more days of gains yet to be factored in. This year will likely end the month close to 2008 and/or 2011.
https://rclutz.wordpress.com/2016/09/17/arctic-plateau-continues/
Isn’t it amazing that the narrow points….around June and December….have not changed at all
Only the very unstable extremes…..which can be changed by not holding your mouth right
Not you as well Tony? You’re a bit late jumping on to the particular bandwagon aren’t you?
How about looking at area for a change? After all, that might help explain the so called “Rapid Sea Ice Growth” of which you speak?
http://GreatWhiteCon.info/2016/09/the-2016-arctic-sea-ice-metric-minima/
Not content to stick to your own lying website I see….liars gotta lie. Keep spreadin’ da love jimbo….
It’s data Tim.
Are you familiar with the concept?
Hey Jim the data says the were millions of sq kilometers of disappearing Arctic sea ice…….again this year. Just when exactly are we going to see a sea ice free Arctic? Everything has been going “your” way. Massive cyclones, “record” heat if you can believe a short term data set with not many data points, warming water if you can believe the anomaly data set. Yet the sea ice remains
Sure…go away jerk…you understand that?
And so it goes for folks in Jim’s crowd:
If extent is up, counter with area.
If area is up, counter with volume.
If volume is up, counter with extent.
If all three are up, either hide or lie.
And there was me thinking that was the MO of Tony’s crowd.
He never did explain why he keeps flipping between Bremen & DMI extent (in the recent past at least). Especially since he claims that DMI’s data is “fraudulent”:
https://realclimatescience.com/2016/05/arctic-fraud-continues-unabated/
You are asking Tony’s crowd to prove the null hypothesis. Your understanding of the scientific method is backwards.
Jimbo’s understanding of basically everything is BACKWARDS..
Yes I expect Jim to be crawling back into his hole again for awhile pretty soon. We may see him the first time they start harping on the distortion of the “polar vortex” this winter when the NE US gets a good blizzard or we have an exceptionally cold spell this coming winter. And it probably IS going to be a pretty strong winter for we in the eastern half of the nation this year.
How does it feel to know that you are Tony’s beck and call, Jimbo.
Your desperation at the Arctic sea ice NOT melting down to 1 Wadham, is hilarious to watch.
You continue to make an ADJECT FOOL of your self. :-)
Shurely shome mishtake there Andy?
Perhaps I might take this opportunity to remind you that because Tony still hasn’t got around to it, even after all these months, I’ve most generously posted an article which provides the perfect platform for you to air your views on the first 3/4 of the Holocene:
Radio Four in Arctic Sea Ice Bias Shock Today!
Please do bear in mind, however, that your usual ranting “opinion” pieces with no science to back them up will be summarily red pencilled.
Again, you are the one claiming to have FACTS on your lonely little CON web site. But you intentionally LIE from the very start and keep the LIE going.
Do some real RESEARCH and FIX IT, so it no longer looks like a rabid propaganda BS scam of a web site.
If you don’t have the capability of doing basic research ask one of your handlers at Exeter unit.
I’ll take that as a “no” then shall I?
No, you will NEVER do the necessary research to update your web site from its current status as a propaganda sewer.
We know you are incapable, inept and unwilling,
I’ve invited you to make your case.
You have declined.
The obvious conclusion is that you have no case to make.
I have invited you to do some basic research of your own.
You prove yourself to be either inept or incapable..
or to remain wilfully and intentionally ignorant
or both
Well done, Jimbo. you are a LOSER to the very end.
Seems that you actually WANT your scam web site to remain the LYING mis-information sewer that it has always been…
Says something about your lack of character that you actually WANT to be known as a LIAR and a CON-MAN and nothing but an empty, worthless, a-soul.
All Tony has to do is mention the word “Arctic” and there you are, bringing with you all the sewer and BS you have been wading in on your slimy little con web site.
You are at his beck and call, and you are too thick to realise it. :-)
Poor Jimbo, tries to argue against rapid sea ice growth, by showing a graph where the growth in the fortnight has been RAPID compared to any other year shown.
That worked well hey, Jimbo, you clown. :-)
Ever fancied circumnavigating Banks Island Andy? This from the 19th:
Thanks for confirming that Larsen’s 1944 route is completely blocked off.
You are doing a great job of showing just how much sea ice there is still in the Arctic.
Keep up the good work for the Arctic realists, Jimbo
Now off you go and do your little Banks Island trip, bozo.
Why would anyone look at area or extent….when you talk about how much ice?
….that’s volume
Who was stupid enough to fall for that one?
How thick do you suppose all that ice is then Latitude?
Nothing is thicker than YOU, Jimbo
How thick do you suppose all that ice is then Latitude?
Well that’s stupid….there’s no accurate measurement of it
We agree on something then Latitude!
Are the curves homogeneous ? i.e. prepared with equivalent data sets and same algorithms ?
If I remember, in the past, they used more “generous” extent figures, and tend to give lesser scores for the same configurations as years go by.
Their latest change of algorithm (dubbed “operational product”, ahah) was a real mess for several months because it showed frankly impossible drops in the ice extent. Now they seem to have reached a level where it is less smelly to the end users, but I didn’t notice a reprocessing of the previous curves.
So I’m wondering, are we seeing an apple and oranges bag of extent curves, with before 2006 a generous cookie-cutter approach, then some bartering with “masks” for the following years, and now the “operational product” which seems to be the stingiest of all.
That would be reminiscent of the “adjustments” made to the avg temperature historical curves year after year.
There is no doubt at all that Arctic sea ice is growing rapidly for this time of year.
Most other years were still melting at this day.
In this Sunshinehours graph (NSIDC data, iirc) 2016 has overtaken 2007, and is RAPIDLY catching 2015, 2014 and 2010. (and another unstated year)
“Most other years were still melting at this day.”
add .. “or had only just started to turn”
The ‘shortest’ melting season on record, my god, you are really grasping at straws, here, Tony. The ice melted away this year, the northabout did a circumnavigation of the entire arctic. Yet you make this day to be ‘almost as much ice as 2013’? Do you cherry pick much? You didn’t talk about arctic sea ice lately until now, when the current ice extent has come back into the ‘new’ normal. 1979 was a peak year? No, it was not. The winter’s ice that year happened to be above average, but the summer minimum was lower than your vaulted 1974 minimum. On average, for the year, arctic ice in 1979 was not a high for the period, period. You like to claim that ‘scientists’ glom onto 1979. They don’t, and you are a fucking asshole for pretending that is true.
Many scientists have explored the arctic sea ice extent before the continuous reliable data from microwave satellite data. They all conclude that 1979 was not a peak year for arctic sea ice, other than the winter ice extent. And even then, not a very significant peak, at that. Face it, for 36 years we have had a fairly accurate data set of arctic sea ice, and it refutes everything that you stand for, my friend.
Zero science again, hey Git.
There is only one a’hole around here, and its you.. and you appear to have the runs.. !!
We have 36 years of accurate measurements form a peak in the late 1970’s, they coincides with the base of the AMO, coincides with temperatures in Iceland, etc etc etc
Winter extent of sea ice were very high in the late 1970’s , after being low during the 1920-1940’s.
Are you saying that the sea ice melted a lot faster in 1979, to reach low minimums???
So sorry, gormless gut, the recovery from the Extremes of the LIA and the near extremes of 1979, is over. There has been a ZERO trend in average sea ice for 10 year now., By some calculations , actually a slight positive trend.
From now, we will see and increase of Arctic sea ice year by year and ignorant little cockroaches like you and Jimbo will run scurrying back to their crevasses where they came from.
Haveyou read my commentary on that graph yet Andy? If not, here you go:
http://GreatWhiteCon.info/2016/02/the-great-global-warming-policy-forum-con/
Maybe Mr. Clutz will pop in here soon and show us all the 2016 version?
I couldn’t give rat’s a**e about any commentary from you LYING PROPAGANDA BS CON sewer of a web site.
So, So desperate for someone to join you in your sewer, aren’t you Jimbo. !
Let’s have a look at sea ice around Iceland shall we.
Even a monkey can see the PEAK in the late 1970’s after a pronounced near zero level through the earlier part of the century.
And that PEAK is up there with the EXTREMES of the LIA.
You claimed last year was the shortest melt season on record when it was not because you misread the graph on where the winter peak was. Any proof this year or just a claim again?
When the summer mimimum is very low you tend to get sharp increases upwards as the ice edge is so far north.
Andy
I just looked at the JAXA values and it did not take me long to find 1985 had a shorter melt season
1985 day 74 max day 250 min
2016 day 59 max day 250 min
I stopped looking after that as claim disproved.
Andy
NO, you have not disproved anything
To show he is wrong using DMI data.
Until then, you have NOTHING, because all of the different systems have somewhat different values.
Sunshinehours has 2016 maximum on day 81.
Two points
I have asked Tony for proof for his claim, that’s normally what science is about, the site is called Real Science. Nothing so far, so it is just a claim.
Tony wrote “Rapid Sea Ice Growth After The Shortest Arctic Melt Season On Record”
Tony put the DMI graph in to show the ice increase speed, not the shortest melt season on record, it cannot show the shortest on record as it only shows several recent years.
Again. – Tony claims “on record” Not the DMI record. There are shorter melt seasons on record as I have shown. So the title is misleading.
That was a poor response from you, as per normal, you will grasp at any straws to defend Tony even when you haven’t even read well what he has said.
Andy
Yawn !! Boring , tedious.
Are you related to Jimbo ?
Prove him wrong using DMI data, or STFU.
I don’t think there is any DMI data showing shortest melt season on the satellite record, so where does Tony get the figures to back up this claim? Feel free to prove me wrong. I get the feeling you prefer to post rather than do background research. Good luck.
Let’s not forget last year with Tony and DMI
https://stevengoddard.wordpress.com/2015/11/07/record-arctic-ice-growth-continues/
Shortest melt season and record growth claim!
Shame the DMI graph was bunkum, which I pointed out at the time and nobody listened on here.
Looking at only one DMI graph to show shortest melt season ever or any other claim is not scientific.
Andy
Need I say more?
So you admit you can’t prove him wrong.
Just blowing air out your rear end, in other words.
Hadn’t you noticed Andy?
It’s now called “Deplorable Climate Science”!
As opposed to a CON/scam web site..
Right Jimbo.
No response from AndyG55.
I guess all the facts pushed him over his event horizon and so him mum put him to bed! Come on Andy, put up some facts on the actual shortest melt season since 1979 so we can see which is the shortest and how that tallies with the 2016 length.
Or are you too lazy and prefer just to post nonsense?
Poor child.
You know you can’t prove TH was wrong… so you double down on your moronic ranting.
You think he is wrong… prove it using DMI data.
Otherwise all you have is meaningless prattle, as usual.