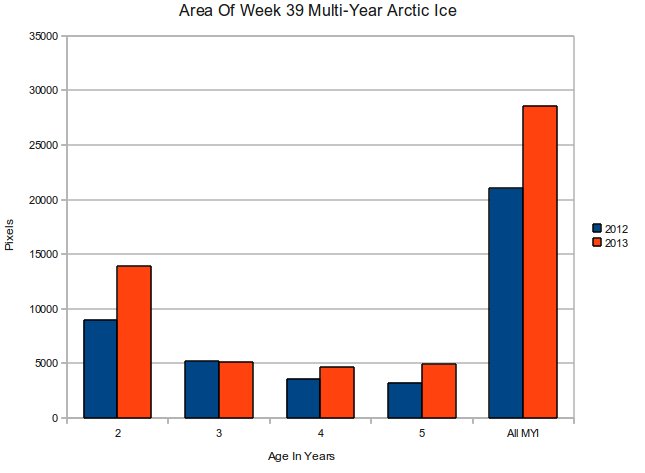
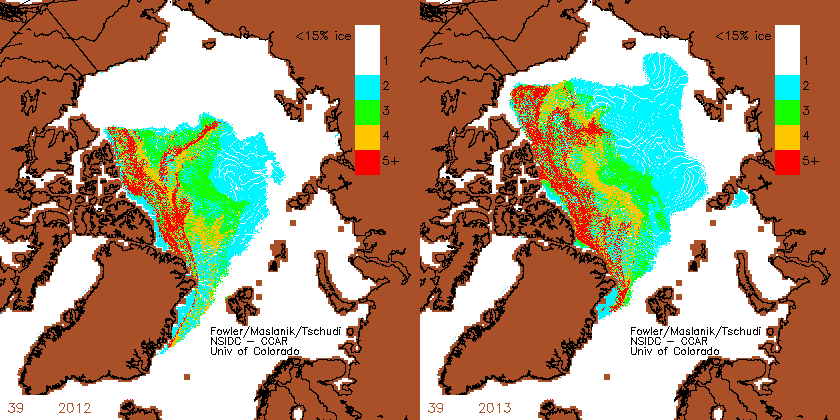
But it is worse than it seems. All of the ice growth has been on the Pacific side, where it will survive the winter and thicken. Can you imagine the sad faces at NSIDC?
Disrupting the Borg is expensive and time consuming!
Google Search
-
Recent Posts
- Analyzing The Western Water Crisis
- Gaslighting 1924
- “Why Do You Resist?”
- Climate Attribution Model
- Fact Checking NASA
- Fact Checking Grok
- Fact Checking The New York Times
- New Visitech Features
- Ice-Free Arctic By 2014
- Debt-Free US Treasury Forecast
- Analyzing Big City Crime (Part 2)
- Analyzing Big City Crime
- UK Migration Caused By Global Warming
- Climate Attribution In Greece
- “Brown: ’50 days to save world'”
- The Catastrophic Influence of Bovine Methane Emissions on Extraterrestrial Climate Patterns
- Posting On X
- Seventeen Years Of Fun
- The Importance Of Good Tools
- Temperature Shifts At Blue Hill, MA
- CO2²
- Time Of Observation Bias
- Climate Scamming For Profit
- Climate Scamming For Profit
- Back To The Future
Recent Comments
- Bob G on Analyzing The Western Water Crisis
- Bob G on Analyzing The Western Water Crisis
- Bob G on Gaslighting 1924
- Hank Phillips on Climate Attribution Model
- conrad ziefle on Gaslighting 1924
- Bob G on Gaslighting 1924
- conrad ziefle on “Why Do You Resist?”
- conrad ziefle on Gaslighting 1924
- Bob G on Gaslighting 1924
- John Francis on “Why Do You Resist?”


The multi-year ice on the Pacific side will take a long time to be expelled through the Fram Strait.
Safely tucked away, with nowhere to go.
Why don’t you show how much ice growth there has been since 2000.
Why don’t you tell us how much warmer it was in July?
So the 36% growth doesn’t matter, gotya.
Why don’t you check the post before this one. That will take you back to 2005 from a neutral data source. Then do a little of your own research, maybe even from past posts here. Most of us here know what the combined data looks like. We are also watching that 2013 line crawl slowly away from past years.