
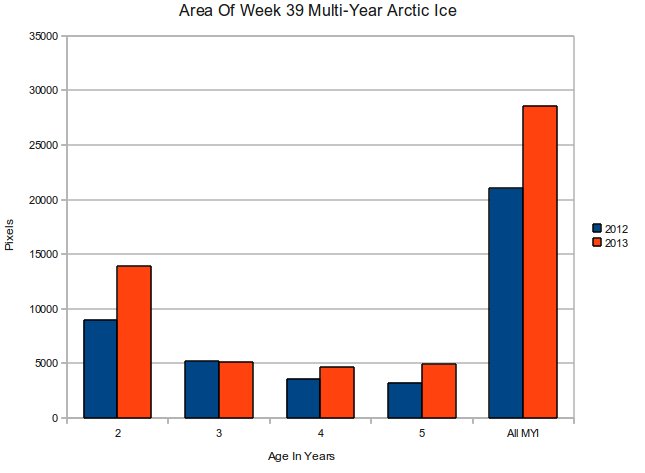
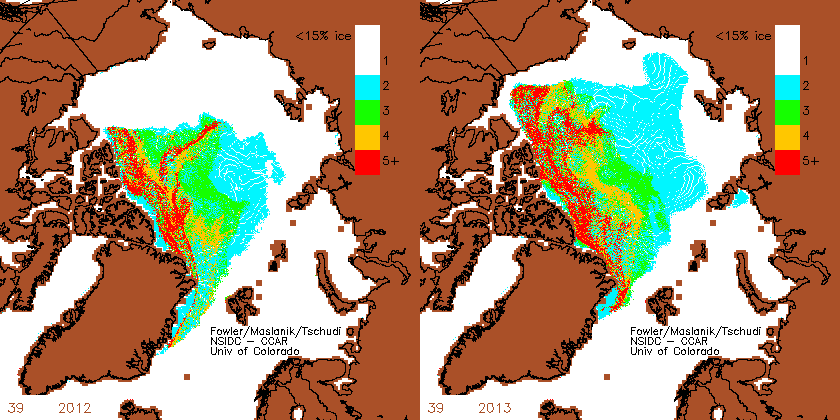
But it is worse than it seems. All of the ice growth has been on the Pacific side, where it will survive the winter and thicken. Can you imagine the sad faces at NSIDC?
Disrupting the Borg is expensive and time consuming!
Google Search
-
Recent Posts
- Three Years Since The Apocalypse
- Arctic Report card Summer 2026
- Elon Pushing Pushing Geoengineering
- Earth, Wind And Fire
- On The Road Again
- Vandalism At The Reflecting Pool
- Fifty Years Ago Today
- Truth Or Consequences
- US Climate Trend Maps
- Declining Spring Snow Cover In Northern New Mexico
- You Can’t Fool Mother Nature
- Cattle And The Climate
- One Atomic Bomb Per Hour
- New Video : Analyzing Oil And Gas
- Is Antarctica Melting?
- High Speed Analysis And Visualization
- El Nino To The Rescue?
- Fake News Update
- Growth Of Antarctic Sea Ice
- 65 Years Of Progress!
- El Nino To The Rescue?
- Worst March Drought On Record
- ChartGL Process Control Demo
- The Biggest Money Laundering Scam
- Drought In The Headwaters Of Lake Powell
Recent Comments
- Gordon Vigurs on Three Years Since The Apocalypse
- Denis Rushworth on Three Years Since The Apocalypse
- conrad ziefle on Earth, Wind And Fire
- Crispin Pemberton-Pigott on Three Years Since The Apocalypse
- Robertvd on Arctic Report card Summer 2026
- conrad ziefle on Three Years Since The Apocalypse
- Terry Shipman on Arctic Report card Summer 2026
- D. Boss on Arctic Report card Summer 2026
- Gordon Vigurs on Three Years Since The Apocalypse


The multi-year ice on the Pacific side will take a long time to be expelled through the Fram Strait.
Safely tucked away, with nowhere to go.
Why don’t you show how much ice growth there has been since 2000.
Why don’t you tell us how much warmer it was in July?
So the 36% growth doesn’t matter, gotya.
Why don’t you check the post before this one. That will take you back to 2005 from a neutral data source. Then do a little of your own research, maybe even from past posts here. Most of us here know what the combined data looks like. We are also watching that 2013 line crawl slowly away from past years.