It turns out that the growth in Antarctic ice was just an algorithm error. This is excellent news for professor Chris Turney who now knows that his multi-million dollar entrapment was a simple software bug.
<ctrl-alt-del>
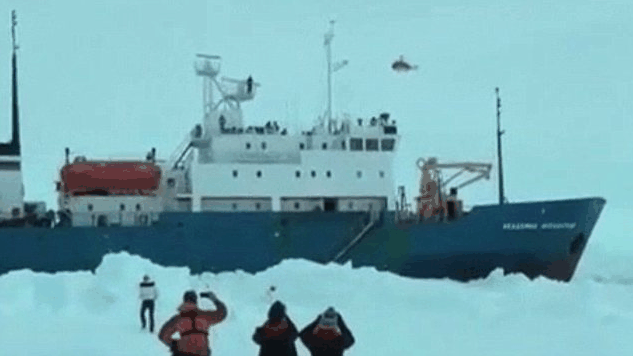
It turns out that the growth in Antarctic ice was just an algorithm error. This is excellent news for professor Chris Turney who now knows that his multi-million dollar entrapment was a simple software bug.
<ctrl-alt-del>
Experts say now that Antarctic sea ice growth is an algorithm error.
The map below shows ice gain since July, 1986 in green, and loss in red. There has been a 7% increase since 1986.
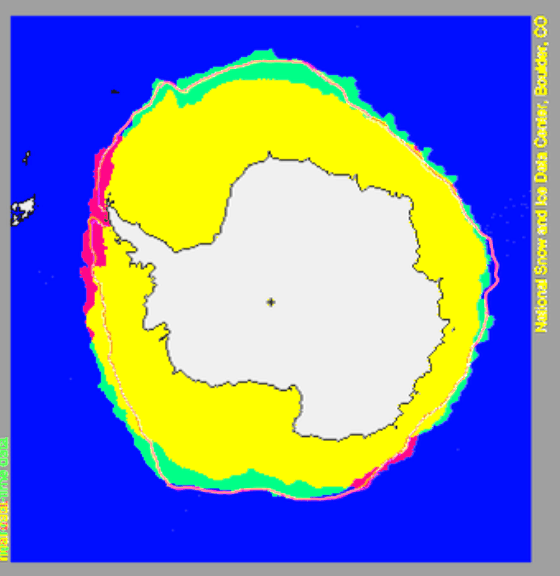
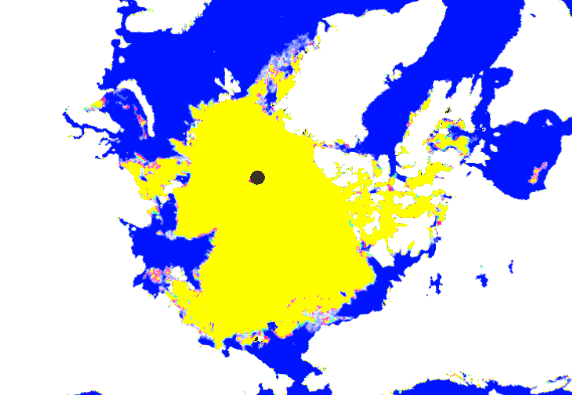
At the peak of the melt sea season, the Arctic Basin is stone cold and very little melting is occurring. Green shows increased extent since Sunday, red shows loss.
Climate activists are becoming more open that their goal is communism.
Climate change conference calls for an end to capitalism
A climate change conference held in Venezuela involving roughly 130 green groups has ended with a call to end capitalism and reject carbon markets, reports RTCC.
The UN-backed conference included organisations such as the World Wildlife Fund, Christian Aid and the Third World Network.
Ending with the Margarita declaration, the conference was the largest of its kind, inviting non-governmental organisations to engage with the UN in climate change talks.
Climate change conference calls for an end to capitalism | City A.M.
h/t to Steve Case
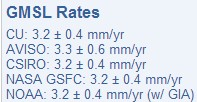
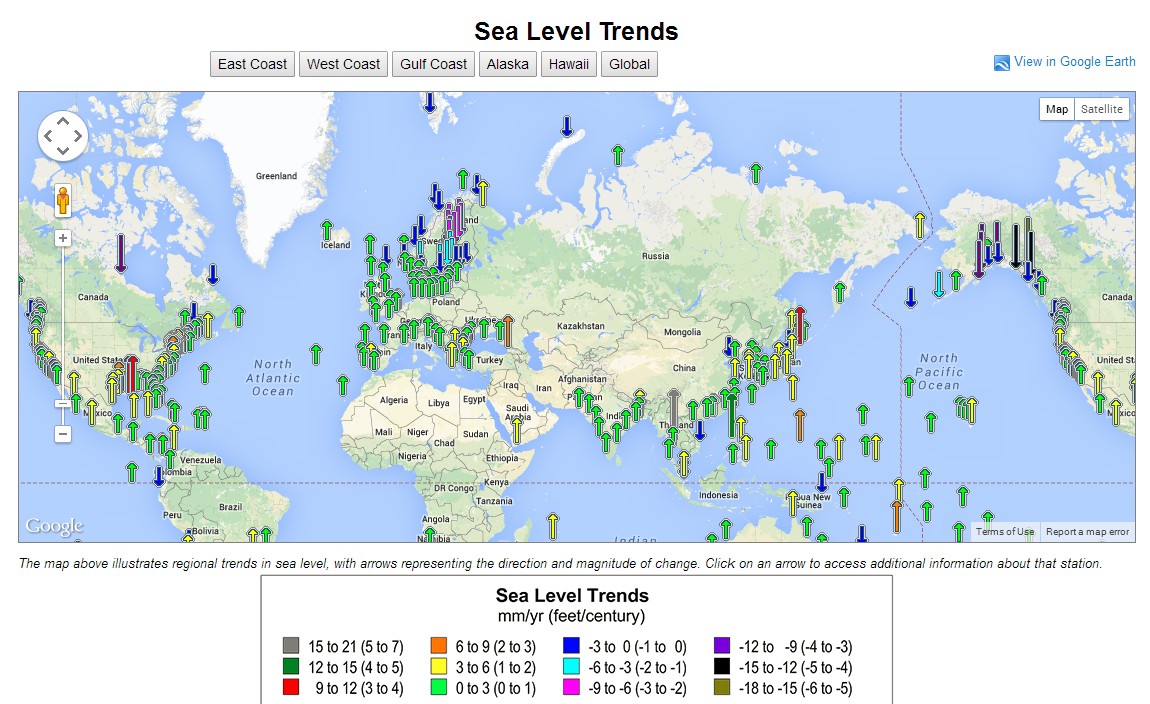
According to the experts at the University of Colorado, everyone agrees that sea level is rising 3.2 mm/year
They are using that new kind of climate math (Common Core inspired) where almost all locations are below the mean.
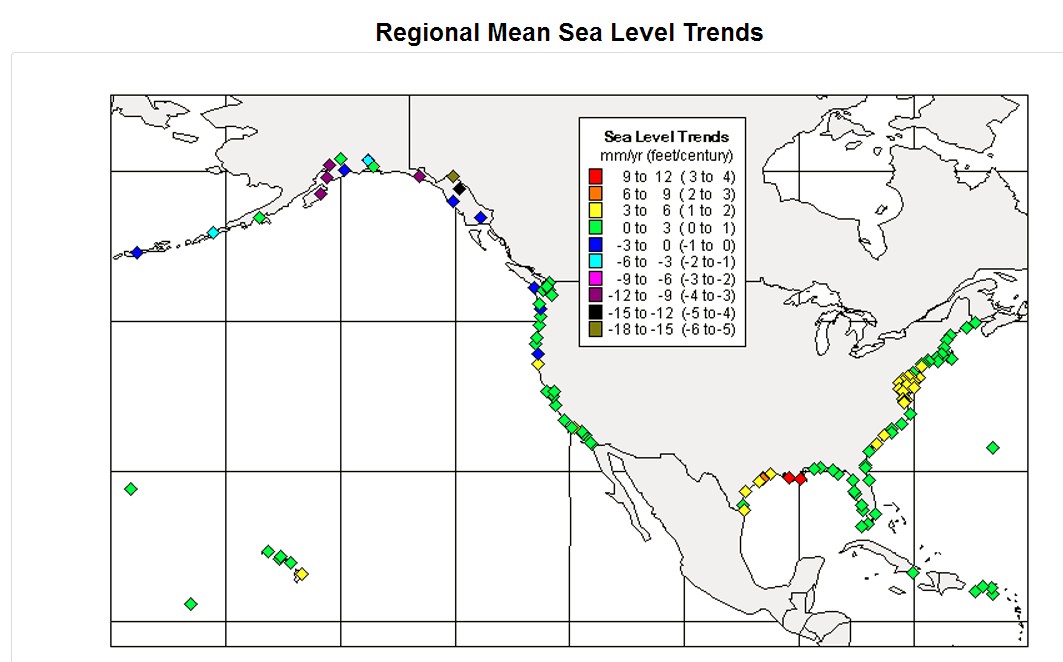
Regional Mean Sea Level Trends – NOAA Tides & Currents
Like I always say, you simply can’t make up fundamentally stupid like climate experts. They have to work hard at it.
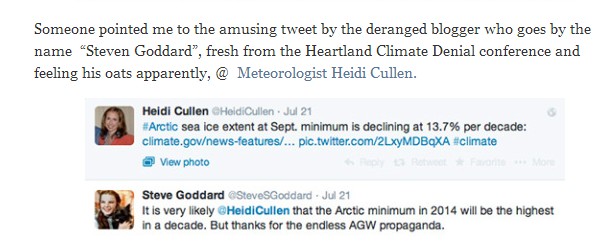
Read the comments on this article. A few of the standard – “Goddard doesn’t know what he is talking about, but may be right about this one”
Arctic Ice: Midsummer Melt Update | Climate Denial Crock of the Week
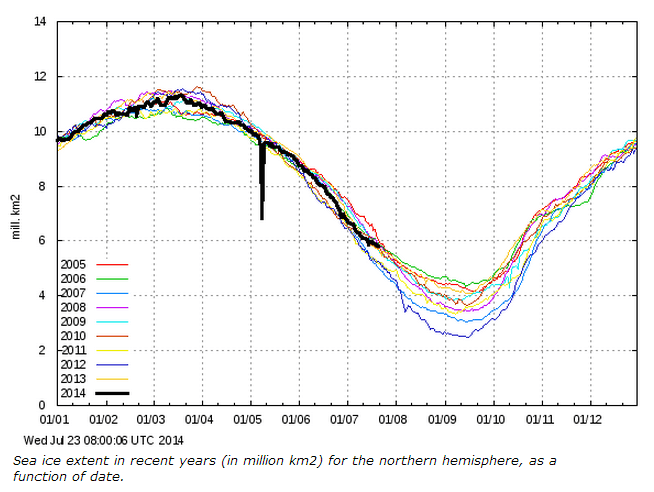
Reading simple graphs is difficult for scientists.
COI | Centre for Ocean and Ice | Danmarks Meteorologiske Institut
President Obama is blaming the current fires in Washington on global warming. As always, he has absolutely no idea what he is talking about.
Great Fire of 1910
Believed to be the largest fire in U.S. history, the Great Fire of 1910 burned over two days from August 21 and August 21, 1910, in the states of Washington, Idaho and Montana. An estimated three million acres of land were burned by the blaze and 87 people were killed.
Largest Wildfires in US History | List of the Worst Wild Fires
According to NASA, 1910 was one of the coldest years on record.
The frequency of 100 degree days in the US peaked just below 310 PPM CO2, and has been declining as CO2 has increased. There is absolutely no correlation between hot weather and increasing CO2.
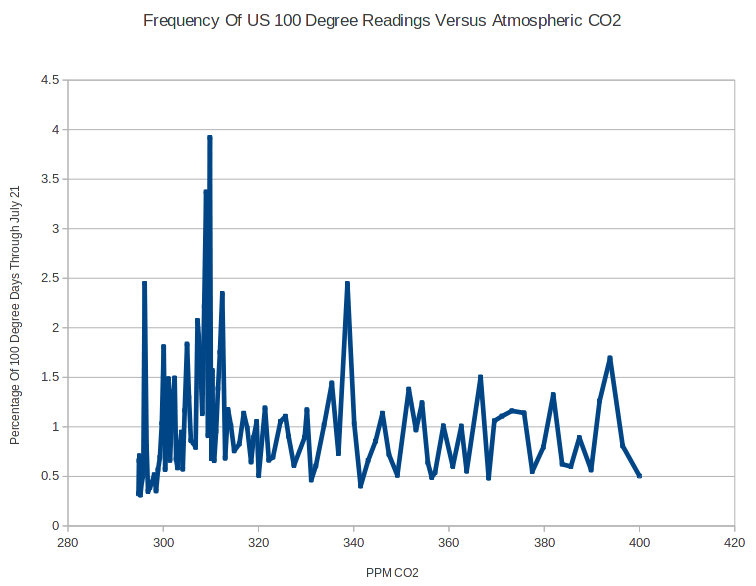
The frequency of 100 degree days in the US is near a record low, and has plummeted since the 1930s. The last really hot summer was 1980, with CO2 well below 350 PPM.
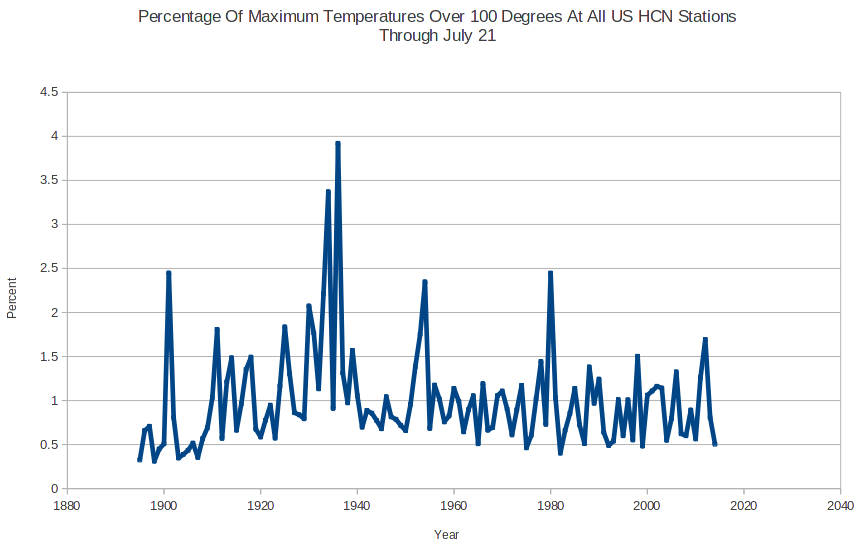
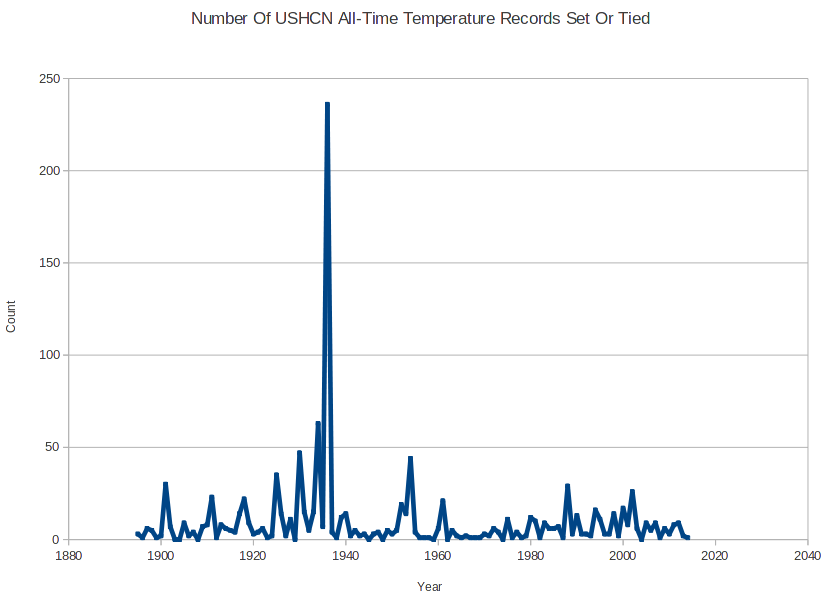
The graph below shows the numbers of USHCN stations which set or tied their all-time record for record heat, per year.
Note that NCDC’s fake record hot summer of 2012 didn’t even rank in the top 30. There is no time bias to this graph. If 2012 matched 1936, both years would be counted.
BTW – all-time record temperatures can not be explained away using TOBS – even by the worst climate crooks.