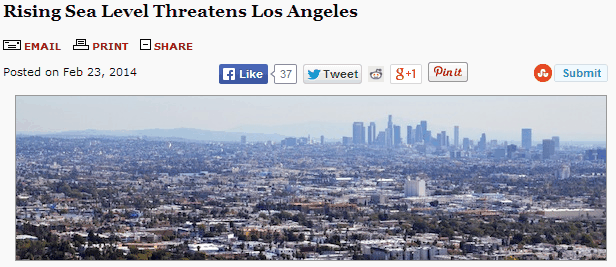
There has been a big push by the climate liars recently to scare Californians into sea level neurosis
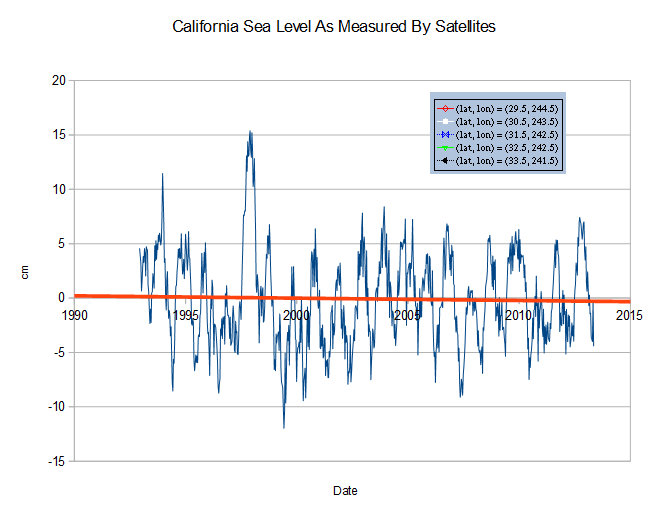
Satellites show that California sea level has been falling slightly since the start of records in 1992.
There has been a big push by the climate liars recently to scare Californians into sea level neurosis
Satellites show that California sea level has been falling slightly since the start of records in 1992.
“The business of skepticism is to be dangerous. Skepticism challenges established institutions. If we teach everybody, including, say, high school students, habits of skeptical thought, they will probably not restrict their skepticism to UFOs, aspirin commercials, and 35,000-year-old channelees. Maybe they’ll start asking awkward questions about economic, or social, or political, or religious institutions. Perhaps they’ll challenge the opinions of those in power. Then where would we be?”
— Carl Sagan, The Demon-Haunted World
h/t to Andy Oz
To a progressive, “tolerance and diversity” means “everyone must believe exactly what they believe”
The survival of the world depends on everyone else adopting their belief system.
[youtube=http://www.youtube.com/watch?v=5FkB4uiizVo]
February, 1936 was a very similar month to this month – heavy snow and extreme cold. Once the snow started melting, most of the Eastern US flooded. The following summer was the hottest in US history.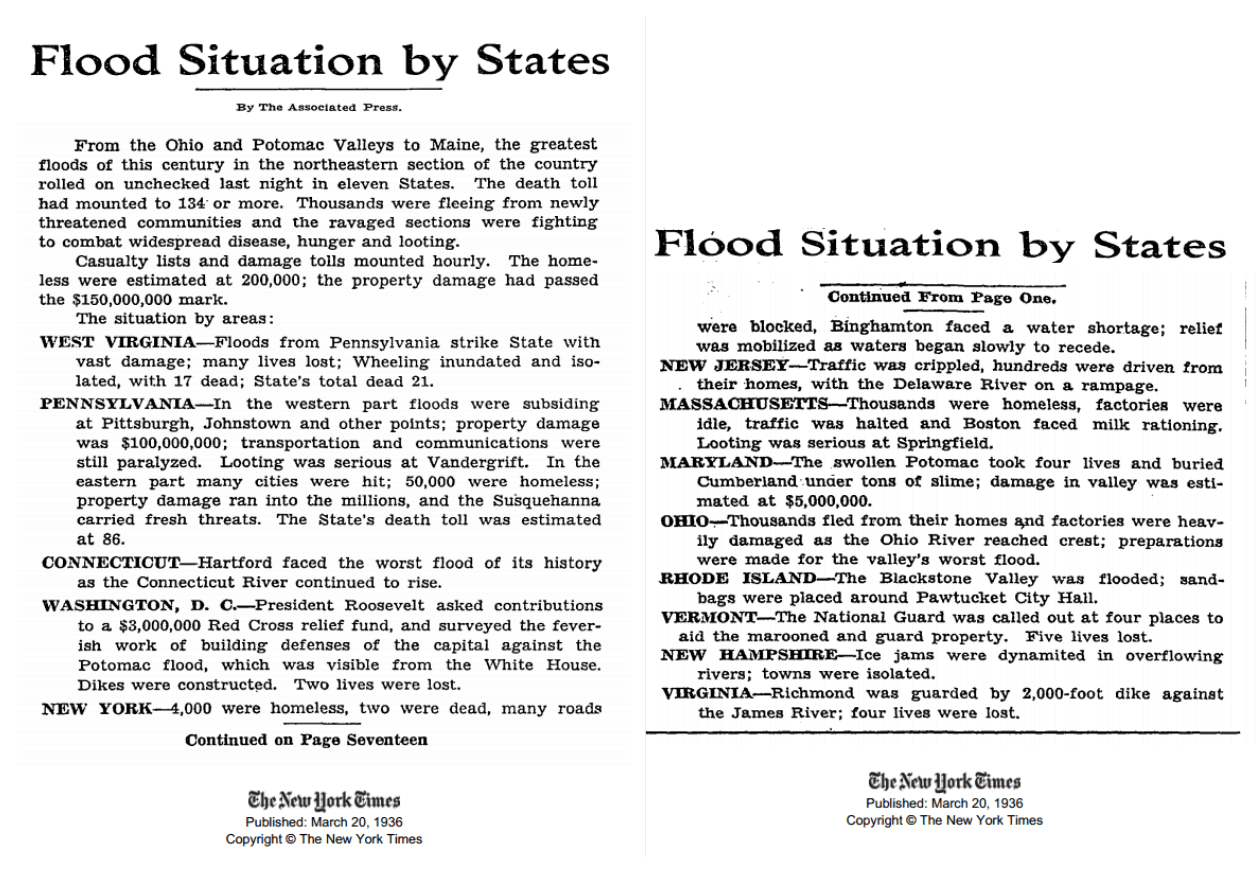
Flood Situation by States – Flood Situation by States – View Article – NYTimes.com
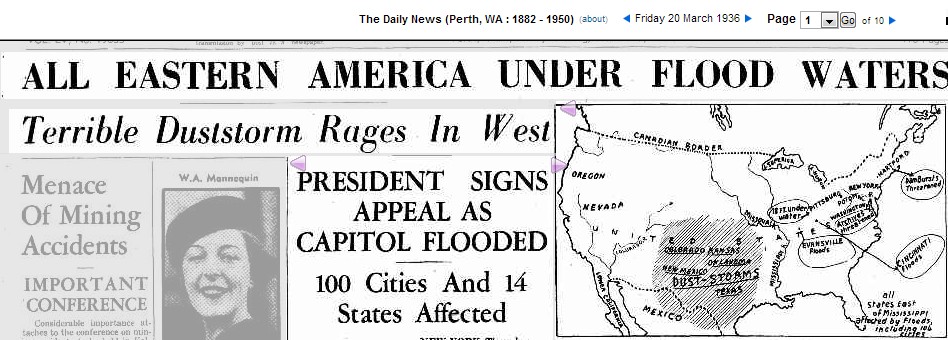
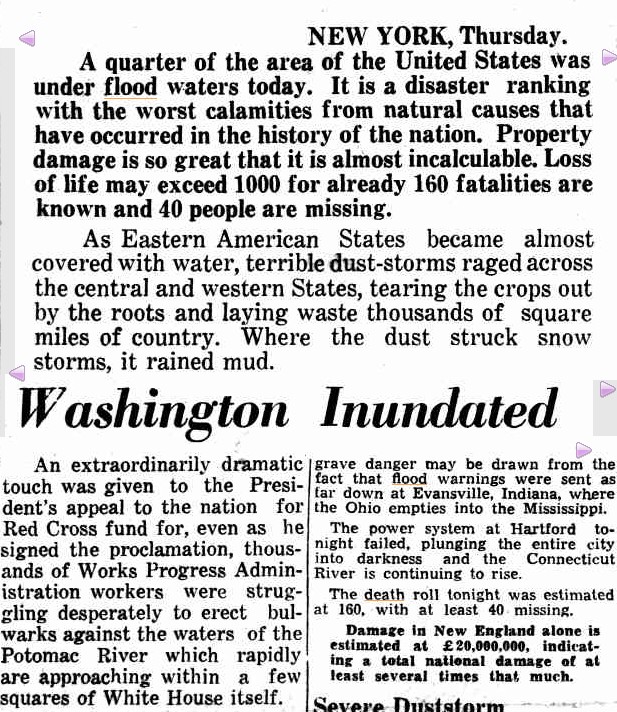
20 Mar 1936 – ALL EASTERN AMERICA UNDER FLOOD WATERS Terrible…
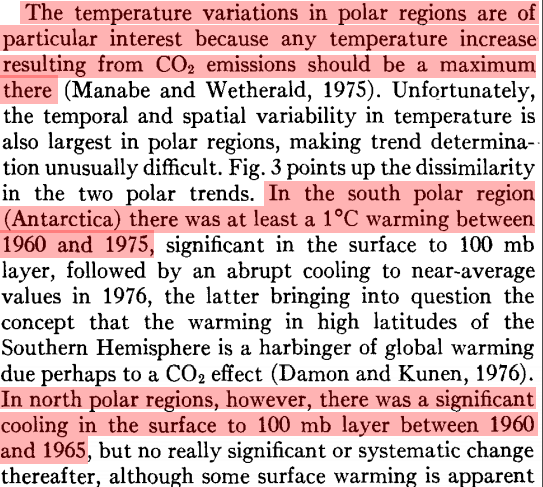
In 1978, scientists saw warming in the Antarctic and cooling in the Arctic, and wanted to blame it on global warming.
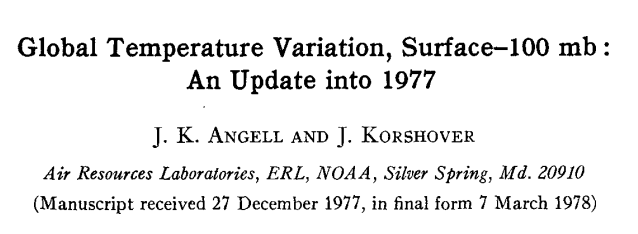
journals.ametsoc.org/doi/pdf/10.1175/1520-0493(1978)106<0755%3AGTVSMA>2.0.CO%3B2
The 1990 IPCC report showed that Antarctic was decreasing while Arctic ice was increasing during that period.
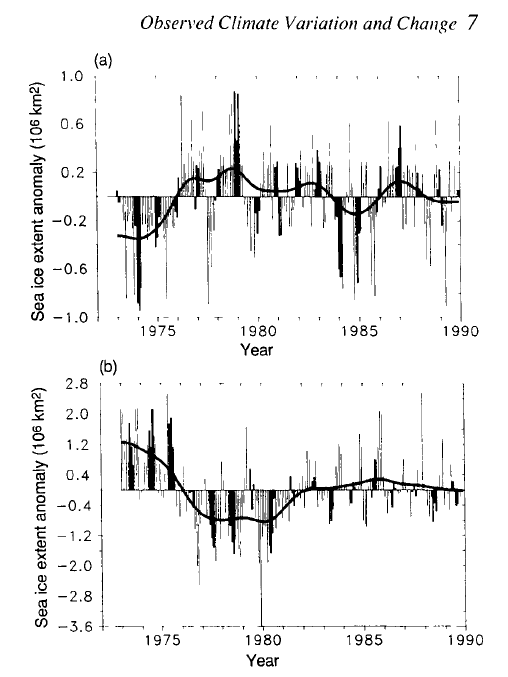
Now they see the exact opposite (Arctic ice decreasing and Antarctic ice increasing) and want to blame it on global warming. Instead of behaving like actual scientists and looking at the big picture, climate scientists cherry pick whatever parts of globe appear to be agreeing with their agenda at the time.
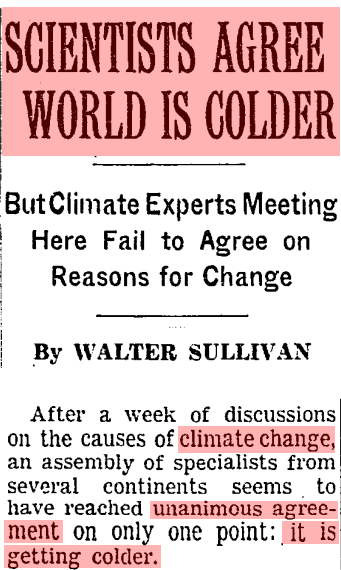
In 1961, there was 100% consensus that the Earth was cooling
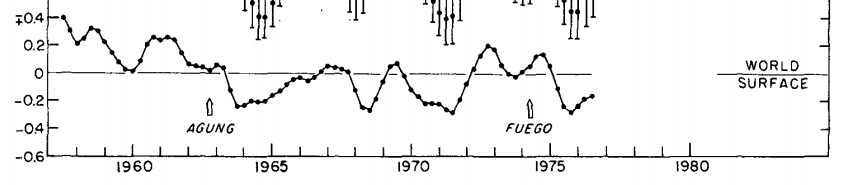
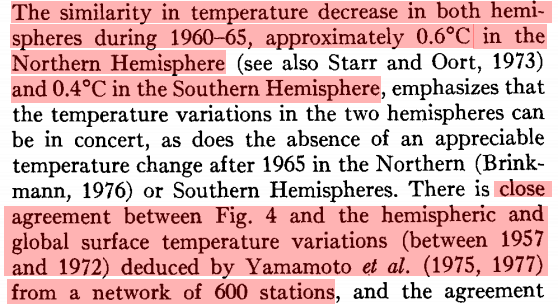
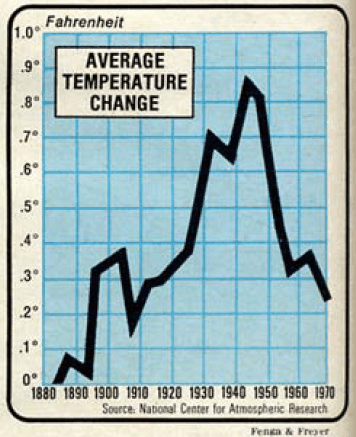
In 1978, NOAA published this graph of global temperatures, showing 0.4C cooling from 1958-1960 and 0.6C cooling from 1958-1976
This cooling agreed with other studies done at the time.
journals.ametsoc.org/doi/pdf/10.1175/1520-0493(1978)106<0755%3AGTVSMA>2.0.CO%3B2
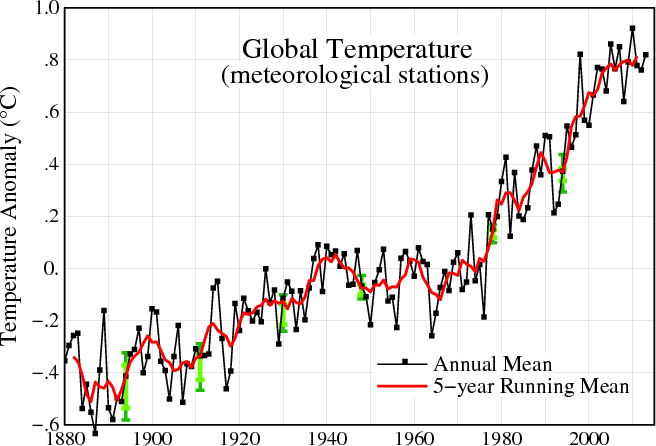
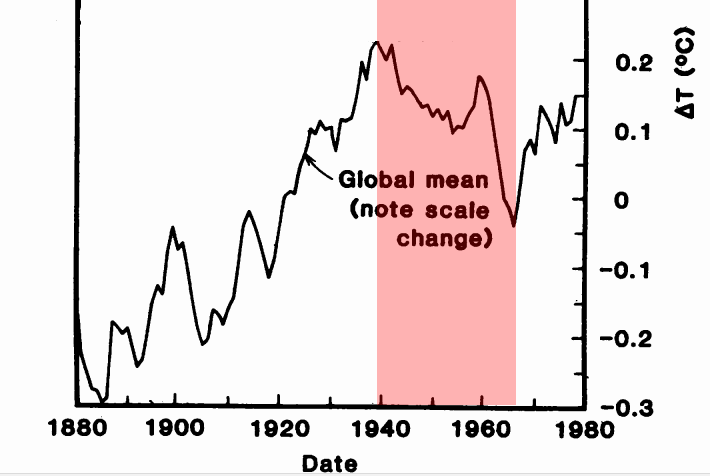
But NASA’s current global temperature graph doesn’t show any cooling around 1960
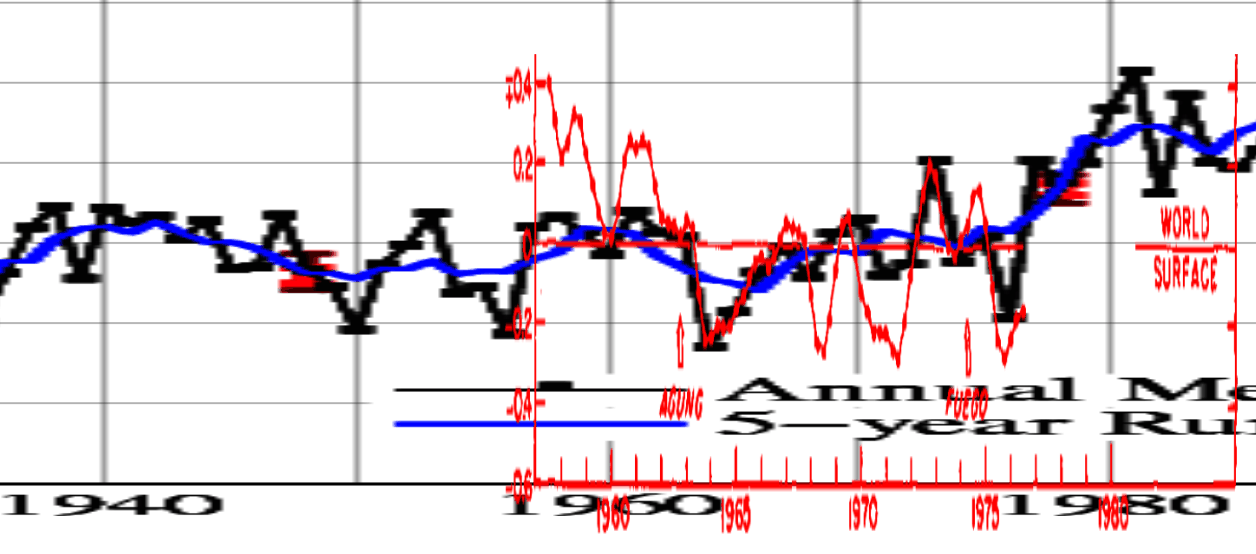
The next graph overlays NOAA 1978 in red on the same section of NASA. You can see that NASA has deleted the unanimously agreed upon late 1950’s warmth and much of the 1970’s cold.
As late as 1981, NASA’s James Hansen knew about this cooling
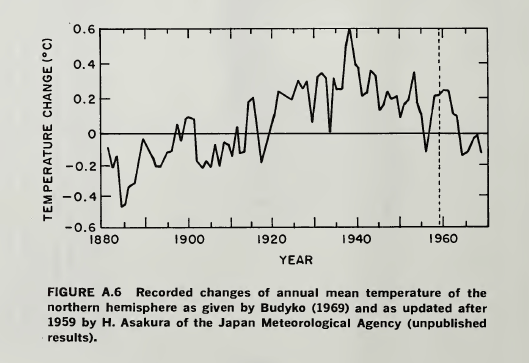
The National Academy Of Sciences knew about this cooling
https://ia801806.us.archive.org/7/items/understandingcli00unit/understandingcli00unit.pdf
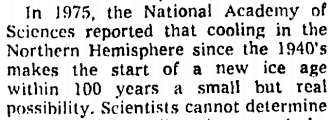
NCAR knew about this cooling
At some point after 1981, NASA’s James Hansen made the inconvenient cooling disappear. We need to figure out how he and the rest of the team did it.
From: Tom Wigley <[email protected]>
To: Phil Jones <[email protected]>
Subject: 1940s
Date: Sun, 27 Sep 2009 23:25:38 -0600
Cc: Ben Santer <[email protected]>It would be good to remove at least part of the 1940s blip, but we are still left with “why the blip”.
In 1978, NOAA showed about 0.6C global cooling from the mid-1950’s to 1970

journals.ametsoc.org/doi/pdf/10.1175/1520-0493(1978)106<0755%3AGTVSMA>2.0.CO%3B2
GISS has since deleted almost all of that cooling.
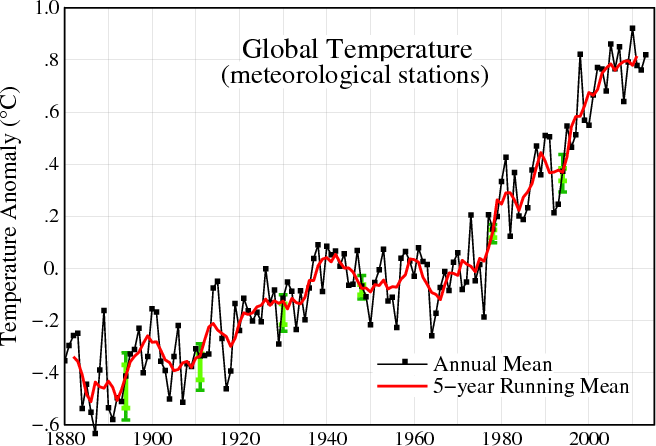
The next graph overlays the 1978 NOAA in red, on top of GISS in blue. GISS has completely erased the huge 1940’s spike, just as Climategate scientists said they wanted to do.