
NOAA is determined to make 2012 the hottest year ever, no matter how much cheating is required.
Thermometers show that 2012 is the third warmest year in US history, after 1934 and 1921. But that story just isn’t going to scare anyone into forking over their hard earned money, so NOAA has massively cooled the past and warmed the present.
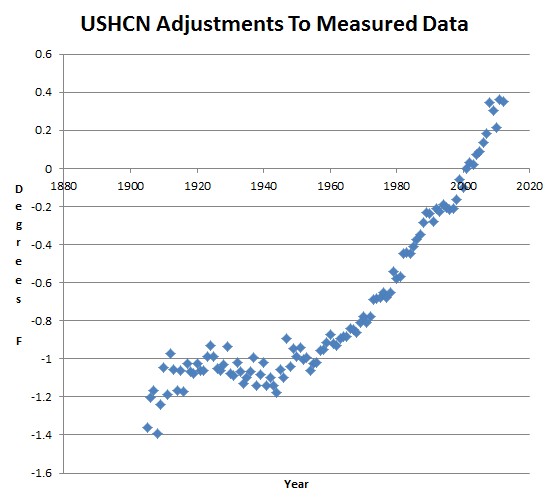
USHCN literature claims that adjustments go flat after 1990, but their actual adjustments increase exponentially. They are adding on an additional 0.6 degrees since 1990, which has no justification, and is plain and simple fraud. The total adjustment since the early 20th century is almost two degrees.

I’m sure you have seen the leaked AR5 on watts site, but this si just too good not to post over and over…
“Many empirical relationships have been reported between GCR or cosmogenic isotope archives and some aspects of the climate system (e.g., Bond et al., 2001; Dengel et al., 2009; Ram and Stolz, 1999). The forcing from changes in total solar irradiance alone does not seem to account for these observations, implying the existence of an amplifying mechanism such as the hypothesized GCR-cloud link.”
That sneak Monckton must have hacked into the latest draft! 😆
Note the typical governmental gobbledy-gook, in the mixing and comparing, within the same sentence, of particularized terms (“cosmogenic isotope archives”–BS alert) and vague, general ones (“some aspects of the climate system”–fake-bolstered by citations, to make you forget that “some aspects” tells you nothing). That is how government fraudsters perpetrate their fraud, with fake “expert” jargon intended to tie your mind up in knots of uncertainty as to just what they are saying. All climate scientists write like that (since they don’t know physics, and can’t maintain an objective train of thought), and they are all incompetent. Physics is real, requiring strictly objective terms; it is not political rhetoric, which is all you get from climate scientists and the IPCC. We are up against an entrenched, criminal mafia (the Insane Left), that is what everyone needs to understand now.
Hey Harry! Look carefully again, and ignore the “gobbledy-gook”…
“Many empirical relationships… implying the existence of an amplifying mechanism such as the hypothesized GCR-cloud link.”
There is no way one can blame CO2, if one holds the above statement to be true.
Harry, this is one of the most cogent observations and explanations I have read.
Remember it’s always the warmest, just before the cold air comes along. My question is, how will they cover up the coming cooling?
Do not worry they’ve got it covered… “Climate Change” The reason why it is becoming colder is because it is over-compensating for earlier heating! Presto, solved… Makes more sense than what these idiots at the IPCCC, NOAA, he rest of the global elitist authoritarian goons spew out. It is quite hilariously sad that just-by-chance these very same psychotic criminals make themselves exempt from the very laws that they demand the rest of us to abide by. They are nothing more than Authoritarian Miscreants, ALL OF THEM!!!
Could you make sure you flashing graphic has the same y-axis for both plots?
A friend of mine (he’s actually an expert in nuclear physics) sent me this comment on your post “Understanding Winter Cold.”
It’s just that planet’s hot air has gone up to the top of the map and it’s melting the snow. If we all turn our maps the other way up then south will be at the top and the warm air will start to rise away from the North pole and save the universe.
Sums it all up rather better than Doha, the NOAA and several other hysterical agitprop groups I think …
gator69
The other reason this leak has occurred from Alec Rawls is so that the text in chapter 7 can be retained on-line without being “tidied-up” prior to publication – (note the summary ignores chapter 7’s findings), so an obvious edit was on the cards to play down the solar link comments in 7.
This cannot now be done.
I’m glad someone else noticed the import of this admission. And yes, that is the best reason for this leak.
Steve,
I like your frequency of record daily high and low charts since those records are never “adjusted”. So they can also never follow what NOAA is doing, they will simply continue to diverge to the point of absurdity (like now). I wonder what they will do about that? Maybe they should propose that all of the previous record highs and lows should be adjusted too. Or is it possible to reverse the adjustments out of the record highs and lows and see what that would do? It might be shocking to see how many record cold events “would have” happened a long time ago with the new NOAA dataset, and publish it. In other words, if we are so gullible to believe the current dataset, here is what it did to all of previous history in terms of records too. It would immediately sound so preposterous as to be laughable.
AR5 draft has a temperature versus models comparison showing the models presently falsified. I would be surprised if that makes it into the final report. (And that is with adjusted data.)
Since every 30 years, the weather service moves up the dates it uses to calculate the ‘normal’ weather temps for the day, wouldn’t that have an impact on what you’re implying?
For instance, in 2010, the National Weather Service started using the 1980-2010 timeline to formulate the day’s normal highs and lows, dropping the 1950-1980 time frame.
So, if the weather has warmed up a bit in the 1980-2010 time frame, wouldn’t that affect what they report as ‘normal’ daily temps?