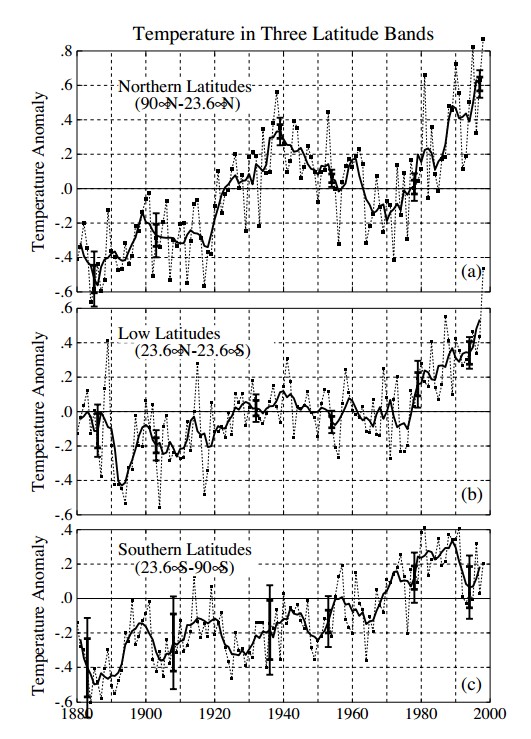
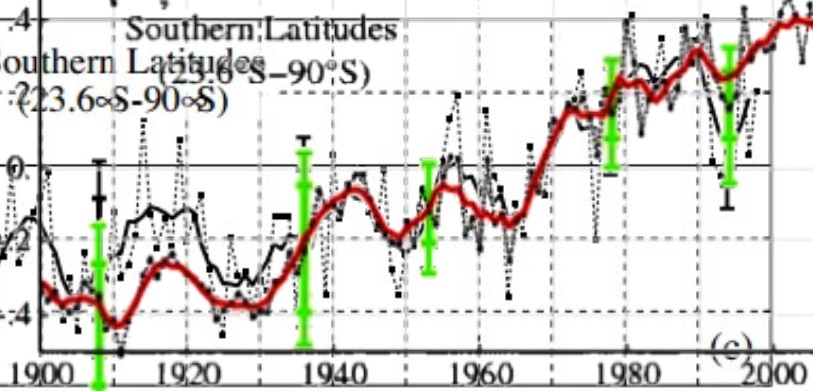
In 1999, Hansen published these three graphs of temperature in three latitude bands.
web.archive.org/liveweb/http://pubs.giss.nasa.gov/docs/1999/1999_Hansen_etal.pdf
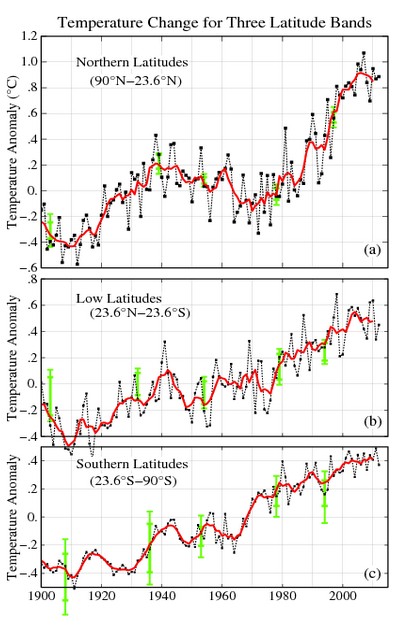
Below are the current versions of the same three graphs.
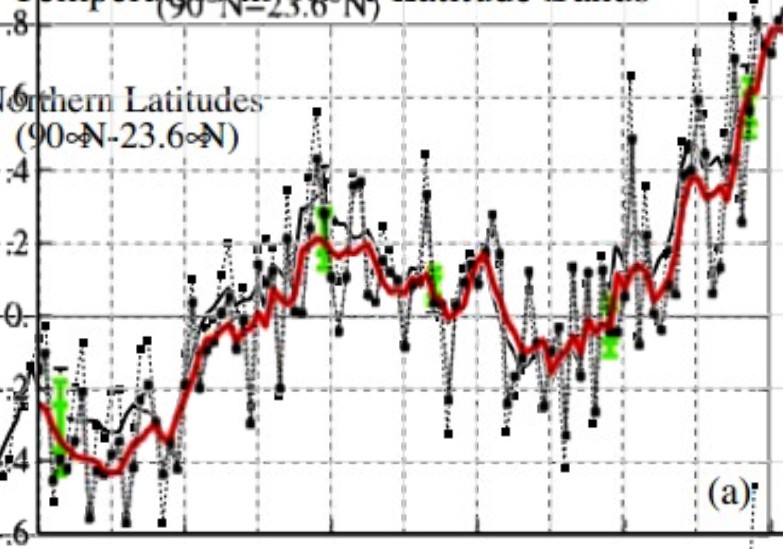
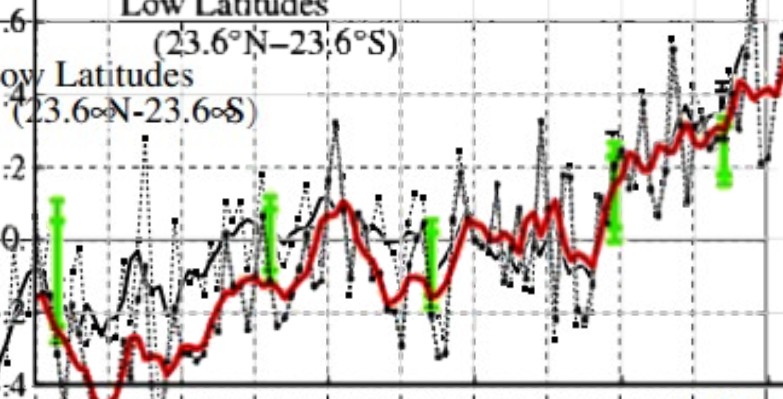
Below I overlaid the new graphs (color) on the old graphs (black and white.) In all three latitude bands he has cooled the past substantially, indicating that he shows no prejudice in his cheating – and is willing to cheat all humans on equal terms.
Mosher says GISS is golden.


He always looked good in handcuffs and his future cell mate, Gyro Jerry will be happy to slide a large portion of comfort his way.
He is a seriously deranged autocrat who is ensuring people die of the cold, he wants more people dead to prove his Malthusian theory correct.
He is that dangerous!
When Dr Spencer was on Stossel the other night, he said AGW activists are killing people. He went on to say he would rather save actual lives today, over saving theoretical lives in the future. That is probably when Schmidthead wished he had agreed to stay and debate. Or not. 😆
Last I heard,The Gav wished he had not agreed to be on the same program with Roy or any other “Realist”!
He has a thing about getting his butt handed to him.
After all he has done, he is saying he disowns the adoring crowd of AGW activists – he may mouth such words but I cannot imagine his ego could possibly believe it. He knows that the true believers think of him as the Grand Archbishop of the CO2 Malthusian Religion.
His proclamations have ensured that today more people suffer and many will die – and well he knows it.
Dr Spencer also added that he thinks when all the science is in, that a little warming will be a good thing for mankind, and that additional CO2 will also benefit the planet as a whole.
Funny how the science is now agreeing with what I have said all along.
when the BoM in aus do this..they call it ‘Housekeeping”
I call it fraud.
I can’t believe he would dare to touch the historical record but not only does he do it with impunity and without explanation, he doesn’t even get in trouble. Then he fiddles his robots.txt file to prevent archiving. That should be enough to bounce his sanctimonious ass out of NASA.
I’m going to borrow from Edwin Edwards here and assert a principle: Nobody in the government who advocates for more government will get fired unless they get caught in bed with a dead girl or a live boy.
You are leaving out “Equal Rights” for Female members of Government! You need to change the gender on the last line. But that leaves out the members representing the Other genders we may have representing us and that means you need to delete everything after “Fired! 😉
You are showing computer model outputs. The end results are controlled by the AlGoreRhythm they used to “Process” the Model results they get from NOAA. To make it a bit clearer, GISS is consuming and Regurgitating what NOAA defecates.
They can never get the same results from their model runs and their AlGoreRhythm tends to cool the past and warm the present, with Prejudice.
Even if they attempted to run the same figures through two different times they would not get the same results. That is why they claim the results are “Consistent With”.
Here is the “Money Quote”
Q. If SATs cannot be measured, how are SAT maps created ?
A. This can only be done with the help of computer models, the same models that are used to create the daily weather forecasts. We may start out the model with the few observed data that are available and fill in the rest with guesses (also called extrapolations) and then let the model run long enough so that the initial guesses no longer matter, but not too long in order to avoid that the inaccuracies of the model become relevant. This may be done starting from conditions from many years, so that the average (called a ‘climatology’) hopefully represents a typical map for the particular month or day of the year.
From here:
http://data.giss.nasa.gov/gistemp/abs_temp.html
‘Hoping’ + ‘guessing’ = ‘Settled science’
Gator:
Spell check! HOPPING! 😉
Also, they no longer GUESS they Fetch from their Nether Region!
I’ve noticed some fiddling of the figures by GISS. Here’s the evidence: http://endisnighnot.blogspot.co.uk/2012/03/giss-strange-anomalies.html
Note how the past is made colder in order to generate a spurious warming trend.
Since I wrote the blog above, Iceland’s 1900 temperature has ‘fallen’ by another 0.2C.