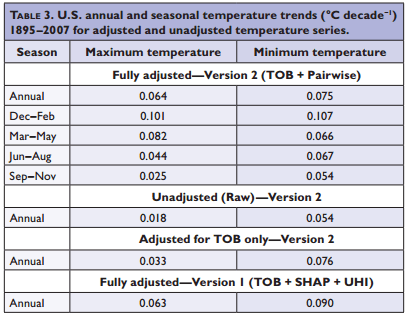
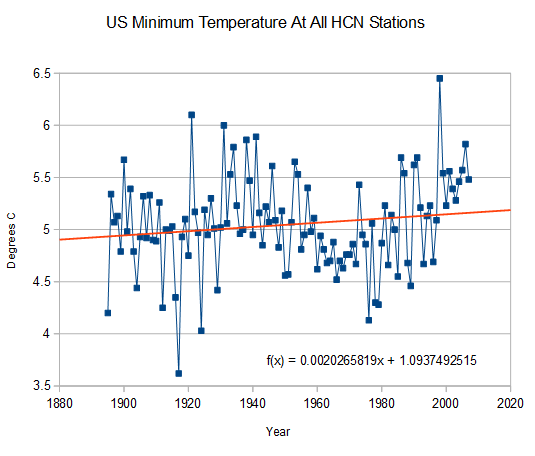
NOAA claims that the raw US minimum temperature trend from 1895-2007 is 0.054/C per decade
ftp://ftp.ncdc.noaa.gov/pub/data/ushcn/v2/monthly/menne-etal2009.pdf
This is complete BS. The actual 1895-2007 raw minimum trend is 0.020/C per decade. Whatever they are using for “raw” is not the raw data.
They then adjust tamper the trend to 0.90C/data, which means that they have increased the trend to 450% of its measured value – indicating a S/N ratio close to zero.
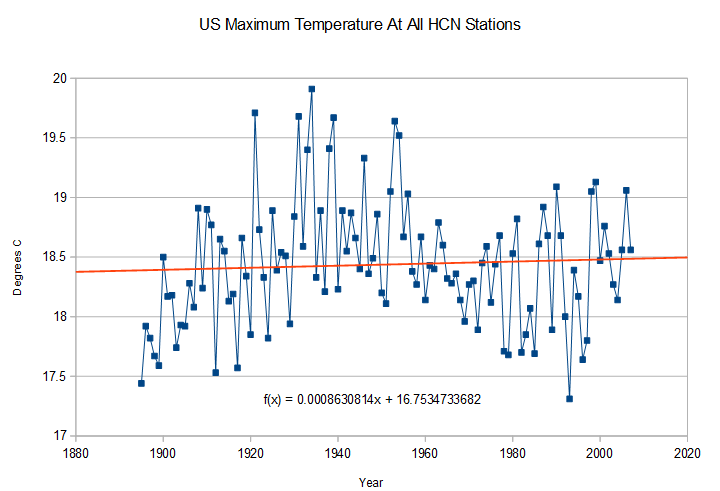
Maximum temperatures are even worse. They increase the trend to 700% of its measured value (0.009C/decade.)
No legitimate scientist would release complete crap like this, which is why NOAA does release it – without any warnings.


I’m sure matayaya could explain the justification for 700% increases, just pull his string, or offer a cracker.
We are all going to die! Unless we pay $1 trillion a year to the data fudgers.
How can you have raw data ‘Version 2’?
So………..if you correct the minimum temperature for UHI; where would the world temperature now? The current trend of .02C/Decade in insignificant; and when corrected for UHI becomes the joke that the alarmists must carry with them when others learn the truth. Soon the world’s temperatures will be falling and the alarmists will not have enough corrections up their sleeves to cover their crimes.
You beat me to it!
Crap, I was just thinking about that today while driving home from work. If UHI is well understood (of course it is; isn’t the science settled?) than adjustments of the past should logically be adjusted up; or present measurements adjusted down. Say in 1930 a temperature measurement station was surrounded by grass; maybe located in a suburban meadow; but over time the locale underwent development and eventually structures were built, and now the temperature station is surrounded by buildings, air-conditioning heat exhausts, and is no longer in a meadow, but is in a parking lot!
So we adjust the past down, and the present up. What?!?
Who is in charge of this stuff? I must be missing something.
The other issue that doesn’t make sense. Modern measurement equipment is highly accurate. There’s no reason to be making adjustments to late series data. Yet they’re making as many upward adjustments in current data as they’re making downward from 50 years ago.
That, and in my field of research, adjusting the data for any reason will get you a new career flipping hamburgers quickly. If you think there’s an inaccuracy, you explain it, not adjust it away and say nothing about it. What passes for climate research is abysmal.
Studies have shown that the UHI effect acts like concentric domes of heat, the closer to the center of urban sprawl one travels, the higher the temperature. So even ‘well cited’ stations are going to be effected by the surrounding infrastructure. Cities and the surrounding suburbs of today are Urban Heat Continents compared to what we had in the 1930’s.
Accuracy aside, I would like to know how the NOAA was able to achieve precision to three significant figures!