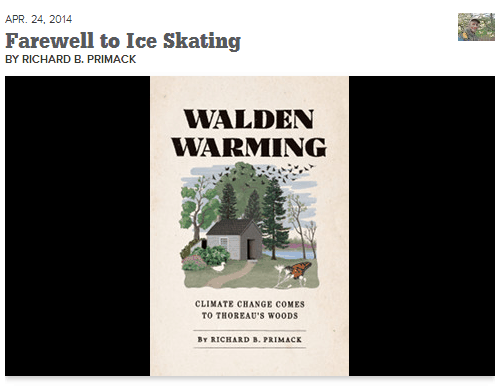
New England is having the coldest start to the year since 1940, the Great Lakes have record ice, and some genius publishes a book saying that ice is a thing of the past.
Disrupting the Borg is expensive and time consuming!
Google Search
-
Recent Posts
- “Why Do You Resist?”
- Climate Attribution Model
- Fact Checking NASA
- Fact Checking Grok
- Fact Checking The New York Times
- New Visitech Features
- Ice-Free Arctic By 2014
- Debt-Free US Treasury Forecast
- Analyzing Big City Crime (Part 2)
- Analyzing Big City Crime
- UK Migration Caused By Global Warming
- Climate Attribution In Greece
- “Brown: ’50 days to save world'”
- The Catastrophic Influence of Bovine Methane Emissions on Extraterrestrial Climate Patterns
- Posting On X
- Seventeen Years Of Fun
- The Importance Of Good Tools
- Temperature Shifts At Blue Hill, MA
- CO2²
- Time Of Observation Bias
- Climate Scamming For Profit
- Climate Scamming For Profit
- Back To The Future
- “records going back to 1961”
- Analyzing Rainfall At Asheville
Recent Comments
- Bob G on Fact Checking NASA
- arn on Climate Attribution Model
- Bob G on Climate Attribution Model
- Bob G on Climate Attribution Model
- Bob G on “Why Do You Resist?”
- Gerald Machnee on Fact Checking The New York Times
- Gerald Machnee on Climate Attribution Model
- Gerald Machnee on “Why Do You Resist?”
- arn on Climate Attribution Model
- arn on Climate Attribution Model


From the GWPF
http://cnsnews.com/news/article/barbara-hollingsworth/alaskan-polar-bears-threatened-too-much-spring-ice-0
“Alaskan Polar Bears Threatened…By Too Much Spring Ice”
I’m starting to think that Goldilocks was a poley bear.
Makes the Bell Curve understandable. To bad if you are on the wrong end. Ice may come as a real surprise and snow will just be another Hot sauce.
http://www.bluehill.org/climate/date_pndh.gif
Here is over 100years of freeze thaw data for Houghton pond south and east of concord
This year the days ice has been on the pond is over the 120 year mean. Remarkable graph showing relative stability in climate.
As I posted earlier in reference to posts by bob maginnis it can be difficult to distinguish between genius and idiot (savant) … sometimes, it appears, not so much judging by the evidence shown/linked to in this OP …