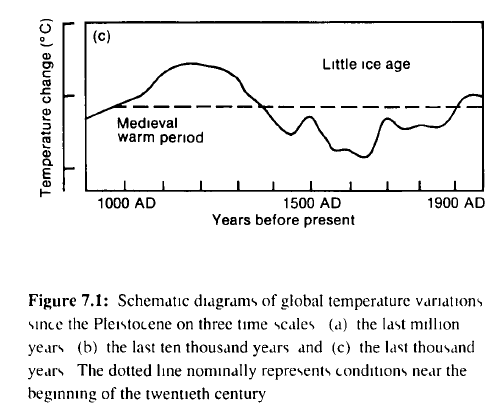
Climate experts say that they know Earth’s temperature to either 0.01 degrees or 0.001 degrees. But as of 1990 they were somehow unaware that Earth had been heating out of control for the past century.
Disrupting the Borg is expensive and time consuming!
Google Search
-
Recent Posts
- Analyzing The Western Water Crisis
- Gaslighting 1924
- “Why Do You Resist?”
- Climate Attribution Model
- Fact Checking NASA
- Fact Checking Grok
- Fact Checking The New York Times
- New Visitech Features
- Ice-Free Arctic By 2014
- Debt-Free US Treasury Forecast
- Analyzing Big City Crime (Part 2)
- Analyzing Big City Crime
- UK Migration Caused By Global Warming
- Climate Attribution In Greece
- “Brown: ’50 days to save world'”
- The Catastrophic Influence of Bovine Methane Emissions on Extraterrestrial Climate Patterns
- Posting On X
- Seventeen Years Of Fun
- The Importance Of Good Tools
- Temperature Shifts At Blue Hill, MA
- CO2²
- Time Of Observation Bias
- Climate Scamming For Profit
- Climate Scamming For Profit
- Back To The Future
Recent Comments
- Bob G on Analyzing The Western Water Crisis
- Bob G on Analyzing The Western Water Crisis
- Bob G on Analyzing The Western Water Crisis
- arn on Analyzing The Western Water Crisis
- Scott Allen on Analyzing The Western Water Crisis
- conrad ziefle on Analyzing The Western Water Crisis
- conrad ziefle on Analyzing The Western Water Crisis
- Bob G on Analyzing The Western Water Crisis
- Bob G on Analyzing The Western Water Crisis
- Bob G on Gaslighting 1924


They also do those precise measurements to +/- 0 uncertainty. If there was any, they would report it, wouldn’t they?
Not only that, it’s the very same measurements that were represented in that 1990 graph and the new, radically different but super accurate graphs. The raw data didn’t change, but the technology for computing averages is far more sophisticated now.
Addendum: well, it’s the same measurements for the right-hand end of the graph. The left-hand part of the graph is guesstimated from “proxies” and things like crop records. The Six’s Registering (min-max) Thermometer didn’t come along until the late 18th century.
The Six’s Registering (min-max) Thermometer was invented by Englishman James Six in 1782. (WIKI) so it has been around and in use for over 200 years. That is why the Tobs adjustment is rather questionable.
The Precision may be +/- 0.01 but the accuracy is =/- 2 °C
Gail, don’t confuse them with facts.
For their side it’s all about good wishes. Sadly good wishes are not for the human race, it’s for some odd deity.
nicely put
”
The awkwardness of such claims is obscured because the concept of averaging is so routine. In fact it is so pervasive that it may even seem implausible to mount a critique. But it should only be routine where it makes sense. Personal income and height are meaningful at the individual level, and no conceptual problems emerge when adding or averaging over a population. But there are certainly examples where averaging or adding destroys the meaning of a variable. In economics, for example, an exchange rate is meaningful when comparing two currencies, but the ideas of a “global exchange rate” or a sum over exchange rates are both nonsensical. Regardless of the fact that enough data exist to compute something analogous to a “global temperature” for the money markets, neither the level nor the trend in such a statistic would provide any meaningful information about the global economy. Another example: Individual telephone numbers are both meaningful and useful, while the sum or average over telephone numbers in a directory have no meaning.”
http://www.uoguelph.ca/~rmckitri/research/globaltemp/GlobTemp.JNET.pdf
As the temperatures globally have been rising since the last glaciation I can not see what the problem has been. We are in an interglacial period and as such the world should get warmer, unfortunately as your graph shows the MWP was the last time it got real warm. Hopefully it will get warmer but it will not be because of any amount of CO2 that causes it.
As reported on Paul Homewood site Jørgen Peder Steffensen is Associate Professor at the University of Copenhagen and one of the world’s leading experts on ice cores. Using ice cores from sites in Greenland, he has been able to reconstruct temperatures there for the last 10000 years. As good Professor says –
He also points out –
»Temperatures in Greenland were about 1.5 C warmer 1000 years ago than now.
»It was perhaps 2.5 C warmer 4000 years ago.
»The period around 1875, at the lowest point of the Little Ice Age, marked the coldest point in the last 10,000 years.
»Other evidence from elsewhere in the Northern Hemisphere confirms this picture.
http://notalotofpeopleknowthat.wordpress.com/2014/04/04/the-little-ice-age-was-the-coldest-period-for-10000-years/
Yes, the measurement error of the various temperature series pretty much exclude each others results as valid measurements.