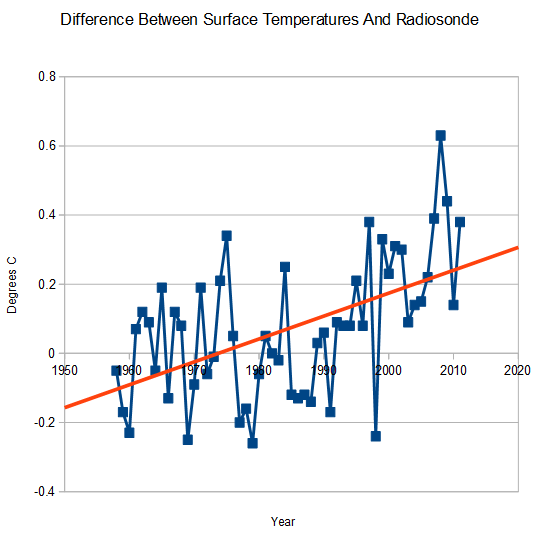
Global warming theory says that the mid-troposphere must warm faster than the surface, but in fact it does the exact opposite. NOAA radiosonde data shows almost no warming over the last 50 years at 850-300 MB. The surface data does show warming however, indicating that almost all of the measured warming is due to UHI effects. The graph below shows the divergence, which would be a negative slope if it was due to CO2 warming.
http://cdiac.ornl.gov/ftp/trends/temp/angell_54/global.txt
In other words, the entire global warming scam is the worst junk science in history, run by scoundrels who ignore their own rules.


Original Message
Man made CO2 has become so evil it even denies physics now. 🙂
GISS is located on the upper west side, not mid-town. Not to ruin your word play or anything….
The thermometer station is fenced in behind the popular castle on a hill in Central Park:
https://c1.staticflickr.com/3/2614/4047517899_3f82f8ba53_z.jpg
It used to be on the castle tower. This location is such that neither the anti-fracking Upper West Side or Republican Upper East side can lay claim to it, but it’s certainly not Midtown. Nor is GISS in the UWS proper, but just above it in Morningside Heights, an area dominated and mostly owned by Columbia University that literally forms a cliff over parts of Harlem.
Scoundrels. Great word, under used.
That is why it is a great word, the media hasn’t flogged it to death.
I love this line of argument. They are yet again, hoist with their own petard. CAGW has no leg left to stand on at all. We can’t expect a white flag though as their livelihood depends on continuing the falsehood.
Because there are millions of measurements of the mid troposphere the observations really crush the hypothesis of AGW.
Gippsland Victoria is experiencing a day without fossil fuel generated energy.
Iceboxes are melting down catastrophically.
http://m.heraldsun.com.au/news/victoria/explosion-near-morwell-terminal-station-in-gippsland/story-fni0fit3-1226874248436
Blunt confirmation of this is found in the near perfect micro-correlation between Central Park in the city and rural West Point Acadamy up the Hudson River, except that Central Park has a slope:
http://noconsensus.files.wordpress.com/2009/11/newyork_usa_large1.gif
[Reference: http://noconsensus.wordpress.com/2009/11/25/triplets-on-the-hudson-river/ ]
That chart correlates wonderfully with the development history of Manhattan.
Very neat. What is that jump about 1890ish where the two lines separate so quickly? Is that maybe when coal fired steam heat was widely introduced? Was there any technology introduced that might account for that jump?
In Manhattan, development spread northward from the original Dutch settlement at the southern tip where the financial district is now. The sudden divergence represents the point when development reached around the area of Central park where the thermometer is located.
I think the summary sentence should read, “The surface data does show warming however, indicating that almost all of the measured warming is spurious, i.e. due to UHI effects on poorly-sited temperature measuring stations (so what real warming there is, is local UHI, not global).” As I have said for almost 3 and 1/2 years now, on the global scale the utterly stable Standard Atmosphere rules, as my Venus/Earth atmospheric temperatures comparison proved that long ago.
When it comes to UHI, I always refer to a blog article that Steve McIntyre did on a paper by Tom Peterson. http://climateaudit.org/2007/08/04/1859/ It clearly showed the influence UHI has on the land temperature record. The Peterson paper was totally refuted, but guess what………………it’s the paper NOAA uses to justify not correcting the temperature record for UHI.
Reblogged this on Climatism.
Is that the ‘G’ spot? 😉
Strangely enough, the mid-troposphere warming is what you would get in a real greenhouse if there was a sheet of glass (or any other obstruction) preventing warm, moist air from rising and circulating. I’ve had a nagging suspicion for some years that GCM’s include some artefact that discourages a Carnot engine style of circulation. In other words, they modelled the greenhouse effect, with a greenhouse.
Ask the question, what altitude is the tropopause? The answer: whatever altitude it needs to be.
Warm moist air keeps rising until the energy is lost, it cannot be otherwise.