
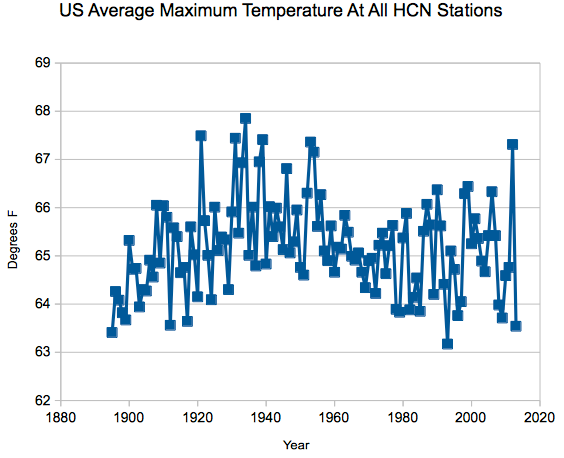
A minor detail which NOAA and NASA forgot to mention to the public, is that US afternoon temperatures in 2013 were third coldest on record.
A minor detail which NOAA and NASA forgot to mention to the public, is that US afternoon temperatures in 2013 were third coldest on record.

Why is a “science” blog still flogging the”my neighborhood weather is global” nonsense.
If you think that 120 years of data from the best temperature data set in the world is trivial, then you are not intelligent enough to participate in this discussion.
It’s not, but you would be on your roof top screaming the earth is ending when we have a hot summer. Right?
Well that’s exactly what they did in 2012…..
Isn’t it amazing that global warming has somehow missed America, the source of everything evil? How coincidental!
We are carriers. And immune. 😉
Steven, you must be doing the right stuff as you are drawing the nutso gorebull warming spammers.
I am always grateful for your graphs here and talk about it at my own place. And I am a ‘liberal’, by the way, but not insane like so many seem to be these days. Sigh.
Anyways, thank you for the hard data.
The night time temperatures were not too hot either.
I see a sinusoidal multi-decadal pattern in the graph.
Yup, goes up for a while then down for a while. Rinse and repeat.