Out in the desert Southwest, our March and April were below normal temps. My tomatoes plants are only 8″ tall. In previous years they would be at least 2′ tall by now.
Had to replant my bush beans last week due to frost that hasn’t hit this late in my memory. It’s May 3 and I still have trees not fully leafed out. That hasn’t happened in my memory either. April 1 -15 is the historical greening in my little corner.
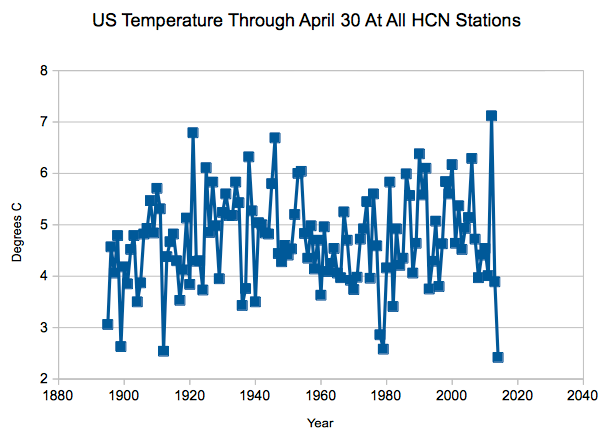
This graph shows us going from the hottest to the coldest temperatures “on record” within just a fraction of one year Does this make sense to anyone, or how is it explained?


How the tide has turned since 2012!
2012 was climate. 2014 is weather which needs to be altered. Thermometers aren’t as reliable as they were in 2012.
Like it!
Thanks.
Reblogged this on CraigM350.
January- April temperatures in the US are currently cooling by 250C / century!
If this trend continues………
We are still running almost 20 degrees below average in my little bit of Heaven.
Out in the desert Southwest, our March and April were below normal temps. My tomatoes plants are only 8″ tall. In previous years they would be at least 2′ tall by now.
Had to replant my bush beans last week due to frost that hasn’t hit this late in my memory. It’s May 3 and I still have trees not fully leafed out. That hasn’t happened in my memory either. April 1 -15 is the historical greening in my little corner.
This graph shows us going from the hottest to the coldest temperatures “on record” within just a fraction of one year Does this make sense to anyone, or how is it explained?
The increments on the x-axis are one year.