
Disrupting the Borg is expensive and time consuming!

Google Search
-
Recent Posts
- El Nino To The Rescue
- Bullseye!
- It’s Getting Closer
- Greenland Meltdown Scam
- Greenland Ice Update
- Wyoming Gold
- Three Years Since The Apocalypse
- Arctic Report card Summer 2026
- Elon Pushing Pushing Geoengineering
- Earth, Wind And Fire
- On The Road Again
- Vandalism At The Reflecting Pool
- Fifty Years Ago Today
- Truth Or Consequences
- US Climate Trend Maps
- Declining Spring Snow Cover In Northern New Mexico
- You Can’t Fool Mother Nature
- Cattle And The Climate
- One Atomic Bomb Per Hour
- New Video : Analyzing Oil And Gas
- Is Antarctica Melting?
- High Speed Analysis And Visualization
- El Nino To The Rescue?
- Fake News Update
- Growth Of Antarctic Sea Ice
Recent Comments
- Terry Shipman on El Nino To The Rescue
- Bob G on El Nino To The Rescue
- Jack the Insider on El Nino To The Rescue
- Bob G on El Nino To The Rescue
- conrad ziefle on El Nino To The Rescue
- conrad ziefle on El Nino To The Rescue
- arn on El Nino To The Rescue
- Bob G on El Nino To The Rescue
- conrad ziefle on El Nino To The Rescue
- Francis Barnett on El Nino To The Rescue
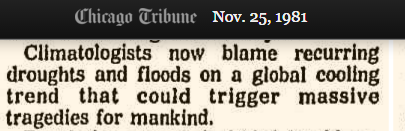
1981 – Climatologists Blamed Droughts , Floods And Massive Tragedies On Global Cooling

This entry was posted in Uncategorized. Bookmark the permalink.
Here is another interesting article claiming 3.5°F drop from 1930 to 1983 in IL, after a 5.5° increase from 1850 to 1930:
http://archives.chicagotribune.com/1984/04/23/page/1/article/cold-facts-suggest-a-chilling-trend
Actually not far off from what NOAA shows for Illinois.
Is that what is in NOAA’s records or what they publish and tell everyone else?