Climate scientists used to understand that the sun controlled Earth’s climate – until Michael Mann and James Hansen destroyed the temperature record about 20 years ago.
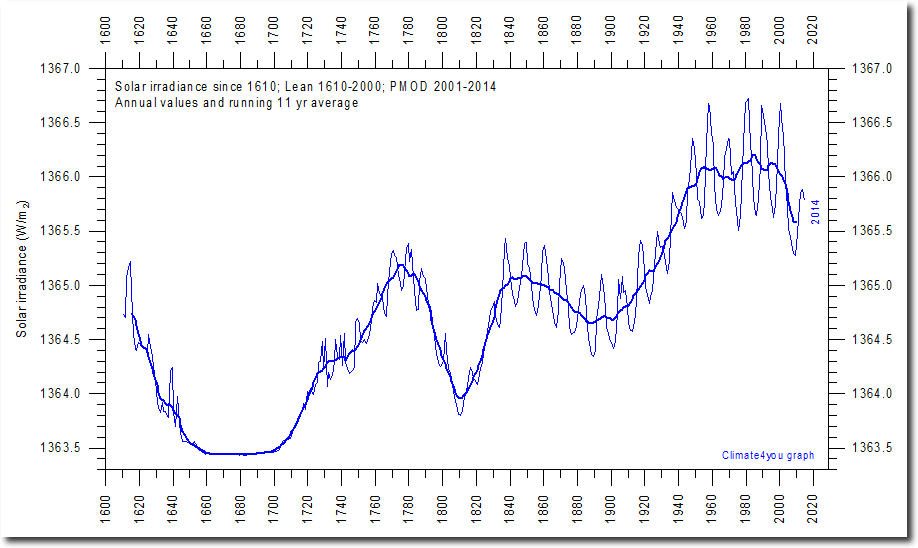
Total solar irradiance (TSI) has increased since the Little Ice Age.
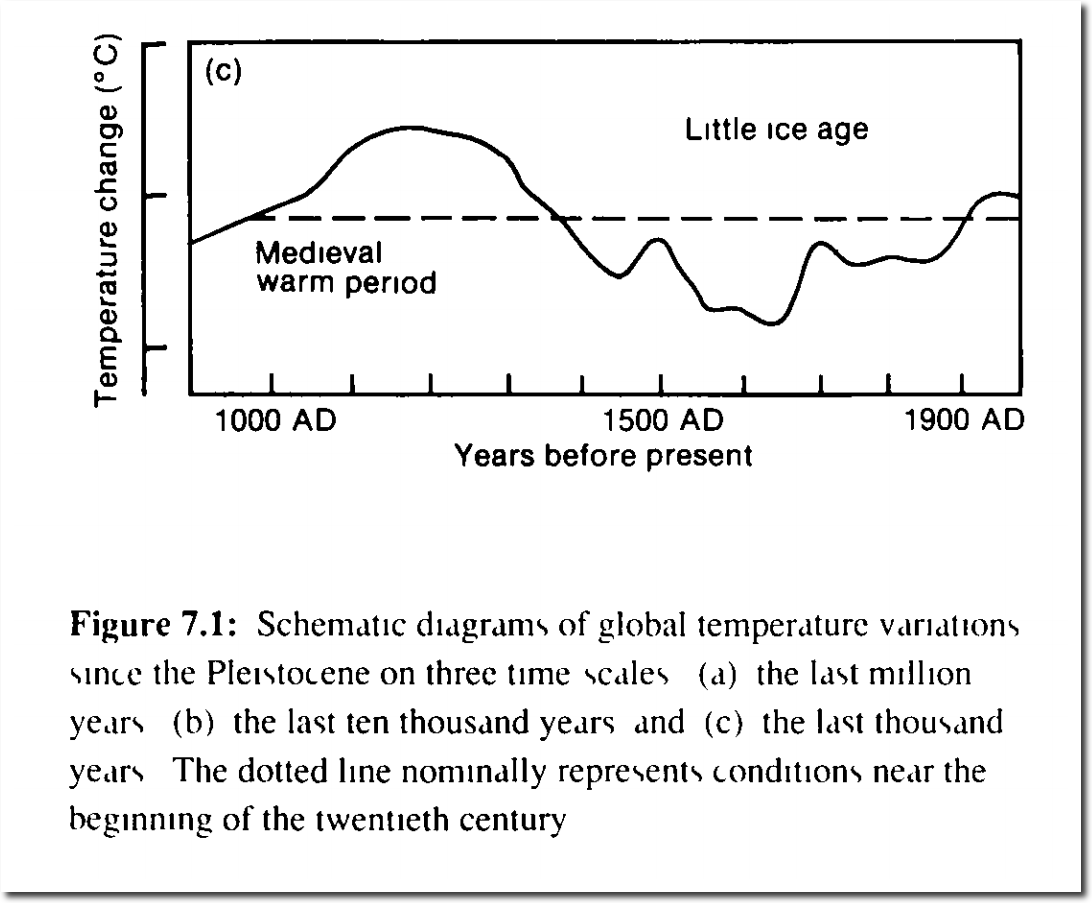
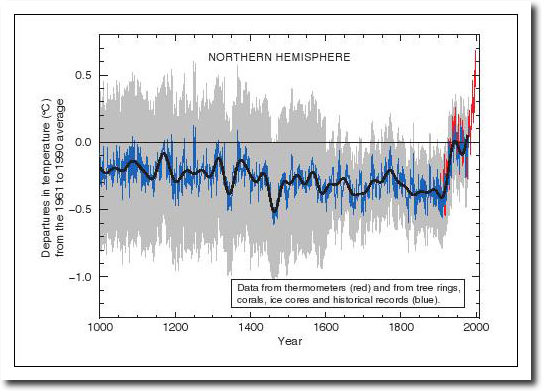
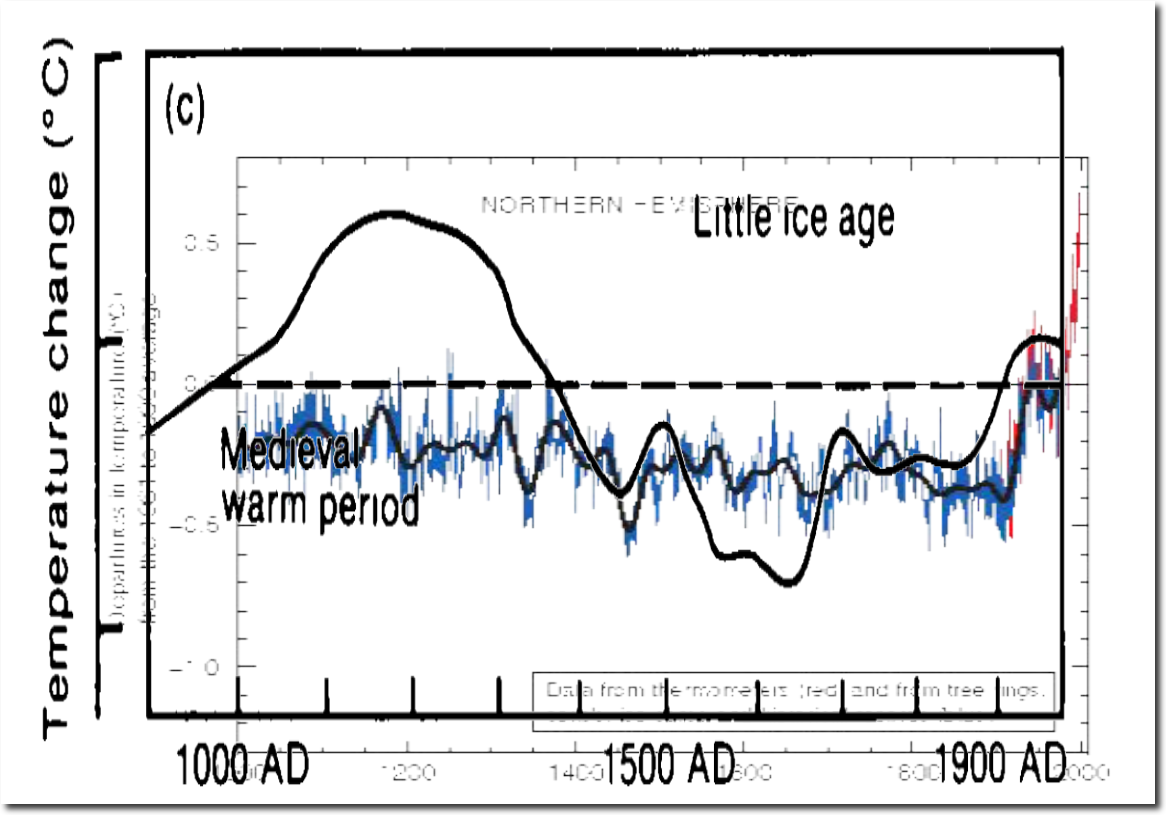
The graph below is from the 1990 IPCC report, and it shows temperatures were much warmer 900 years ago, and were much cooler 400 years ago during the Little Ice Age.
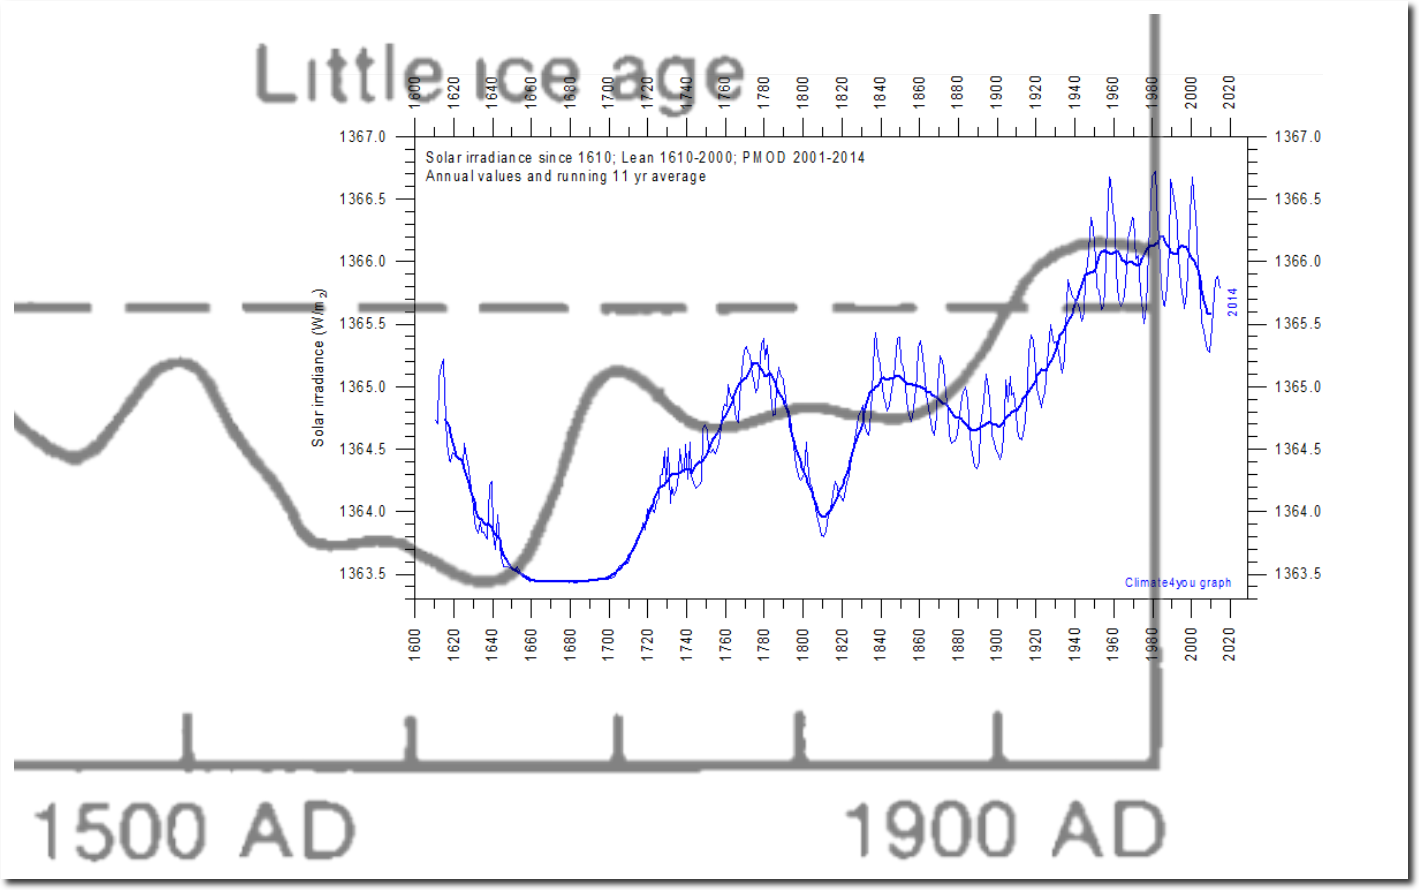
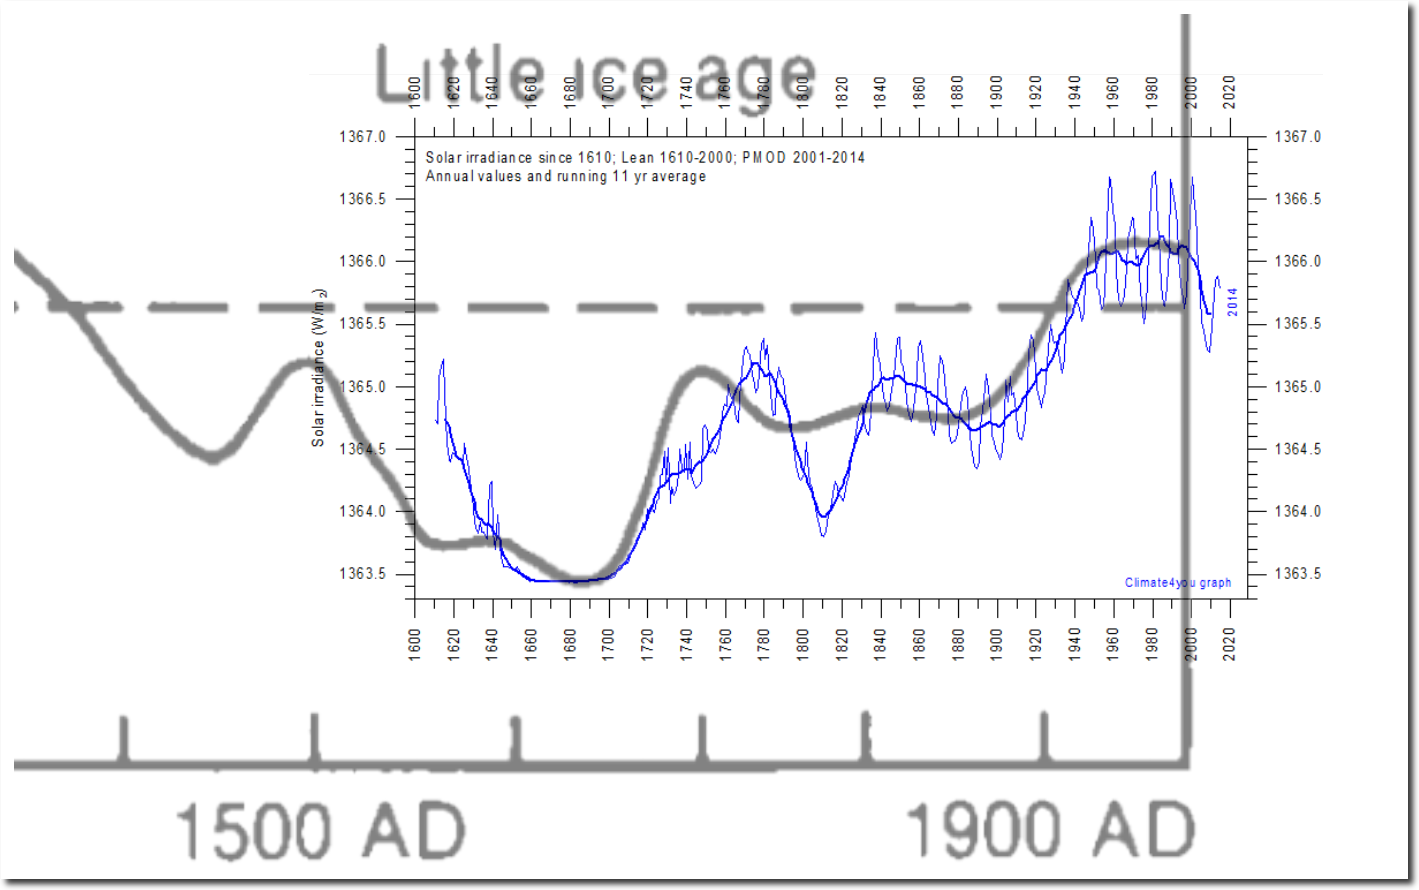
If we overlay the TSI graph and the 1990 IPCC graph, we see correlation between temperature and TSI.
The 1990 IPCC graph is hand drawn and the X-axis is irregular. A small shift and scaling change lines up TSI and temperature almost perfectly.
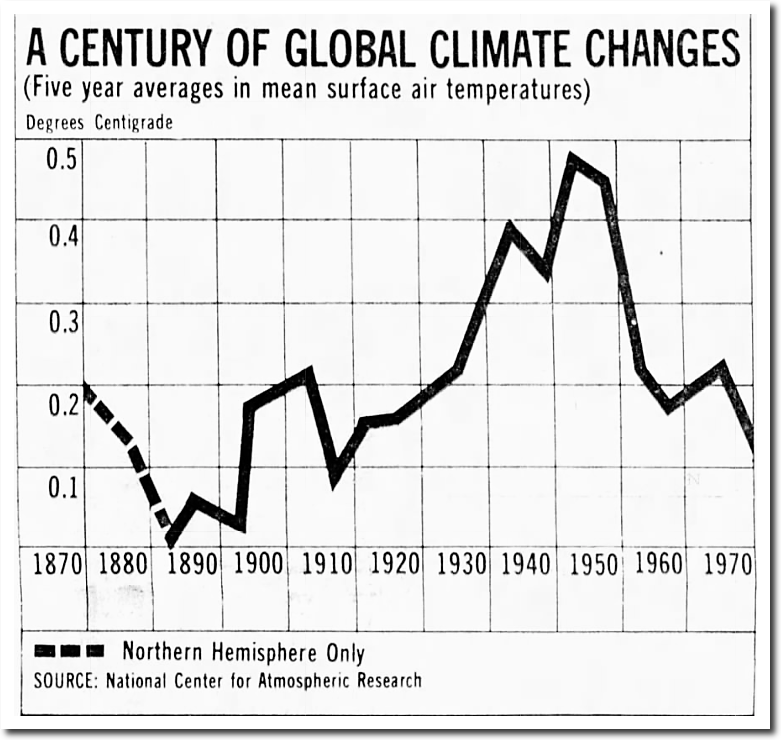
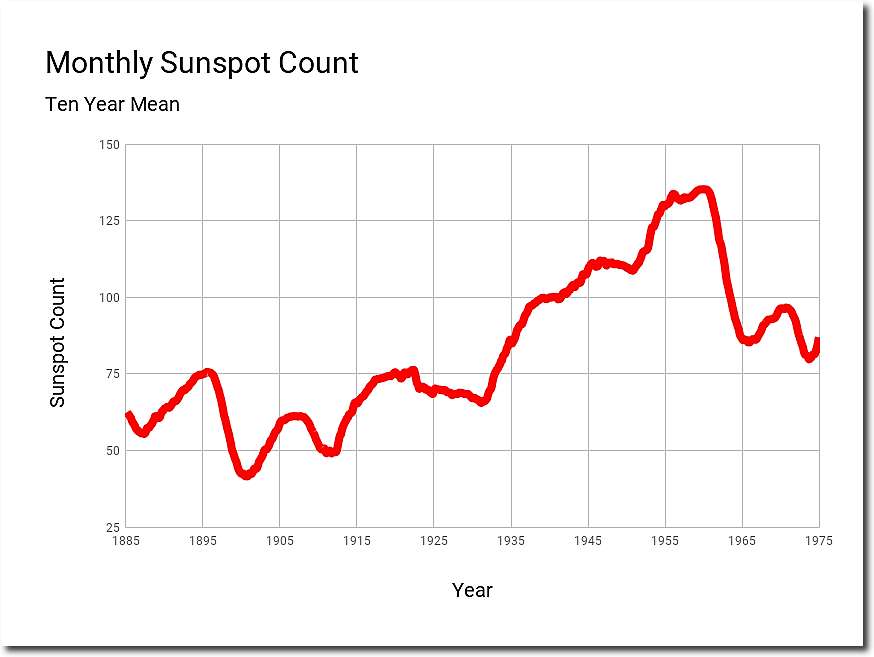
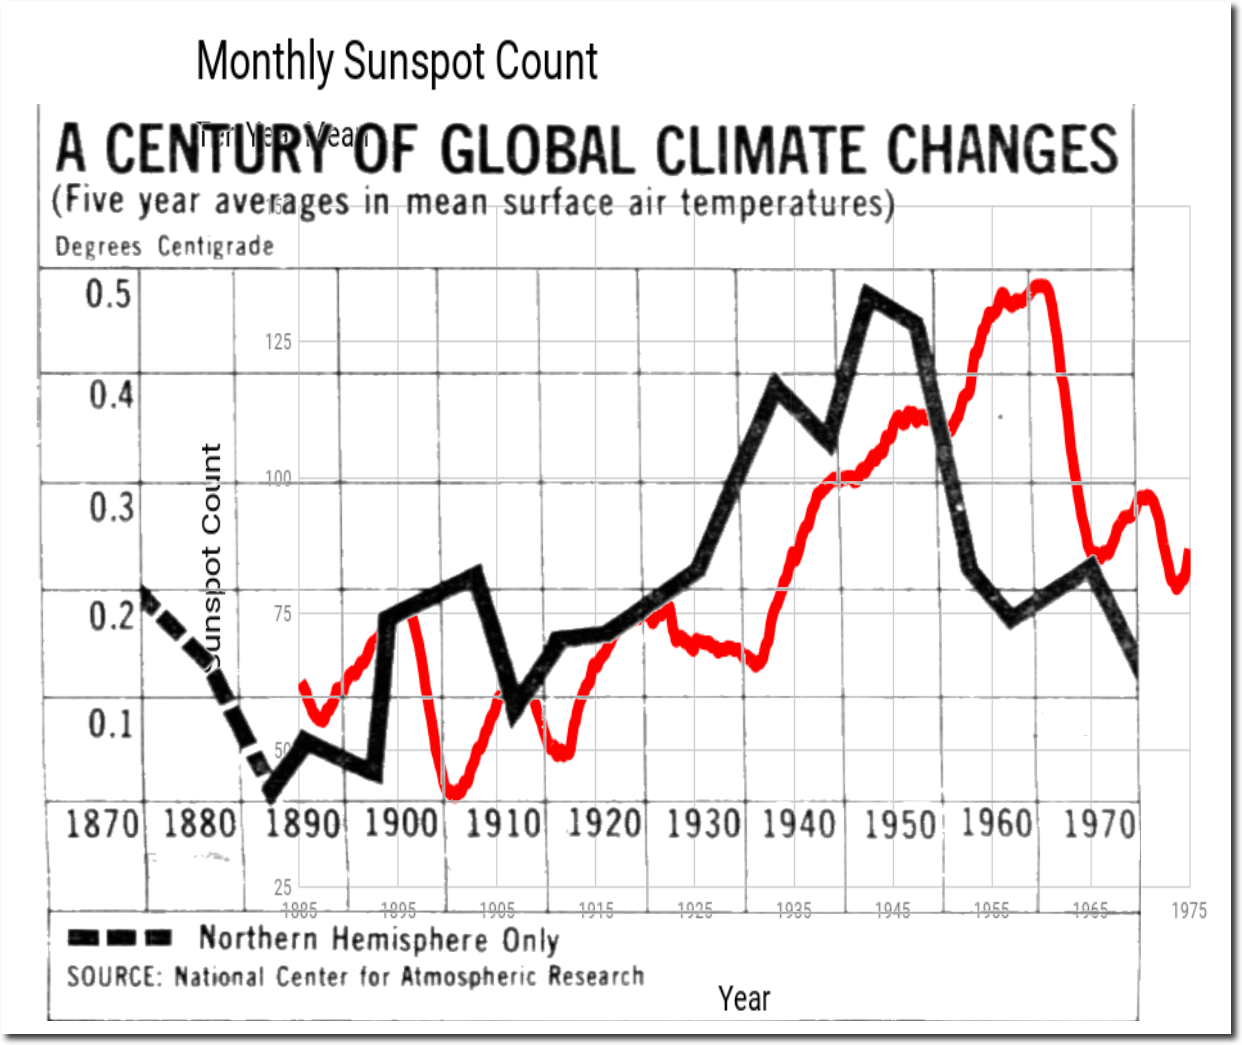
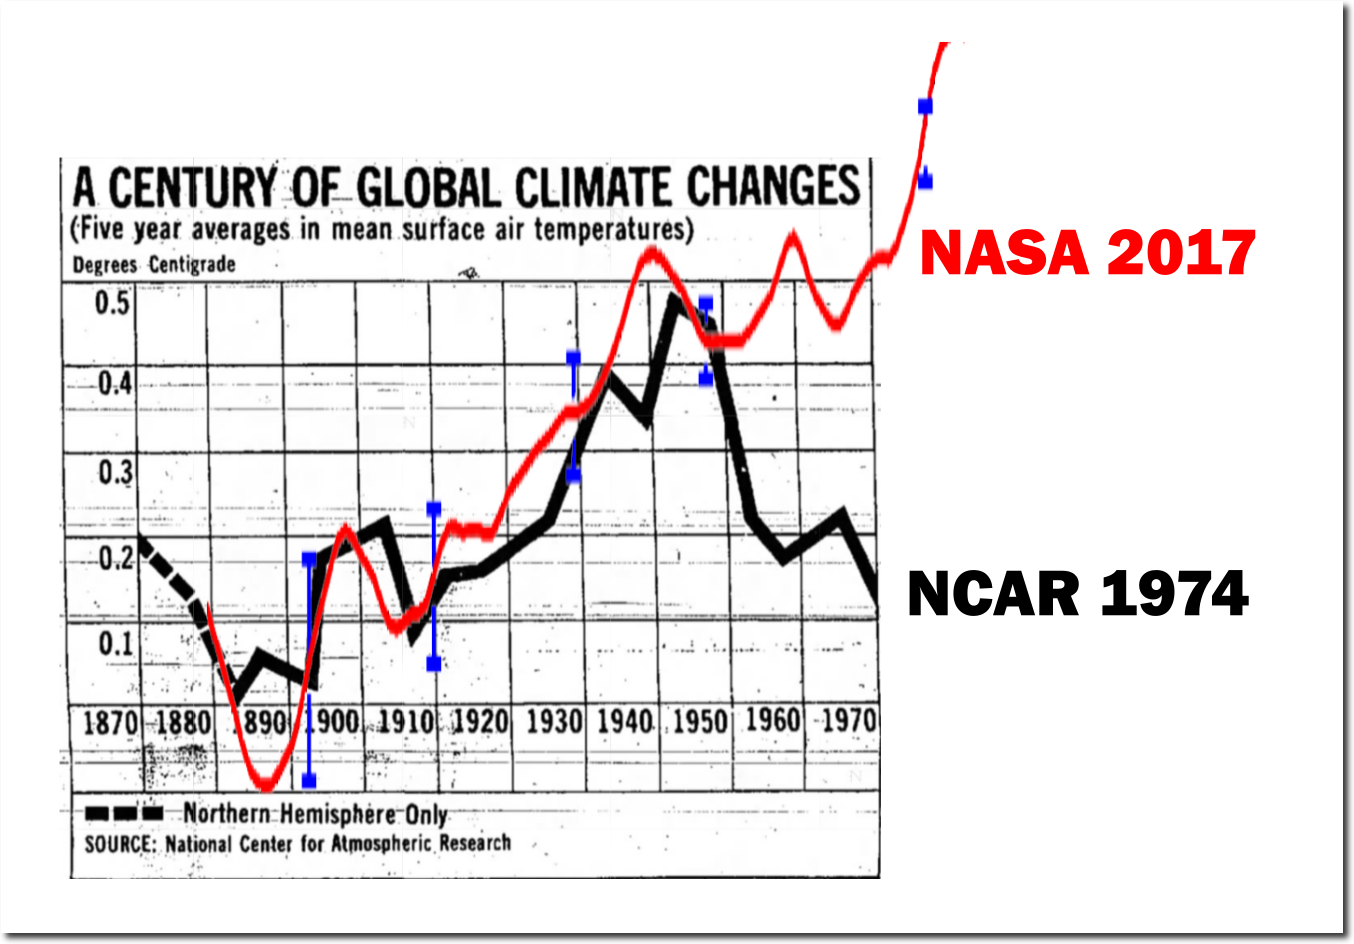
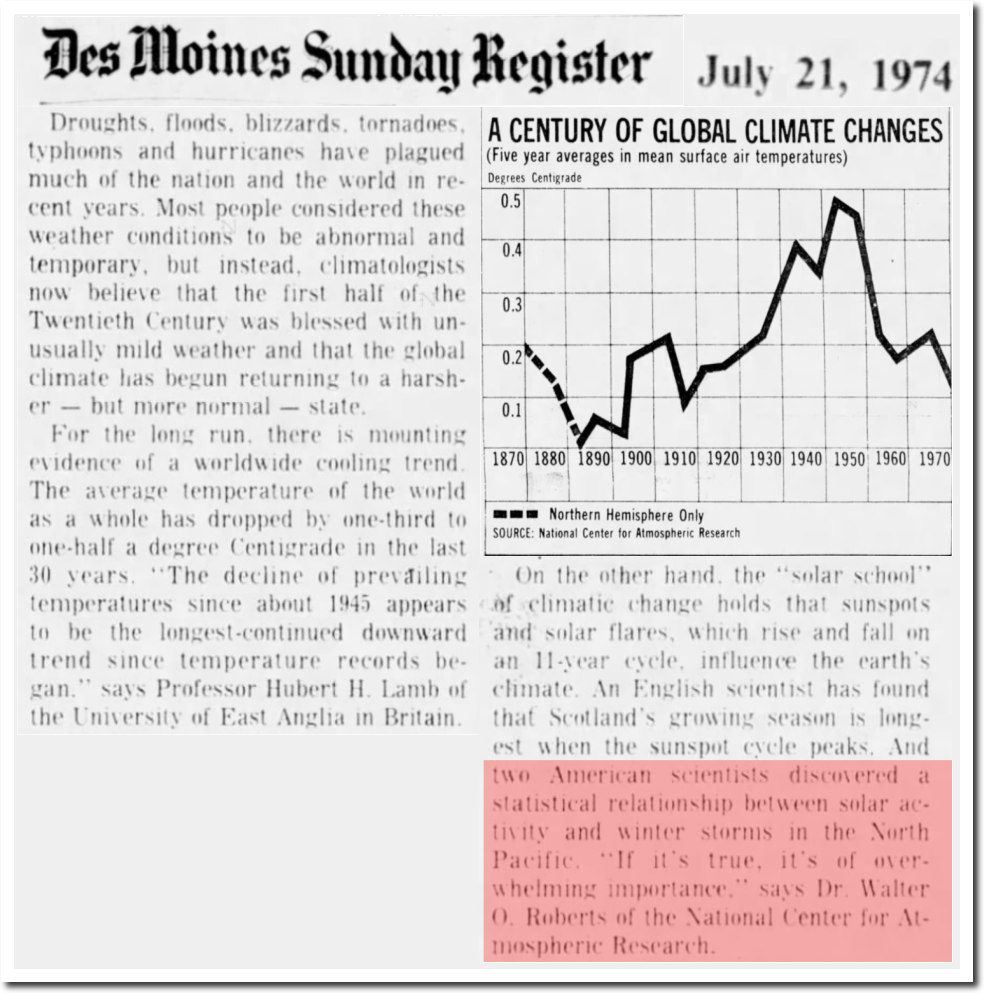
Similarly, we see a correlation between the 1974 NCAR global temperature graph and sunspots.
21 Jul 1974, 13 – The Des Moines Register at Newspapers.com
Wood for Trees: Interactive Graphs
Again, a small shift of the hand drawn 1974 graph causes sunspots and temperature to line up very closely.
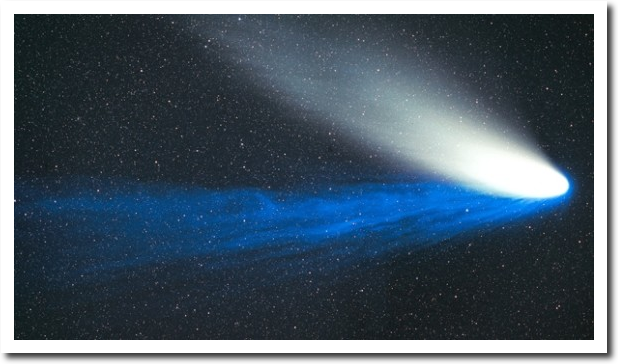
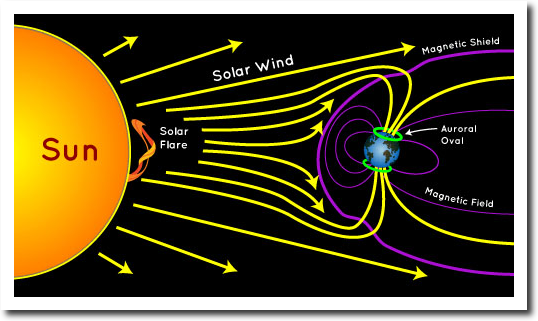
TSI and Sunspots are only part of the solar climate story. Comets have two tails because there are at least two distinct types of energy being emitted from the Sun – photons and ionized particles known as the Solar Wind.
The Earth’s magnetic field protects us from the Solar Wind – directing the charged particles towards the poles where they release energy as the Northern and Southern lights. Without the magnetic field surrounding Earth, our planet would be unlivable.
A Mighty Solar Wind May Kindle Auroras Next 3 Nights – Astro Bob
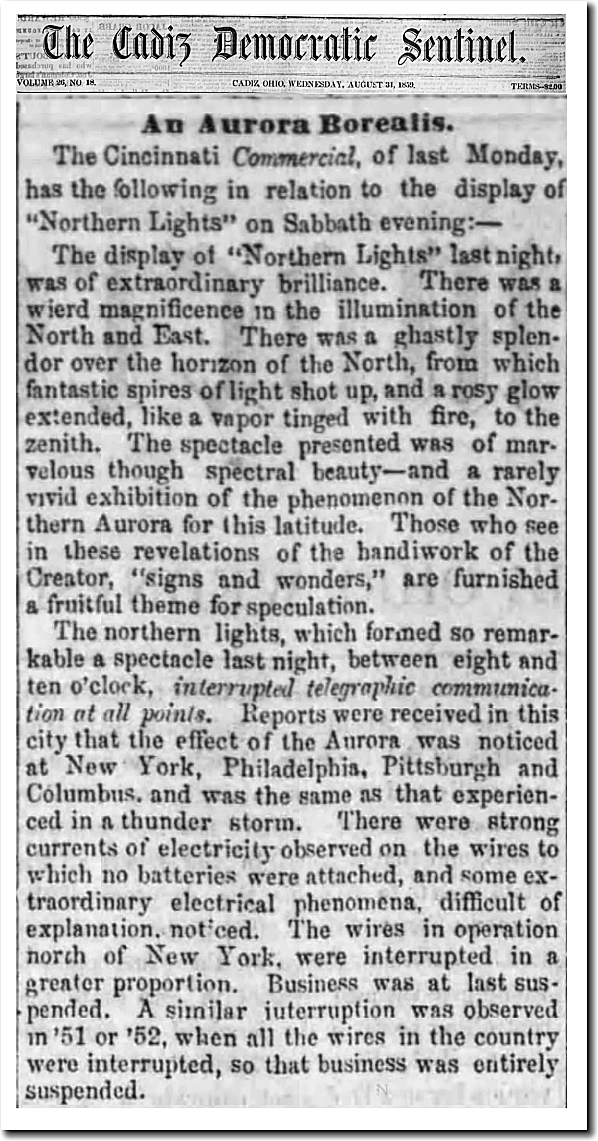
In 1859, a large solar storm brought charged particles across the entire planet, with so much energy that people all over the world could read at night, and telegraph lines carried current without any power supply.
31 Aug 1859, 1 – The Cadiz Sentinel at Newspapers.com
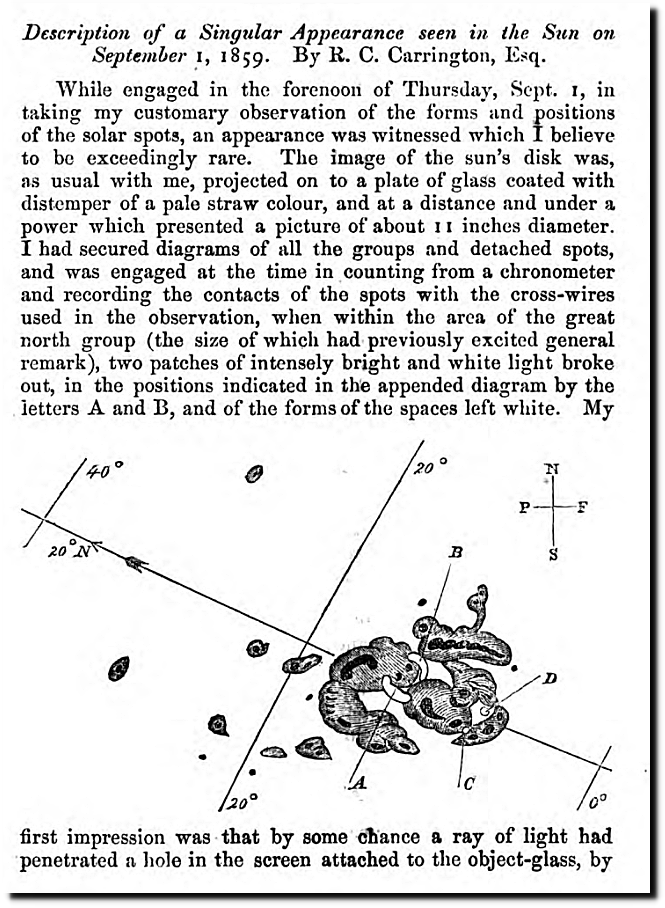
The storm came from a coronal mass ejection which was released from this sunspot group.
Carrington Richard sunspots 1859 – Solar storm of 1859 – Wikipedia
The solar wind brings a lot of very variable energy into Earth’s atmosphere, which is completely unaccounted for by climate scientists. And because the Earth’s and Sun’s magnetic fields are constantly changing, this causes weather patterns on earth to change too – leading to all sorts of superstitions like the current “climate change” cult.
The correlation between solar activity and earth’s temperature was obvious until 20 years ago when Michael Mann and James Hansen corrupted Earth’s temperature record through massive data tampering. Mann made the Medieval Warm Period and Little Ice Age disappear with his hockey stick graph.
Meanwhile Hansen made the 1940’s warmth and subsequent cooling disappear.
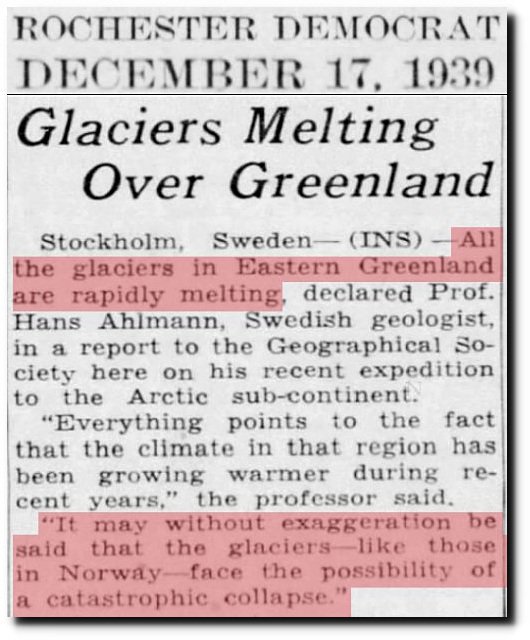
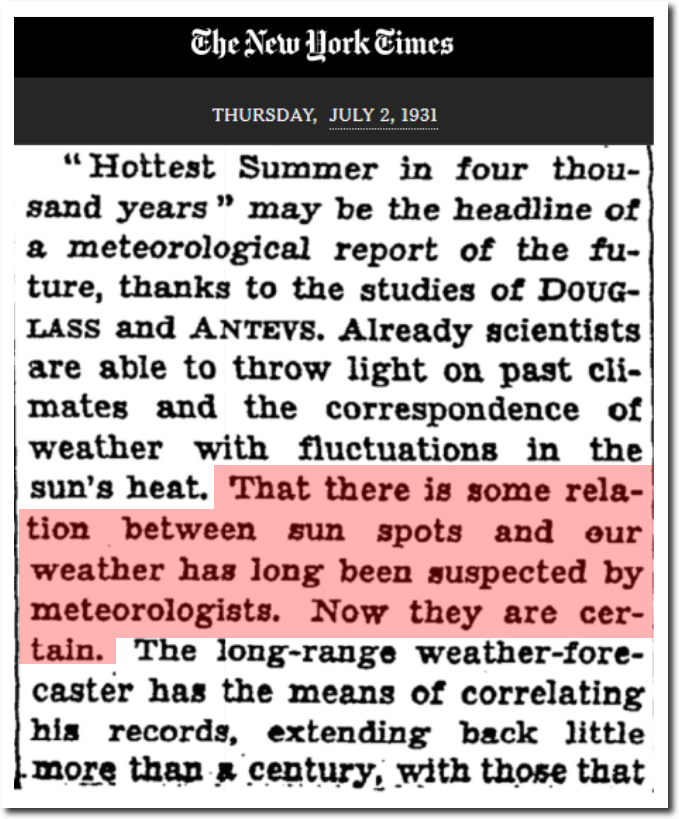
There was no question at the time that the 1930’s and 1940’s were very warm, and that the temperatures correlated with solar activity.
17 Dec 1939, Page 15 – Harrisburg Sunday Courier
13 Oct 1940, Page 76 – Hartford Courant at Newspapers.com
TimesMachine: July 2, 1931 – NYTimes.com
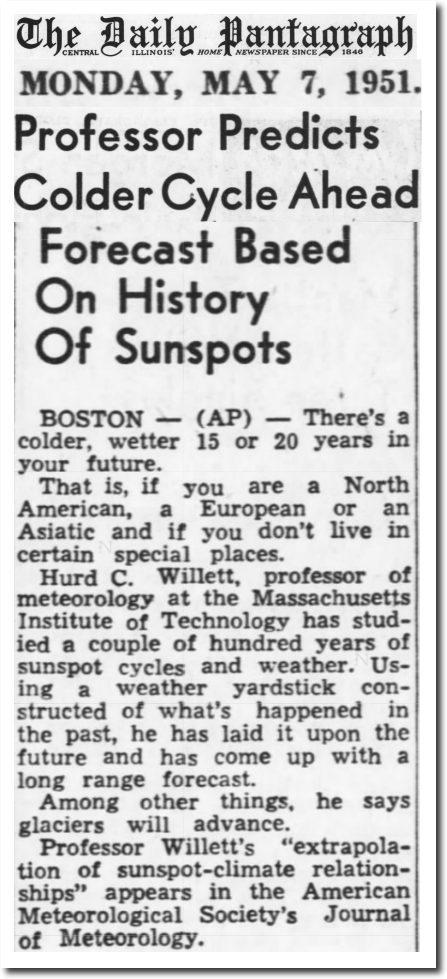
In 1951, MIT professor Hurd C. Willett correctly predicted 20 years of global cooling, based on sunspot cycles.
07 May 1951, Page 9 – The Pantagraph at Newspapers.com
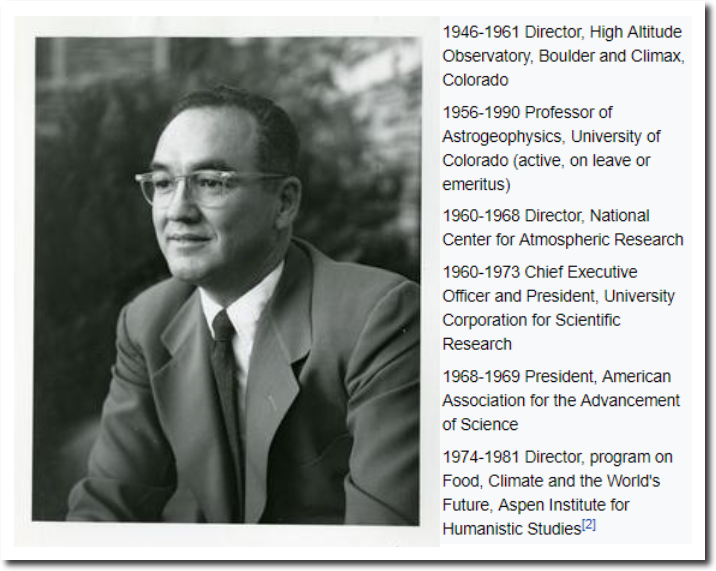
The first director of NCAR understood that sun controlled earth’s climate.
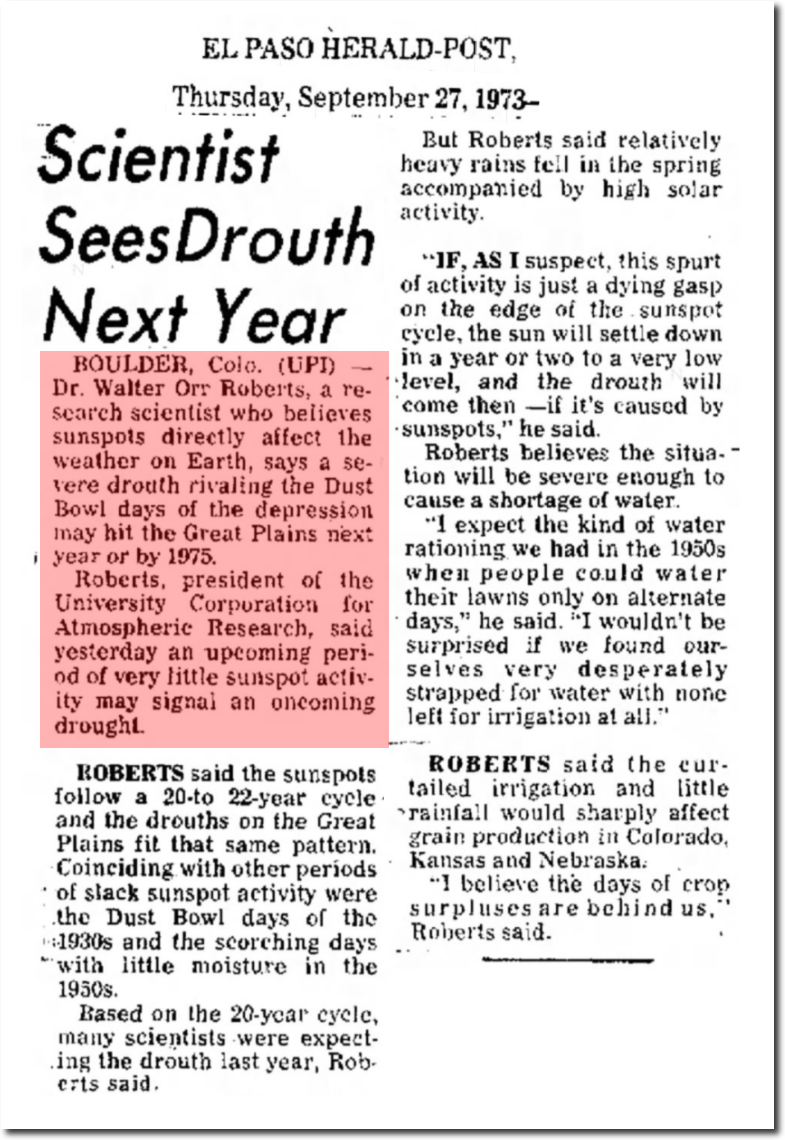
In 1973, Roberts predicted a drought based on sunspot cycles.
27 Sep 1973, Page 38 – El Paso Herald-Post at Newspapers.com
21 Jul 1974, 13 – The Des Moines Register at Newspapers.com
By destroying the temperature record, Mann and Hansen wrecked an entire field of science – and caused scientists to pursue a superstitious relationship between temperature and CO2 instead of doing actual research.

