Disrupting the Borg is expensive and time consuming!
Google Search
-
Recent Posts
- On The Road Again
- Vandalism At The Reflecting Pool
- Fifty Years Ago Today
- Truth Or Consequences
- US Climate Trend Maps
- Declining Spring Snow Cover In Northern New Mexico
- You Can’t Fool Mother Nature
- Cattle And The Climate
- One Atomic Bomb Per Hour
- New Video : Analyzing Oil And Gas
- Is Antarctica Melting?
- High Speed Analysis And Visualization
- El Nino To The Rescue?
- Fake News Update
- Growth Of Antarctic Sea Ice
- 65 Years Of Progress!
- El Nino To The Rescue?
- Worst March Drought On Record
- ChartGL Process Control Demo
- The Biggest Money Laundering Scam
- Drought In The Headwaters Of Lake Powell
- Unrealistic Expectations Of Water Availability
- Did Bill Gates Do This?
- Worst March Drought On Record In The US
- The Real Hockey Stick Graph
Recent Comments
- arn on On The Road Again
- Gordon Vigurs on On The Road Again
- conrad ziefle on Vandalism At The Reflecting Pool
- Mike Peinsipp on Vandalism At The Reflecting Pool
- GW on Vandalism At The Reflecting Pool
- Bob G on Vandalism At The Reflecting Pool
- Bob G on Fifty Years Ago Today
- Robertvd on Fifty Years Ago Today
Visualizing NOAA Fraud In Ohio
“Insensibly one begins to twist facts to suit theories, instead of theories to suit facts.”
– Sherlock Holmes
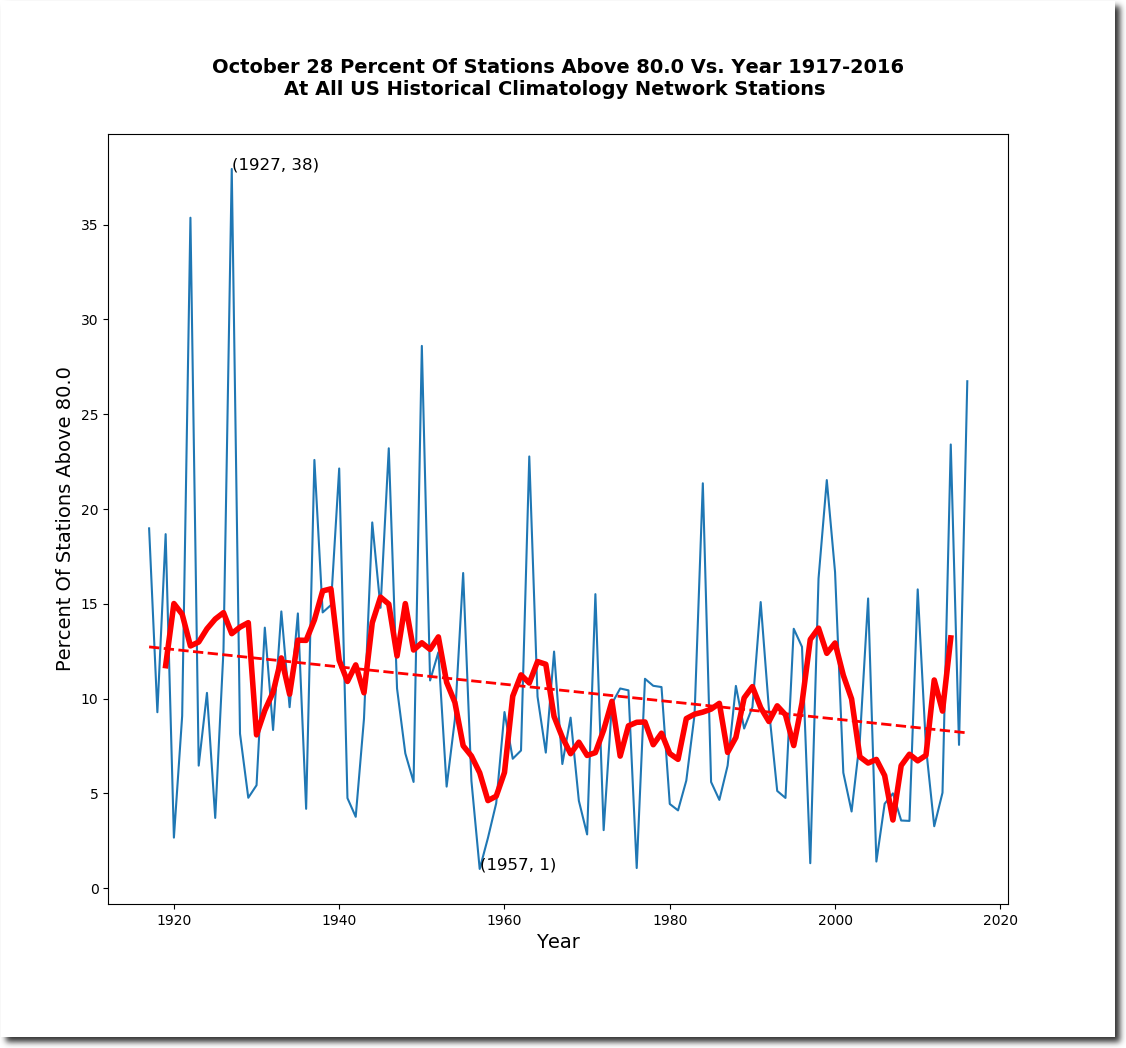
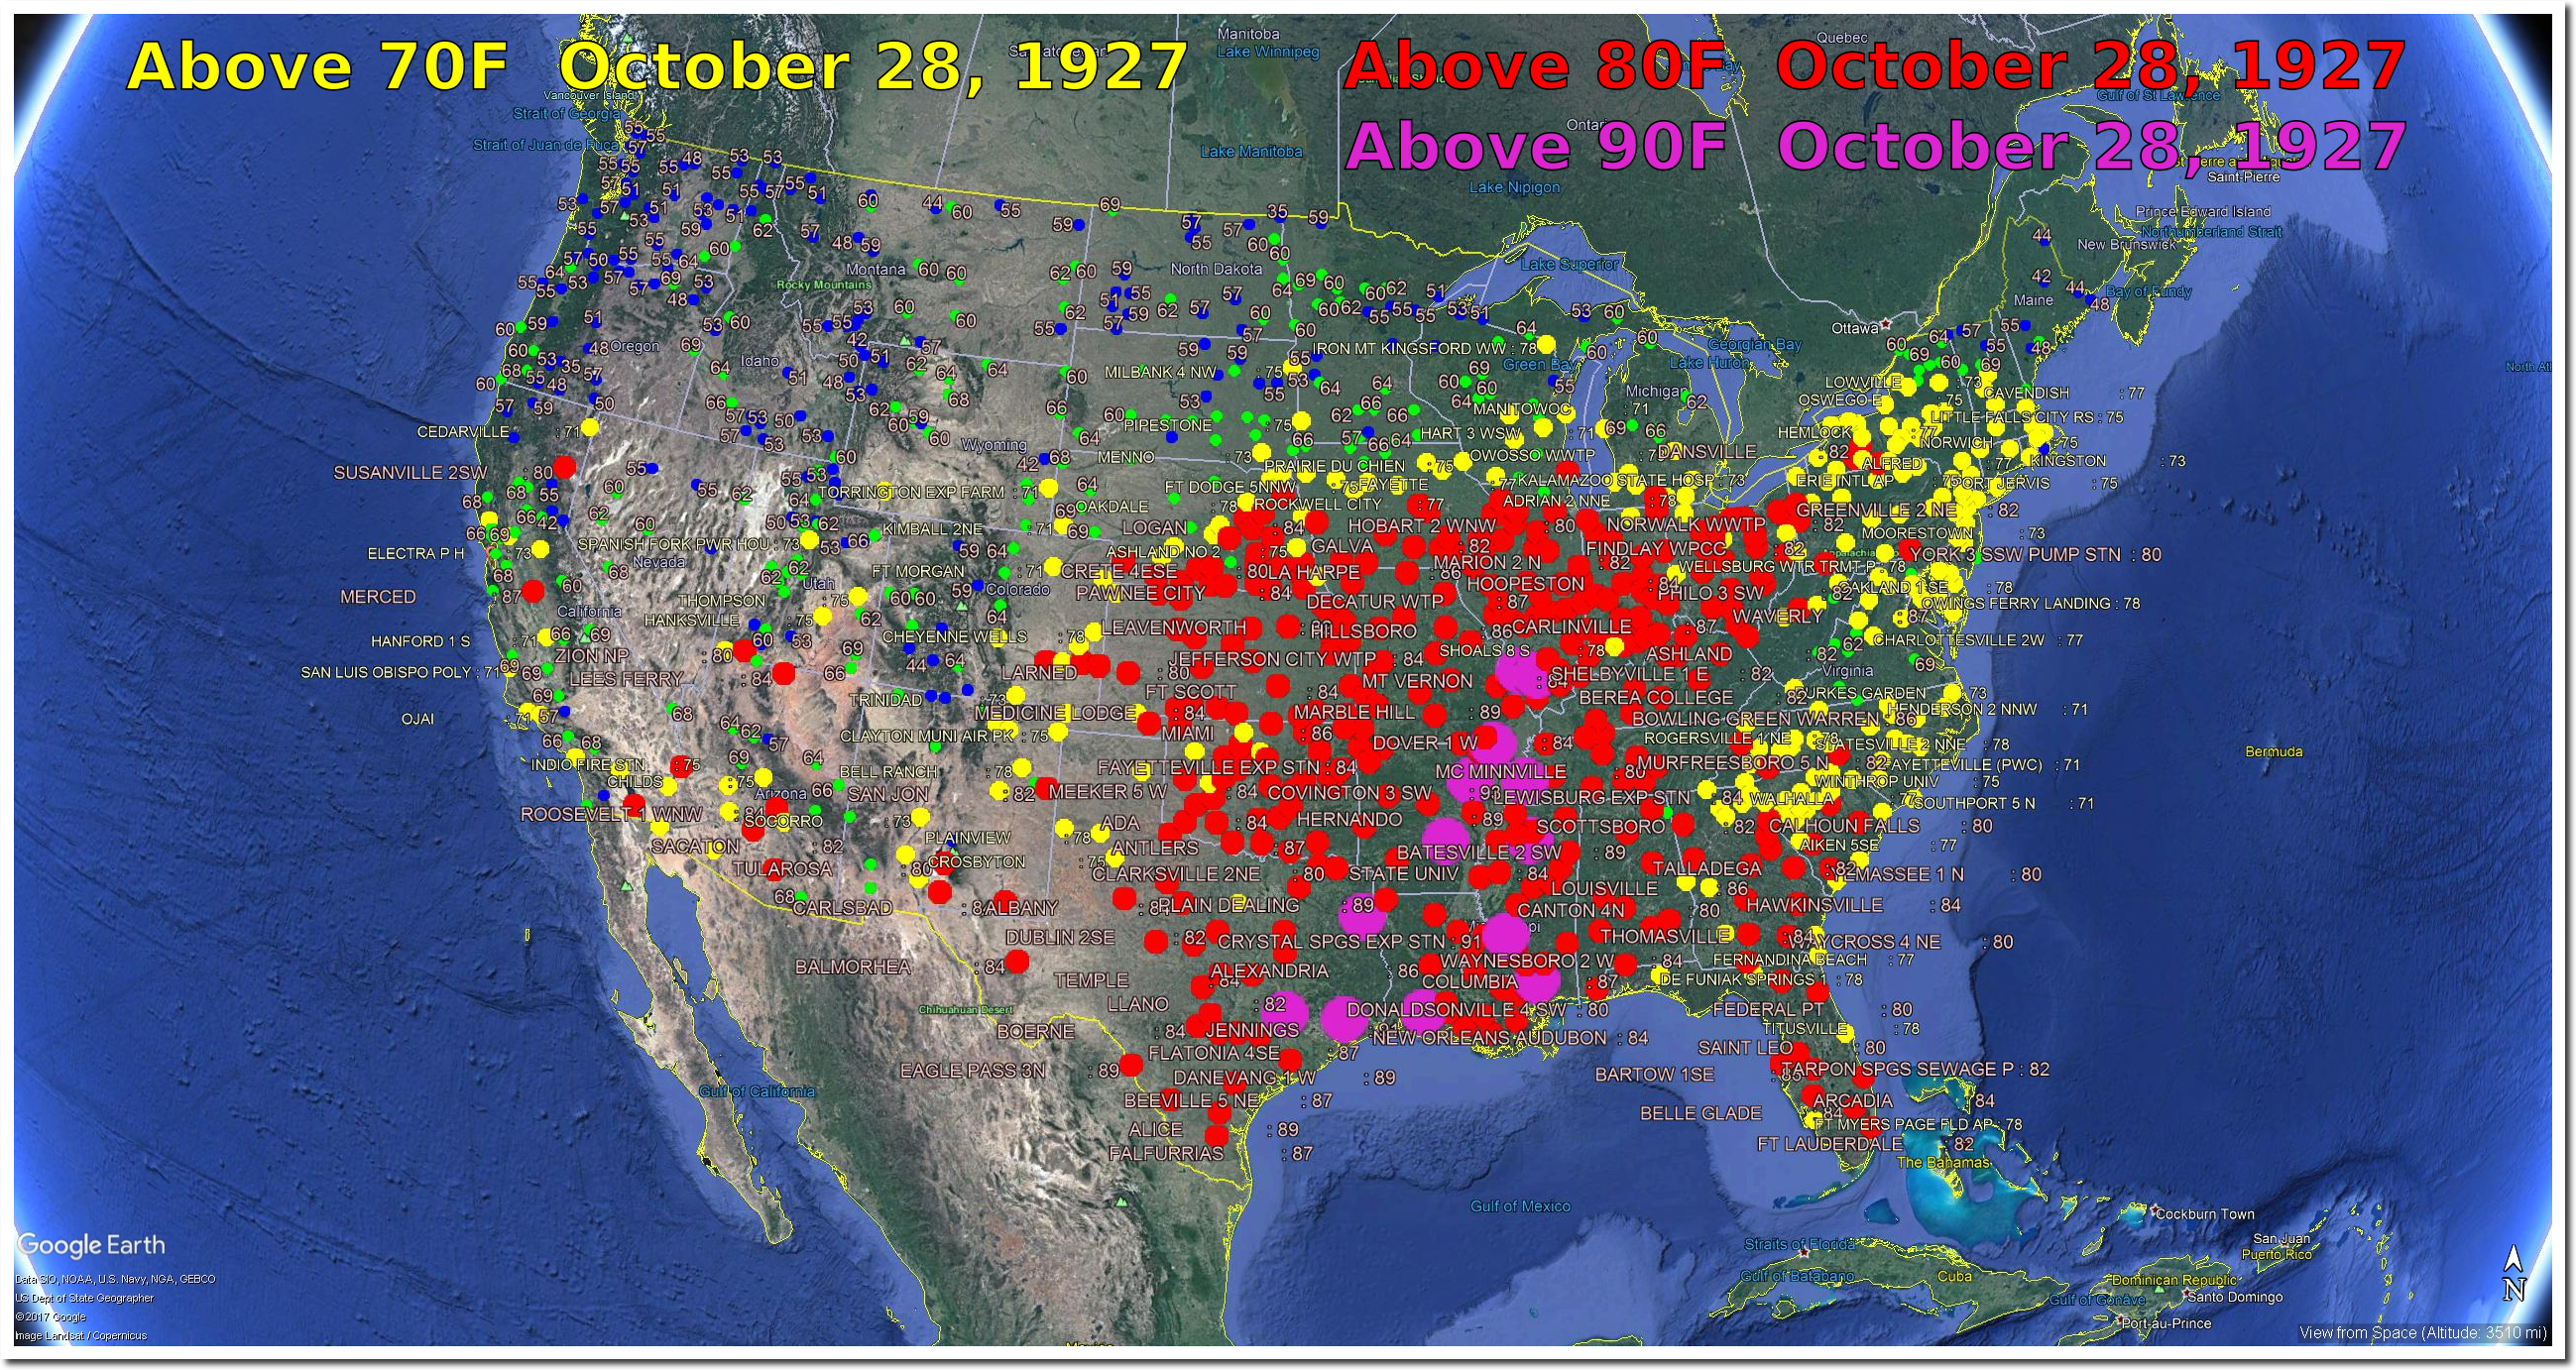
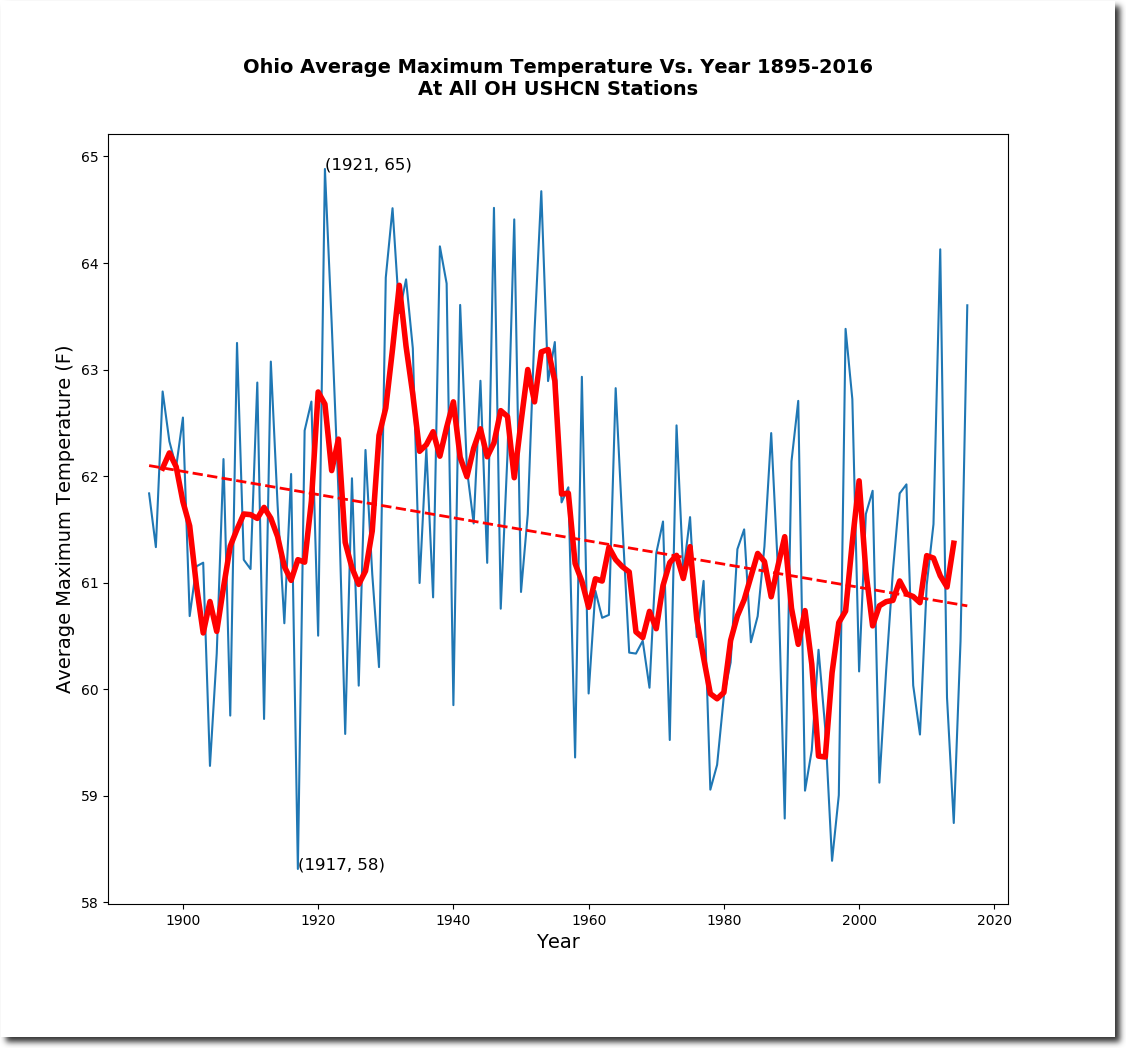
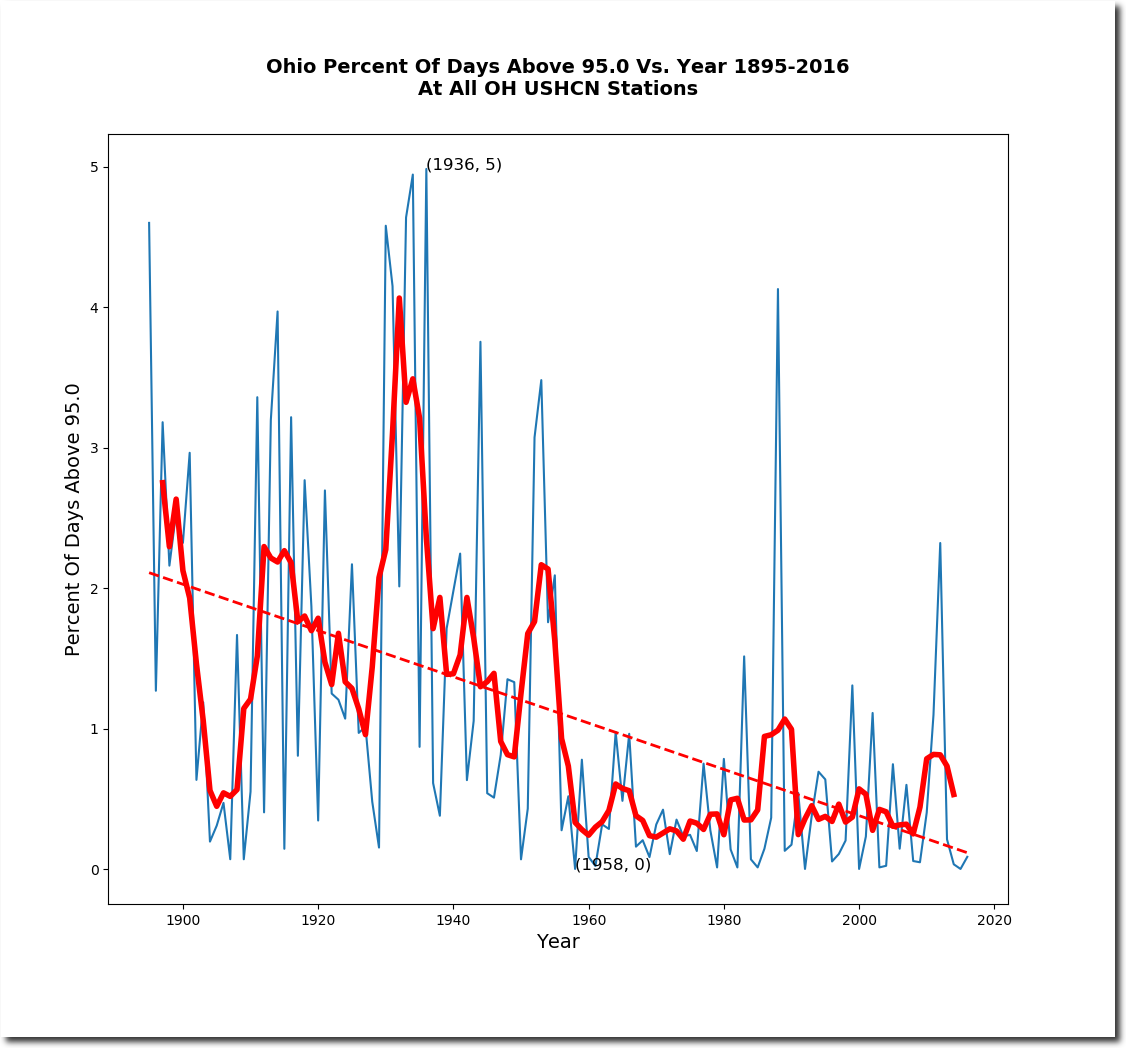
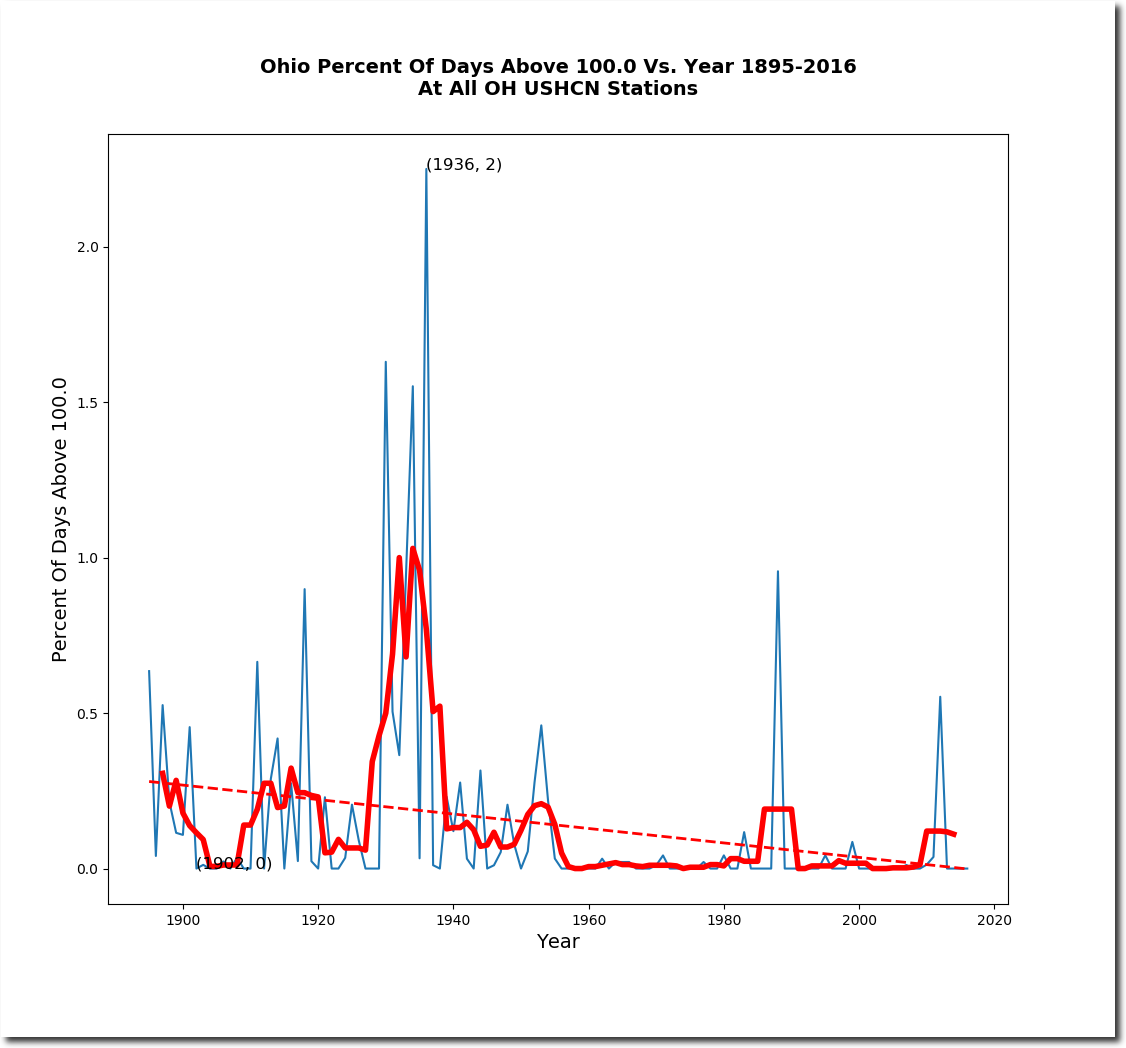
I had a request from a reader to cover Ohio temperatures/data tampering. Afternoon temperatures in Ohio were much higher prior to 60 years ago. After 1955, maximum temperatures plummeted and never recovered.
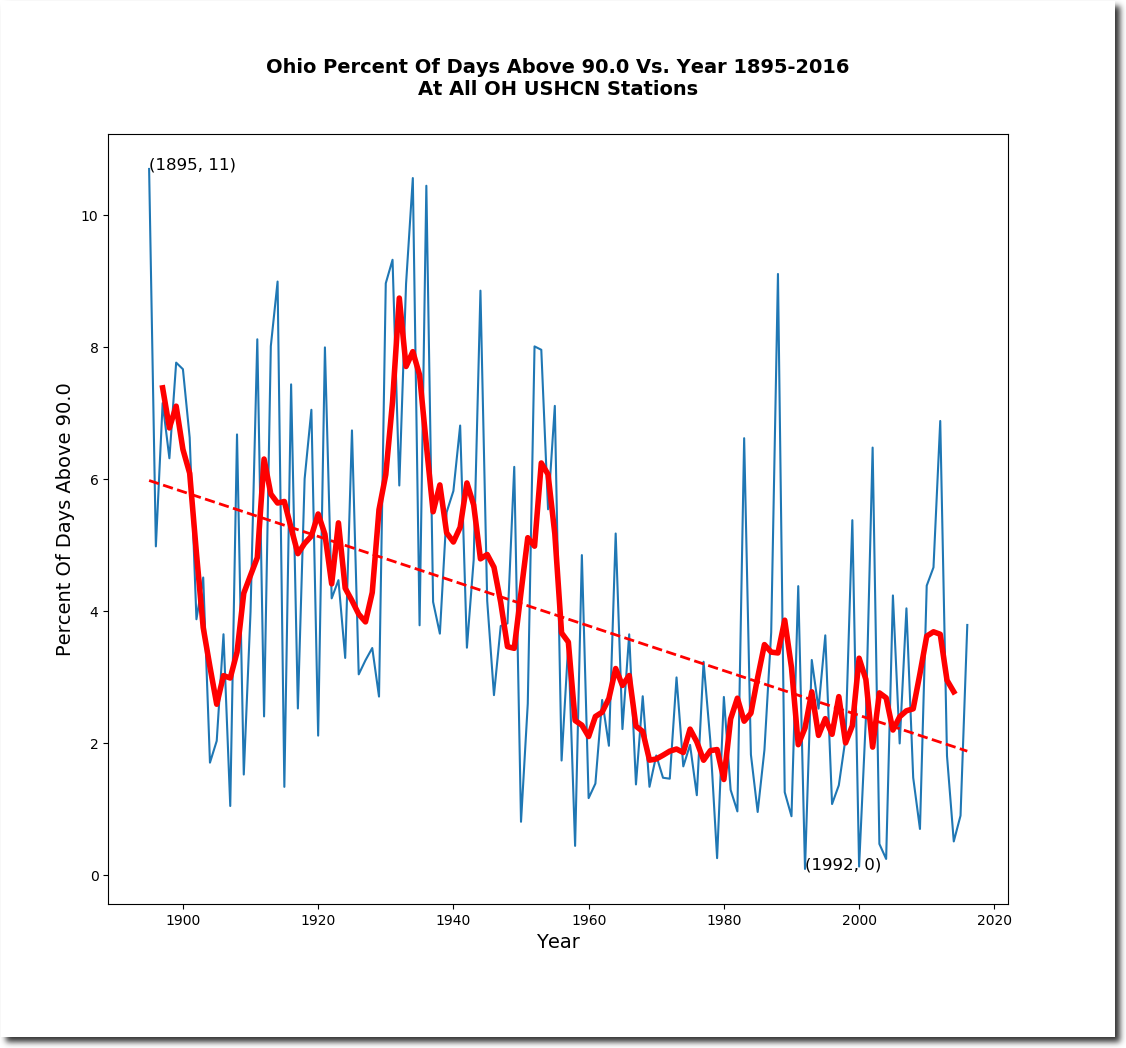
The percent of hot days in Ohio has dropped off dramatically since the 19th century.
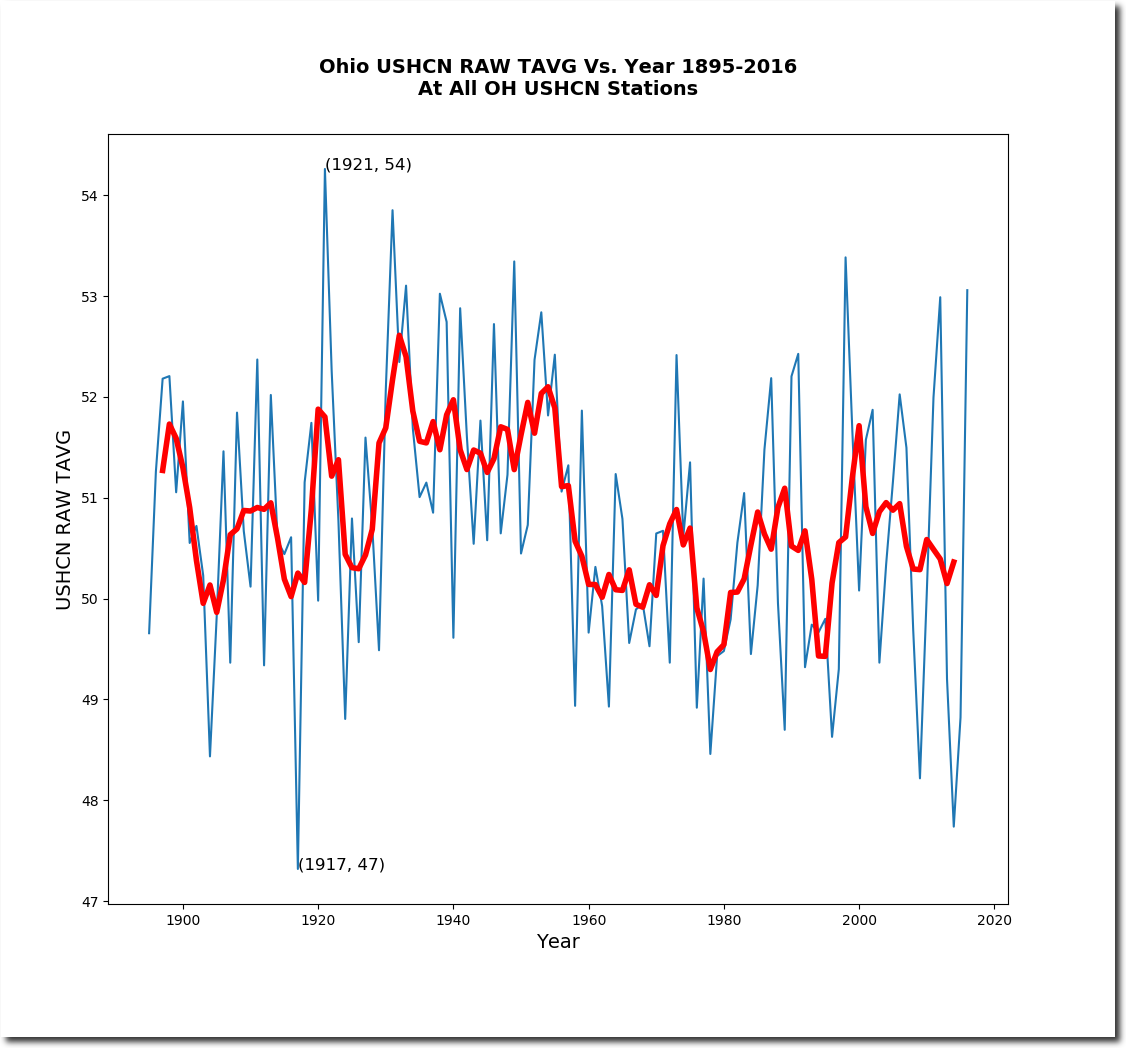
The mean temperature in Ohio also shows cooling.
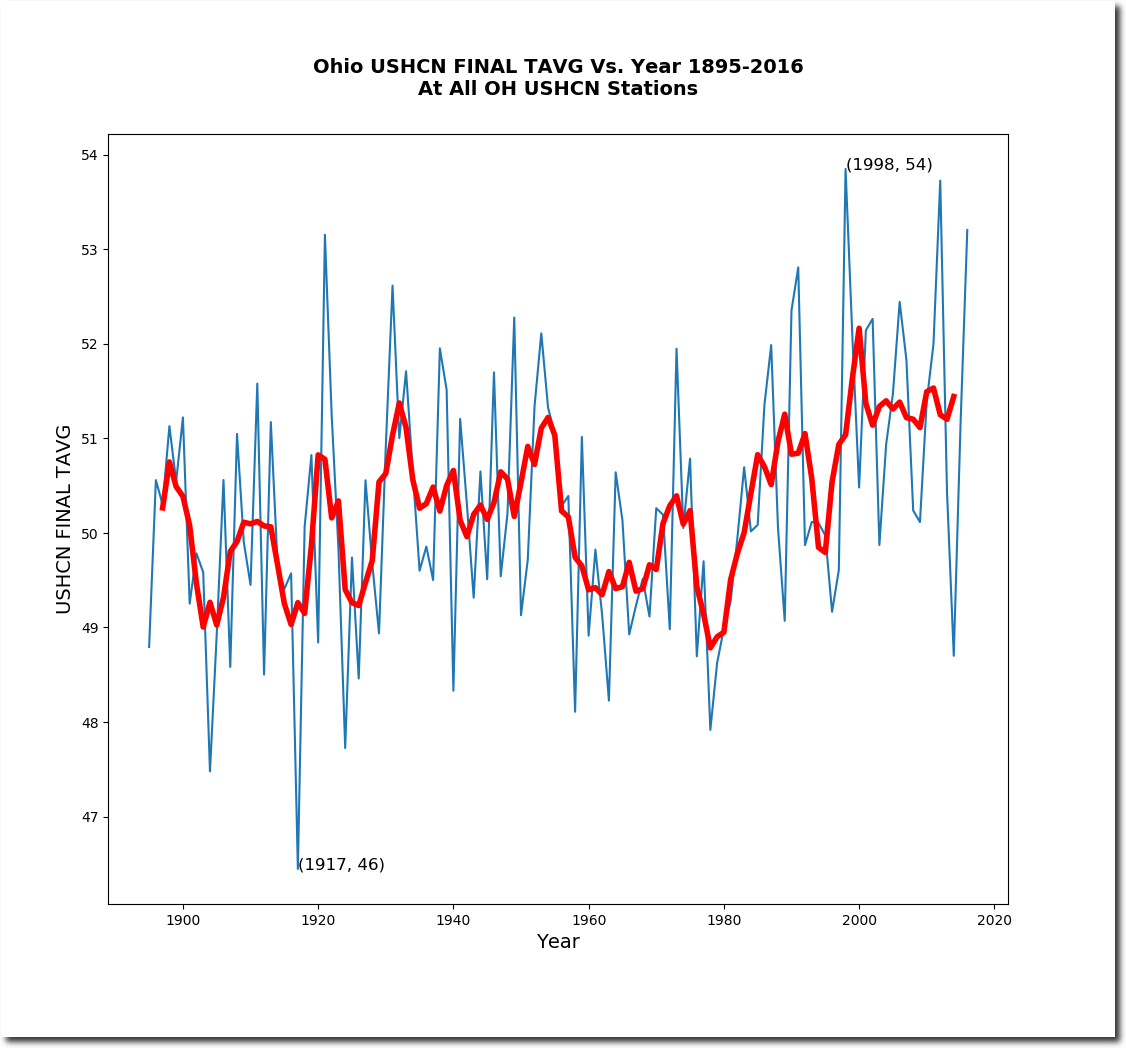
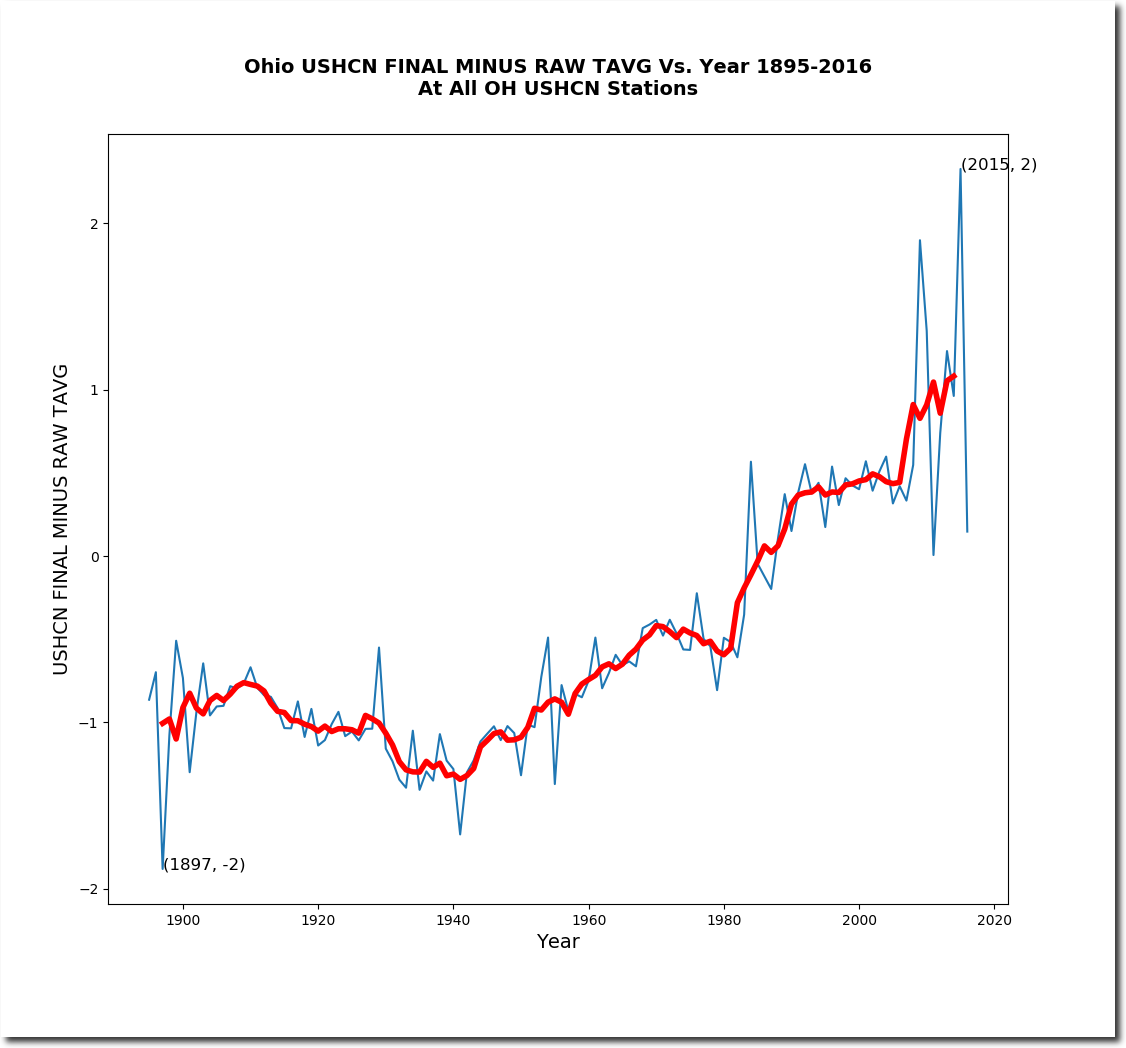
But NOAA massively tampers with the data to produce warming.
The hockey stick below shows how NOAA cools pre-1990 temperatures and warms post-1990 temperatures, to turn cooling into warming.
Global warming, and in particular US warming, is a fabrication of criminals working at government agencies. It has nothing to do with climate.
Below is the list of stations used in this analysis.
| BUCYRUS | USC00331072 |
| CADIZ | USC00331152 |
| CHIPPEWA LAKE | USC00331541 |
| CIRCLEVILLE | USC00331592 |
| COSHOCTON WPC PLT | USC00331890 |
| DEFIANCE | USC00332098 |
| DELAWARE | USC00332119 |
| FINDLAY WPCC | USC00332791 |
| GREENVILLE WTP | USC00333375 |
| HILLSBORO | USC00333758 |
| HIRAM | USC00333780 |
| KENTON | USC00334189 |
| MC CONNELLSVILLE LK 7 | USC00335041 |
| MILLERSBURG | USC00335297 |
| MILLPORT 4 NE | USC00335315 |
| NORWALK WWTP | USC00336118 |
| OBERLIN | USC00336196 |
| PHILO 3 SW | USC00336600 |
| PORTSMOUTH-SCIOTOVILLE | USC00336781 |
| TIFFIN | USC00338313 |
| UPPER SANDUSKY | USC00338534 |
| URBANA WWTP | USC00338552 |
| WARREN 3 S | USC00338769 |
| WAUSEON WTP | USC00338822 |
| WAVERLY | USC00338830 |
| WOOSTER EXP STATION | USC00339312 |
Posted in Uncategorized
Leave a comment
The Wildly Fraudulent NOAA Climate Extremes Index
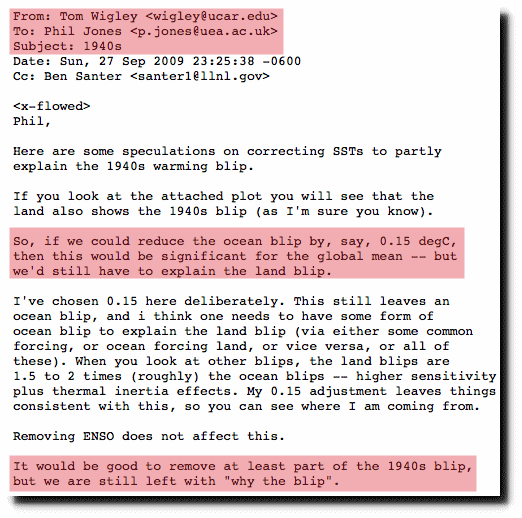
NOAA’s climate reporting is spectacularly fraudulent and cynical. They do things like report record heat in parts of the world where they had no temperature data that month..
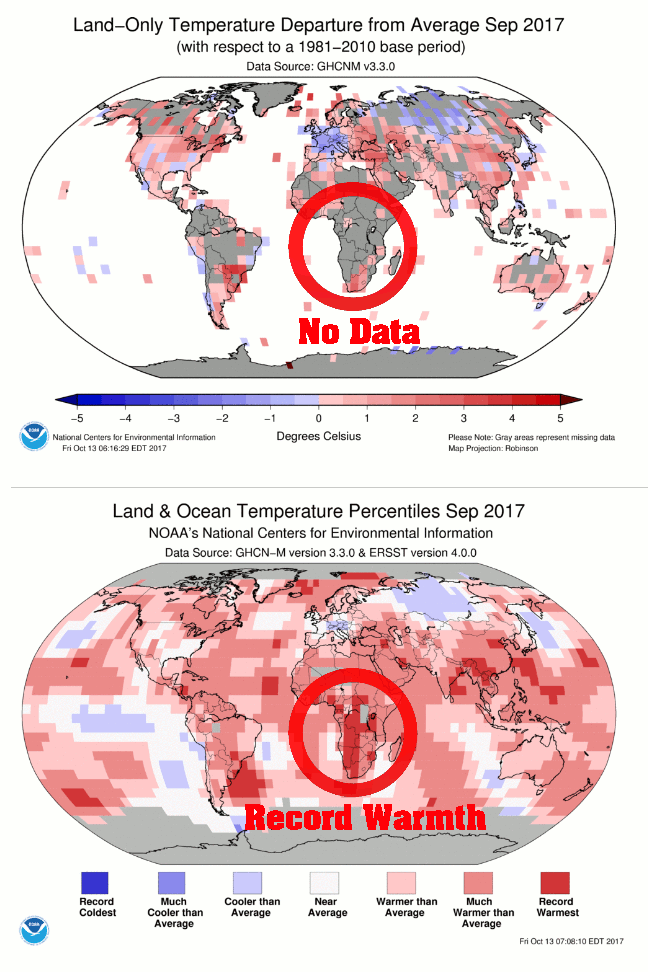
But none of NOAA’s climate fraud is more cynical then their Climate Extremes Index. NOAA claims that the occurrence of hot summer afternoons has increased in the US, with 2012 being the hottest.
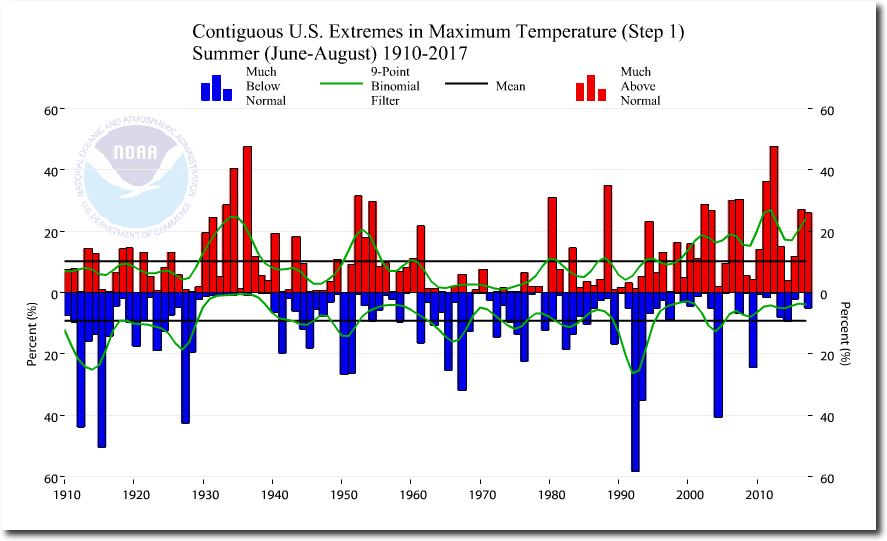
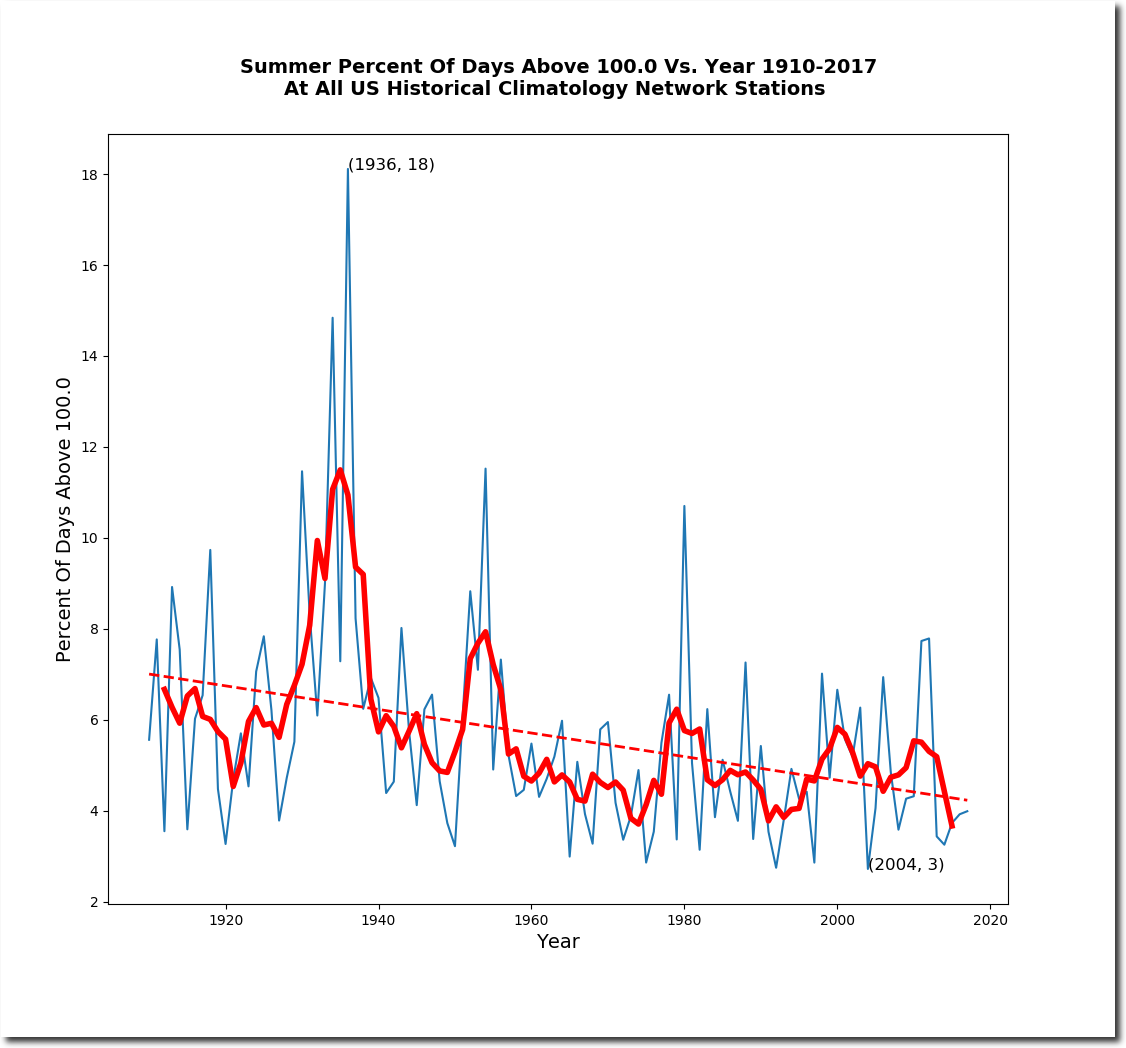
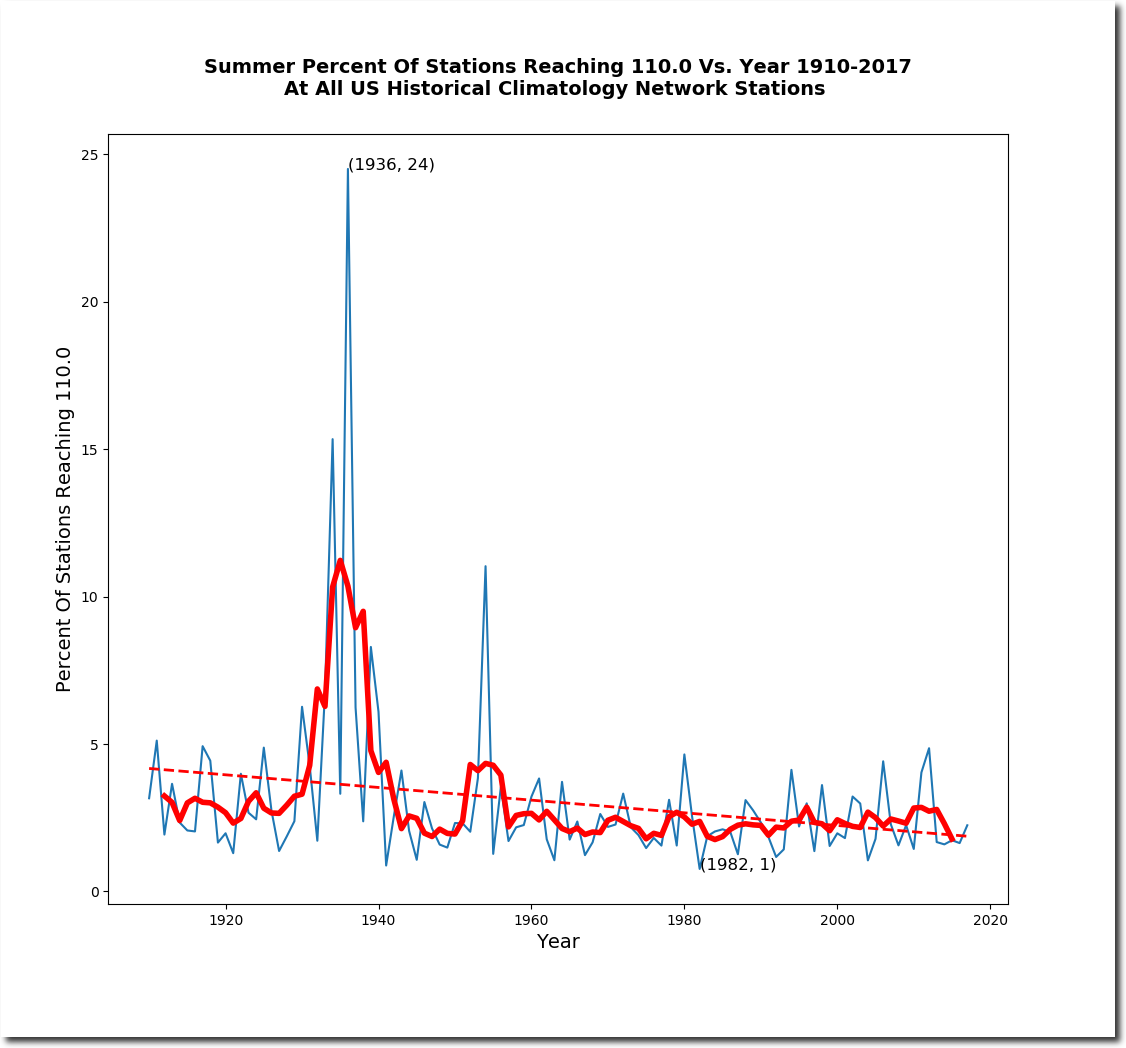
This is wildly fraudulent misinformation. The frequency and areal coverage of hot summer afternoons in the US has plummeted over the past 80 years, and is now near record lows.
The average summer maximum temperature has plummeted.
The percent of hot days has plummeted.
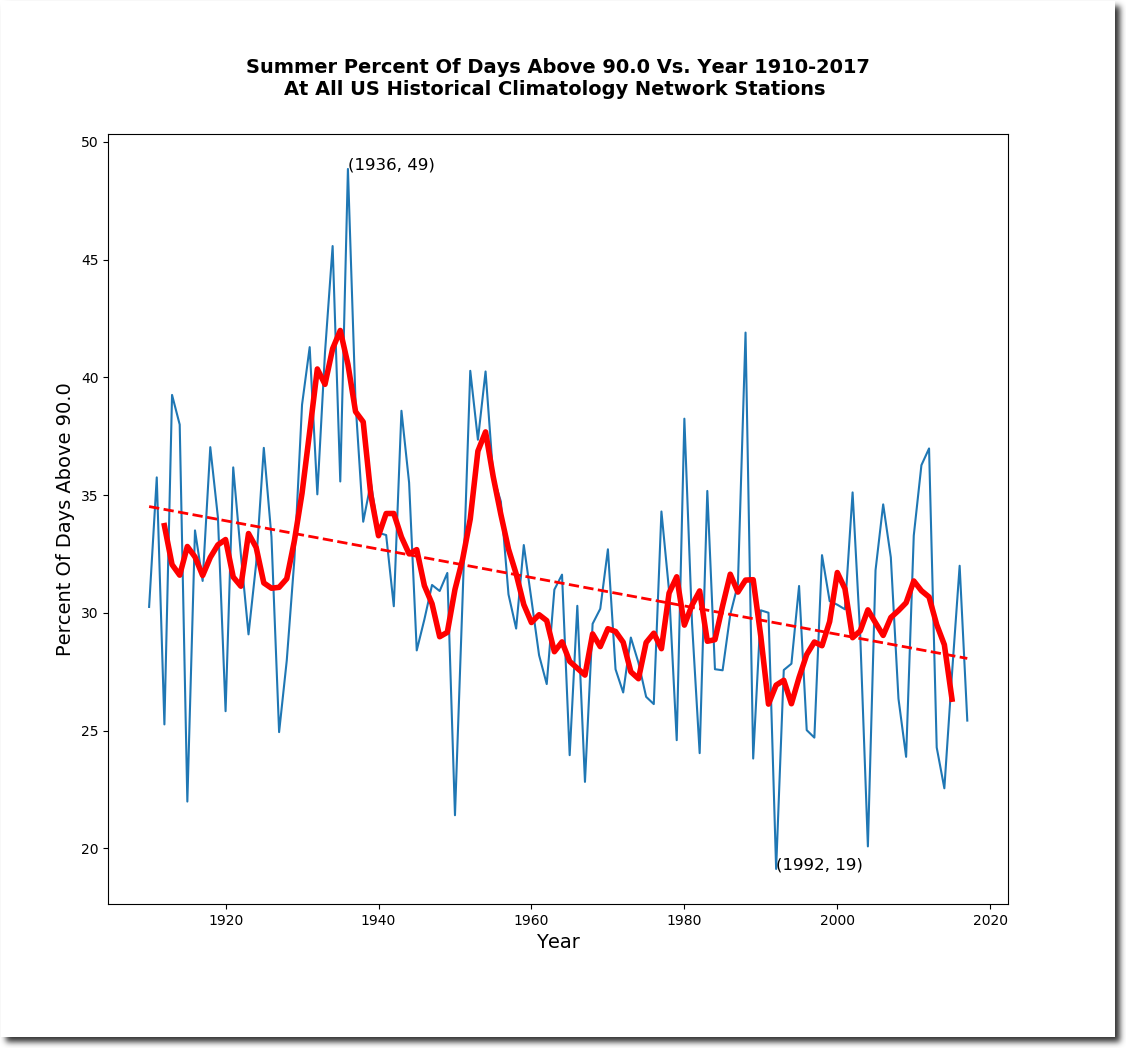
During the 1930’s about two-thirds of the US would reach 100 degrees during the summer. In recent years, that percentage has been less than one-third.
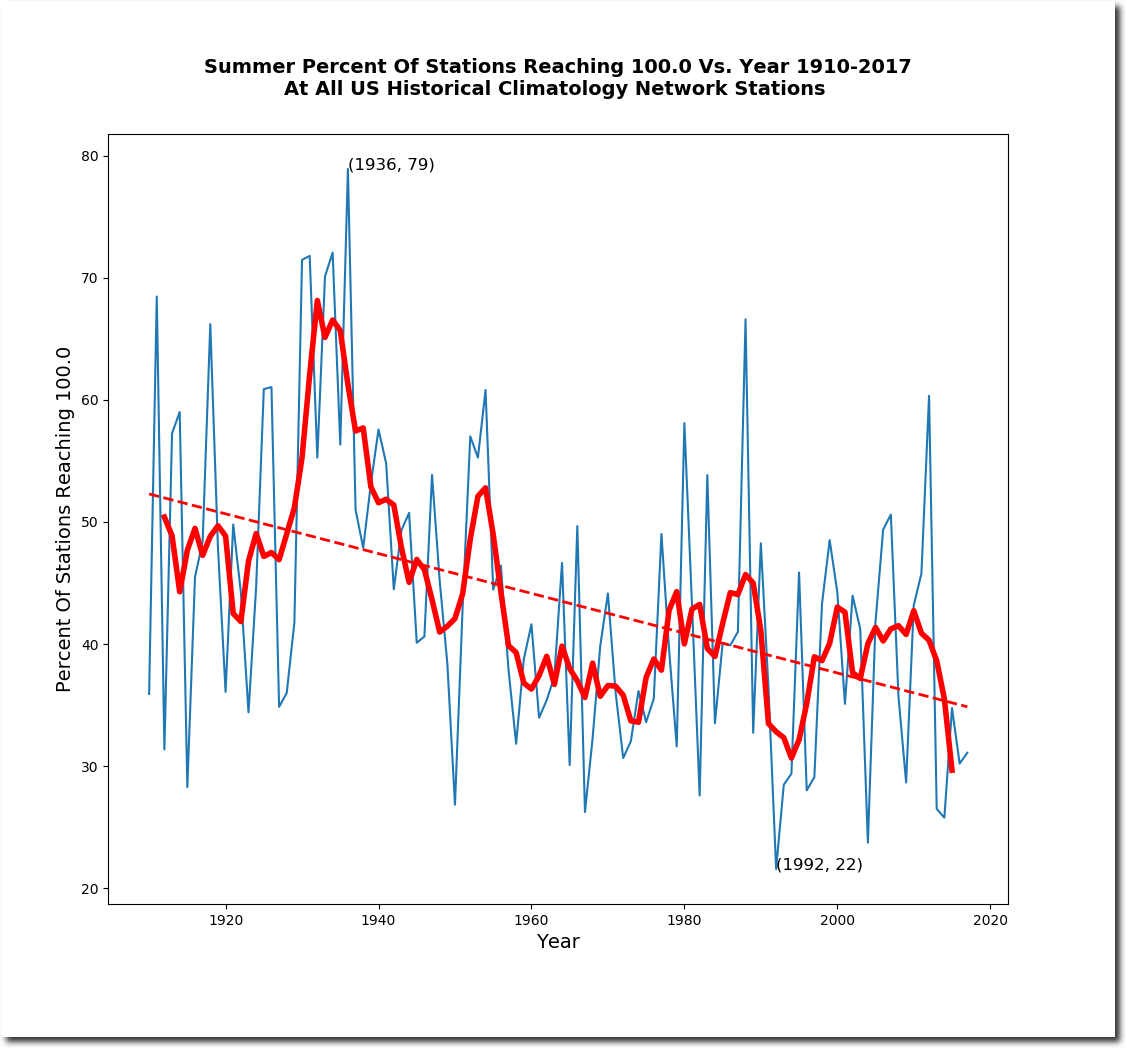
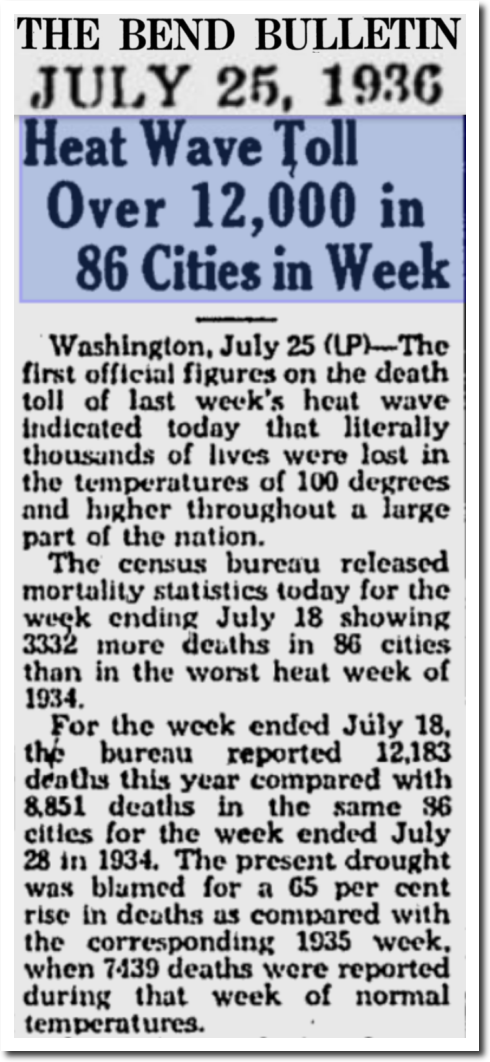
Summer afternoons are getting much cooler in the US. The 1930’s were very hot, with temperatures over 120 degrees in the Great Plains, and over 110 degrees across much of the US.
The Bulletin – Google News Archive Search
It is bad enough when NOAA makes up record high temperatures, but even more disturbing when they report the exact opposite of the actual trend. The people behind this are criminals, not scientists – and they are enabled by their fellow travelers in the press who refuse to question their work, or talk to anyone who does.

Posted in Uncategorized
Leave a comment
Climate Science Bipolar Disorder
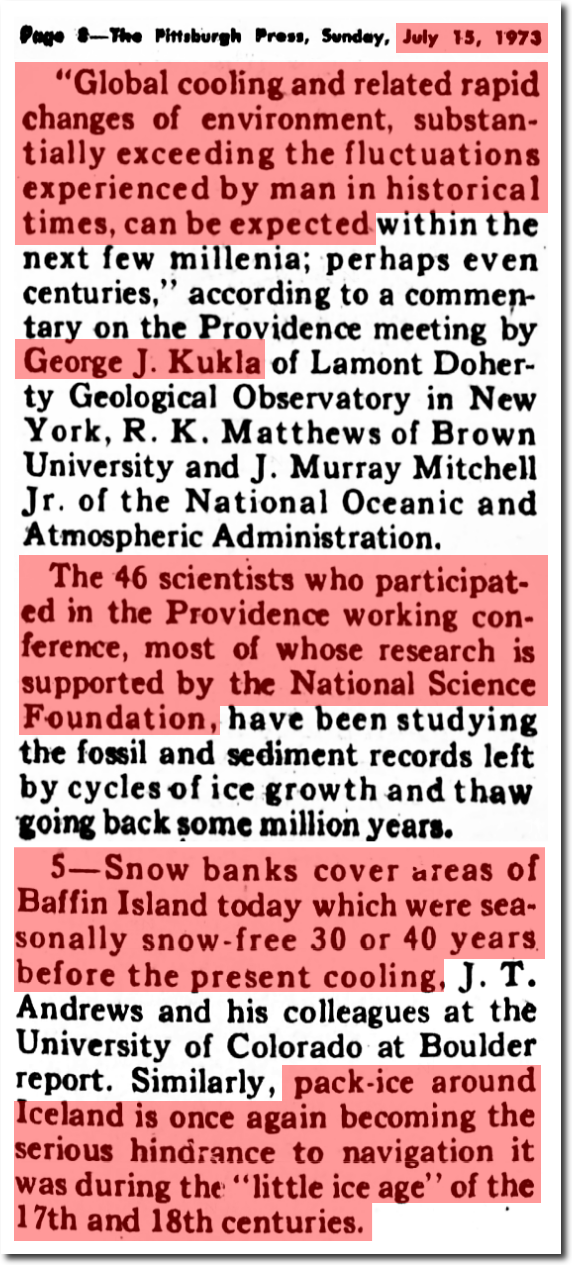
In 1973, George Kukla and the National Science Foundation forecast global cooling and a new ice age. They cited increased ice and snow in the Arctic as evidence.
15 Jul 1973, Page 200 – The Pittsburgh Press at Newspapers.com
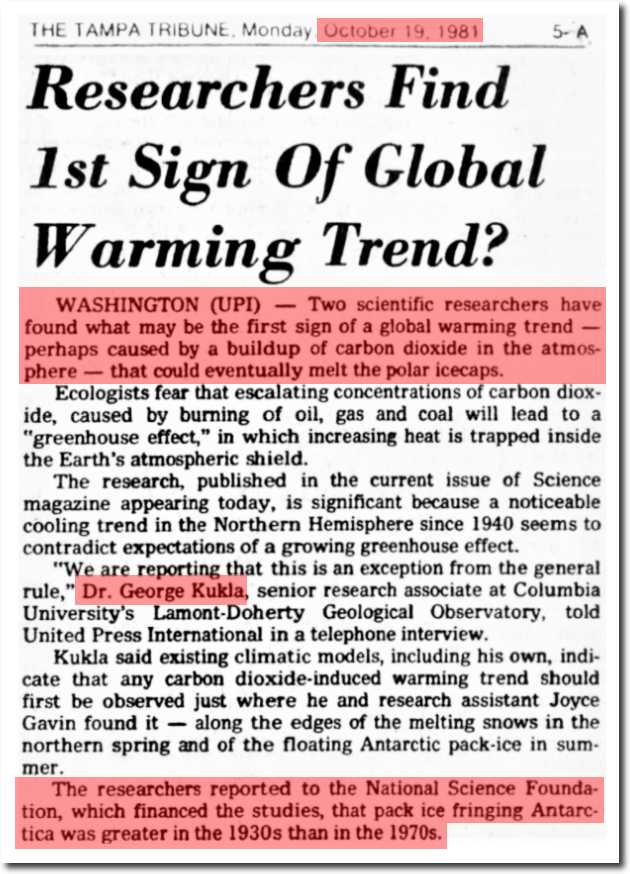
In 1981, George Kukla and the National Science Foundation forecast global warming and melting polar ice caps. They cited decreased ice in the Antarctic as evidence.
19 Oct 1981, 5 – The Tampa Tribune at Newspapers.com
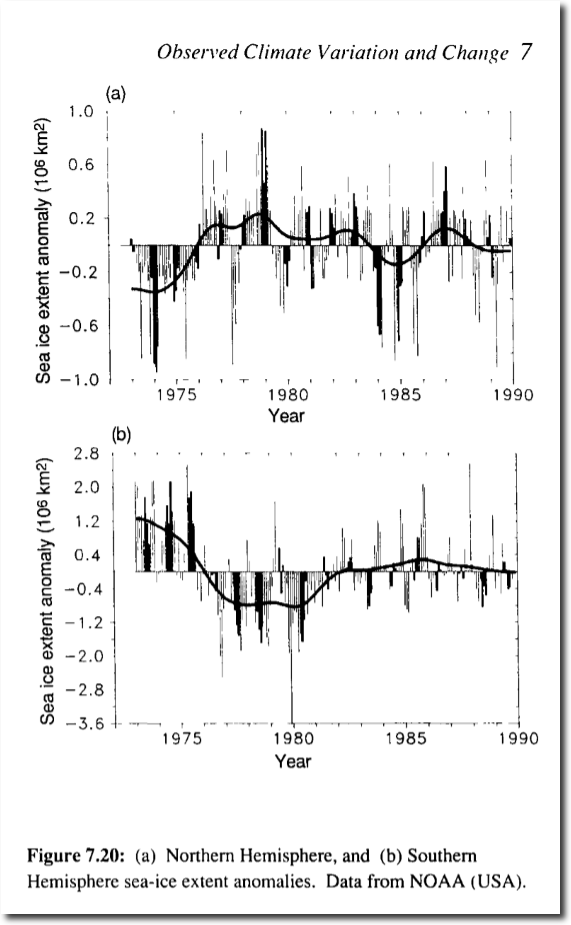
As the IPCC reported in 1990, Arctic and Antarctic trends go opposite each other. Arctic ice increased from 1973 to 1981, and Antarctic ice decreased during that same period.
https://www.ipcc.ch/ipccreports/far/wg_I/ipcc_far_wg_I_chapter_07.pdf
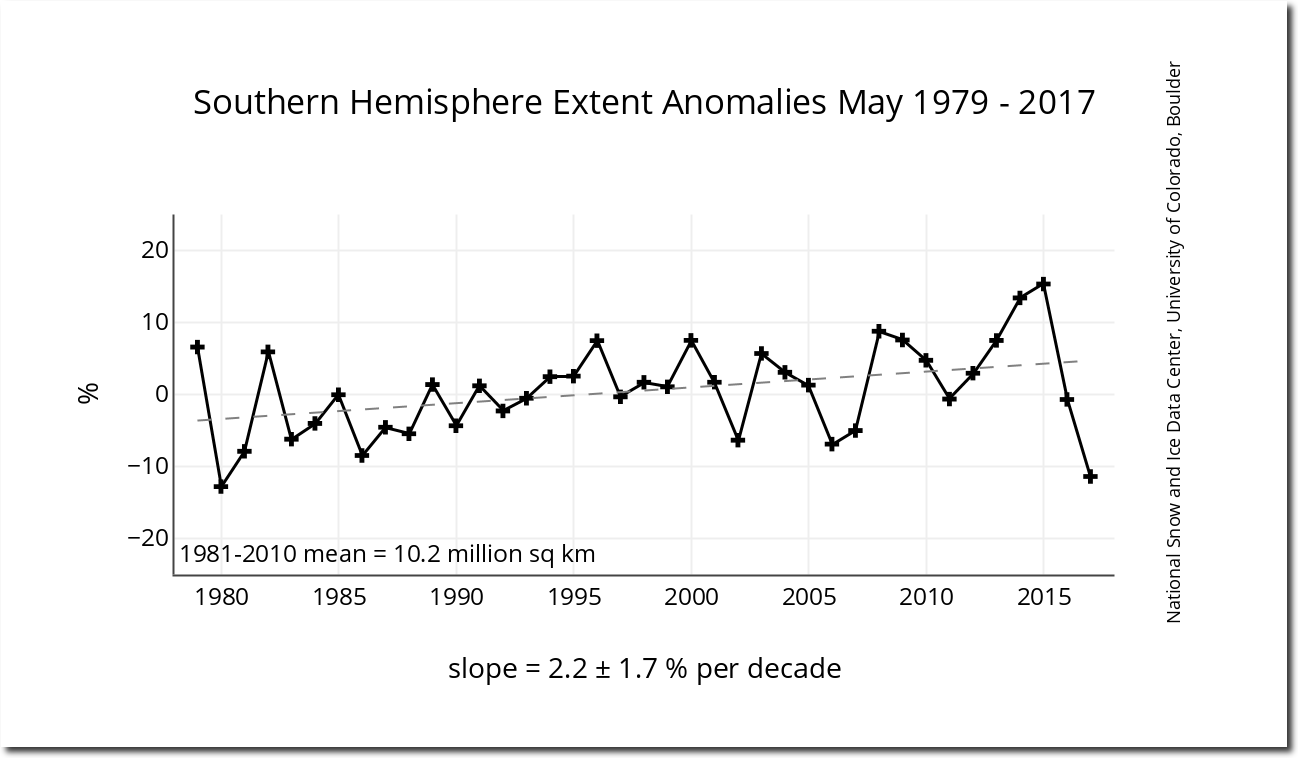
Kukla ignored the increase in Arctic ice in his 1981 study, just as climate scientists now ignore the increase in Antarctic ice since 1981.
S_05_extent_anomaly_plot_hires_v3.0.png (1260×720)
The one thing constant in climate science is that climate scientists will say whatever is required to obtain funding, and they will cherry-pick their data as necessary. What they are doing has absolutely nothing to do with science.
Posted in Uncategorized
Leave a comment
Status Update
James Delingpole and Daisy – December, 2016
Thanks to the grace of God and your prayers, I am making steady progress. I’m even considering a UK trip in December – something which seemed impossible a week ago.
I ordered a Canon Pixma Pro-100 printer for creating the large 19×13 prints I am delivering for donations over $100. Canon is offering an incredible deal, where the printer is almost free after rebates. They expect to make their money off ink, but as much as I love Canon – I will be buying generic refill ink.
The printer arrives today, so I will start shipping out the prints shortly. Please remember to include which picture you want, and a shipping address.
Posted in Uncategorized
Leave a comment
The Time-Line Of Climate
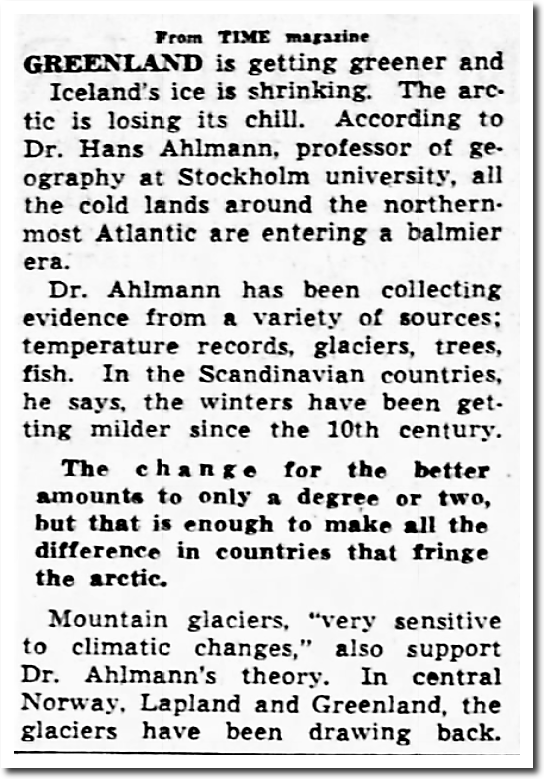
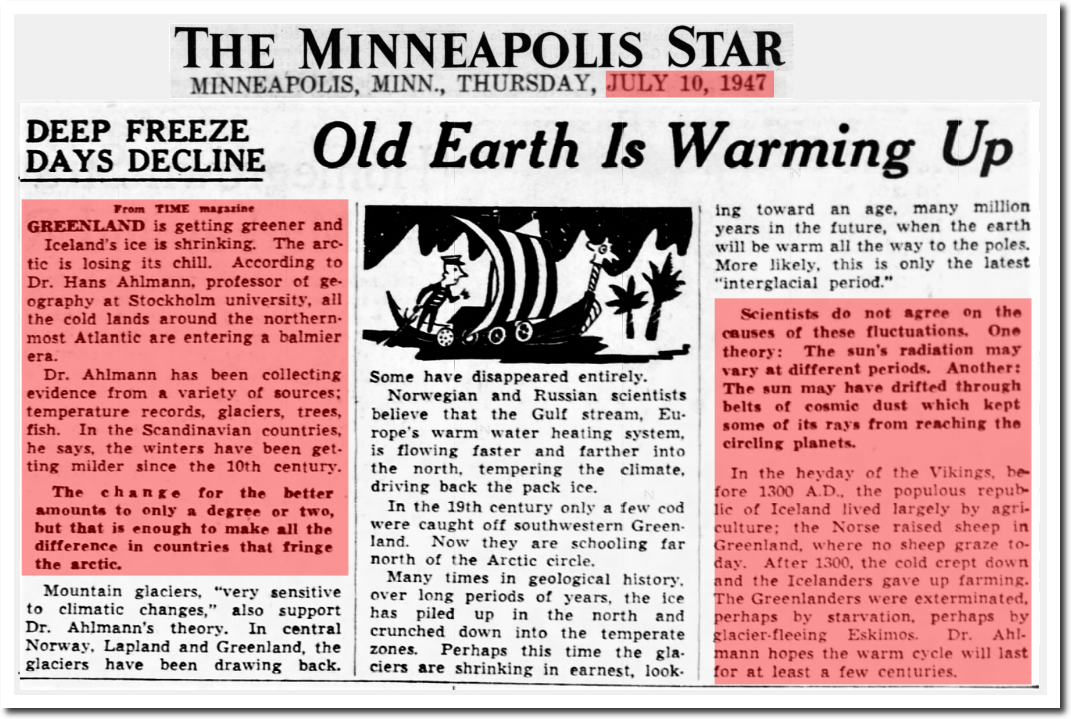
Time Magazine 1947 – global warming.
10 Jul 1947, Page 18 – The Minneapolis Star at Newspapers.com
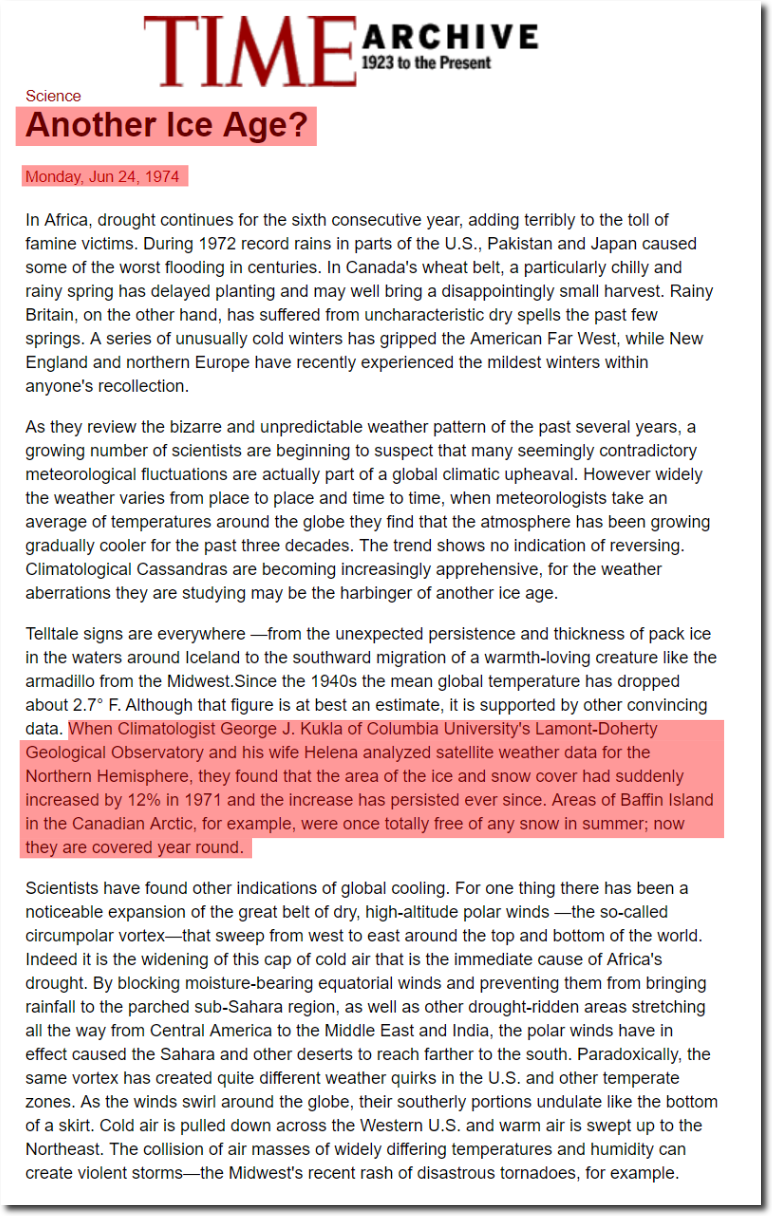
Time Magazine 1974 – global cooling.
TIME Magazine Archive Article — Another Ice Age? — Jun. 24, 1974
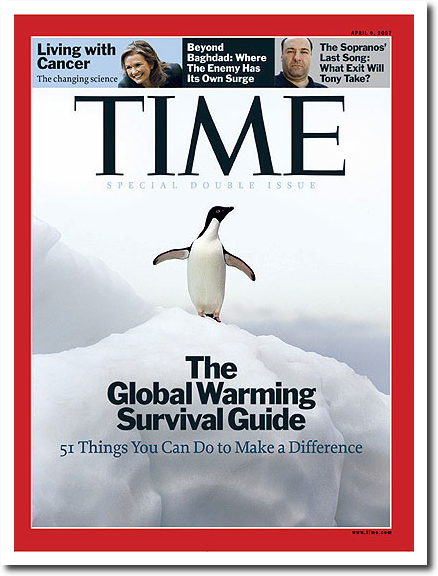
Time Magazine 2007 – global warming
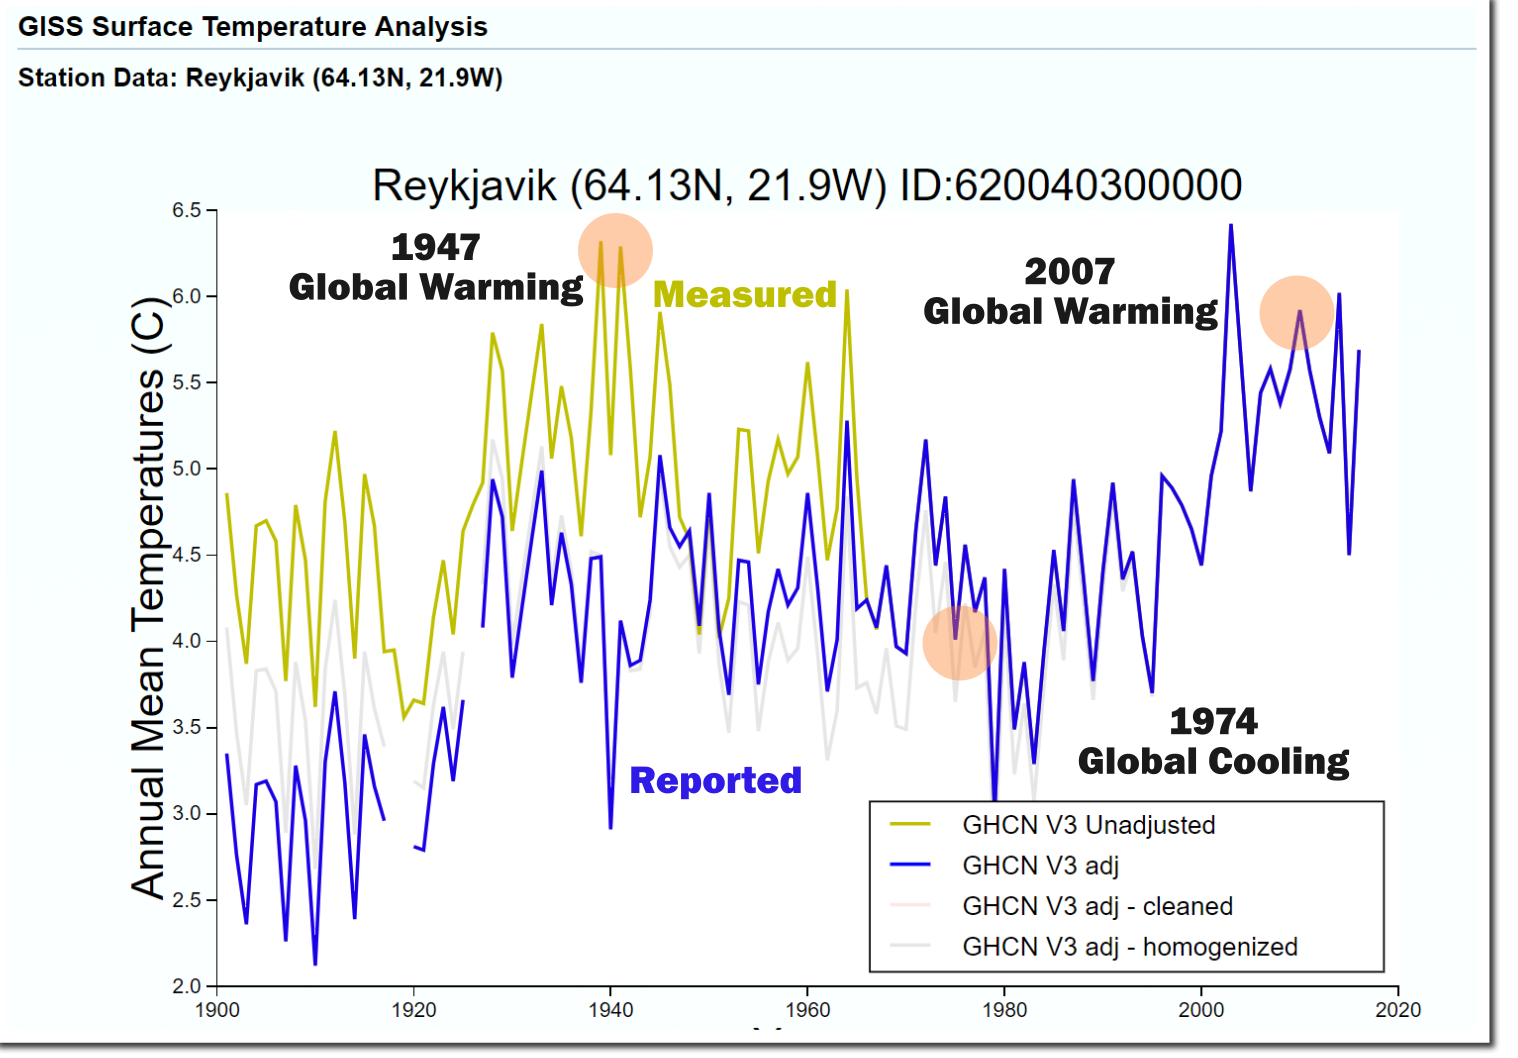
Climate is cyclical, as is climate reporting. The reason that people don’t understand this is because criminals working at NOAA, NASA and other government agencies tamper with the data to remove past warm periods. The raw data reflects the Time reporting timeline. The adjusted data doesn’t.
Posted in Uncategorized
Leave a comment