Smoking Gun Of Fraud At NOAA

It took about one second with my new software to identify fraud in the handling of the US temperature record. The very first record I looked at showed it..

In NOAA’s adjusted USHCN data set, they mark months which they fabricated data with an “E”. They say that inadequate or no data was available from the station that month.
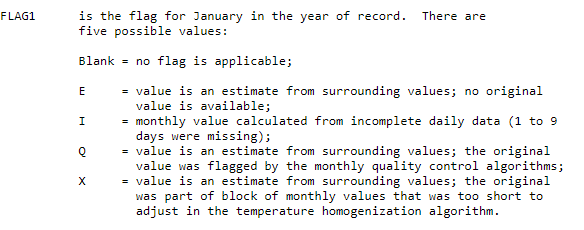
ftp://ftp.ncdc.noaa.gov/pub/data/ushcn/v2/monthly/readme.txt

The station at Brewton, Alabama (USC00011084 or USH00011084) is marked (3203EQ) as missing data for August, 1991 with a temperature of 32.93C.

The data is not missing however. The station averaged 29.84C that month, as seen in both the daily and monthly raw data for that month.  In fact, the station reported daily temperatures on every single day that month.  Scroll the window below to the right to see the eighth month (August.)  Links to the NOAA source data are included in the window below.

USH00011084.FLs.52j.tmax   (Adjusted monthly)
USH0001108411991  1607c    1961     2330e    2690     2895a    3140a    3262e    3203EQ   3130EX   2704EX   1951EX   1849EX
USH00011084.raw.tmax    (Raw monthly)
USH00011084 1991  1558c    1909     2278e    2641     2847a    3096a    3224e    2984 S   2828     2505     1730c    1637
USC00011084.dly  (Daily - all 31 days recorded)
USC00011084199108TMAX 300 0 311 0 317 0 317 0 322 0 317 0 317 0 311 0 311 0 306 0 311 0 300 0 306 0 300 0 261 0 278 0 283 0 300 0 311 0 300 0 294 0 294 0 294 0 283 0 272 0 283 0 294 0 261 0 300 0 306 0 289 0 

NOAA increased the August, 1991 temperature at Brewton, Alabama by more than 2C, based on a fake claim that the data was missing – when both of their other data sets (raw monthly and daily) agreed with each other and showed complete sets of data.  A quick scan of the data shows that this is not an isolated incident, as 1992 was even worse.

This replacement of good cool data with warm fake data is being done to almost every single station in the US.
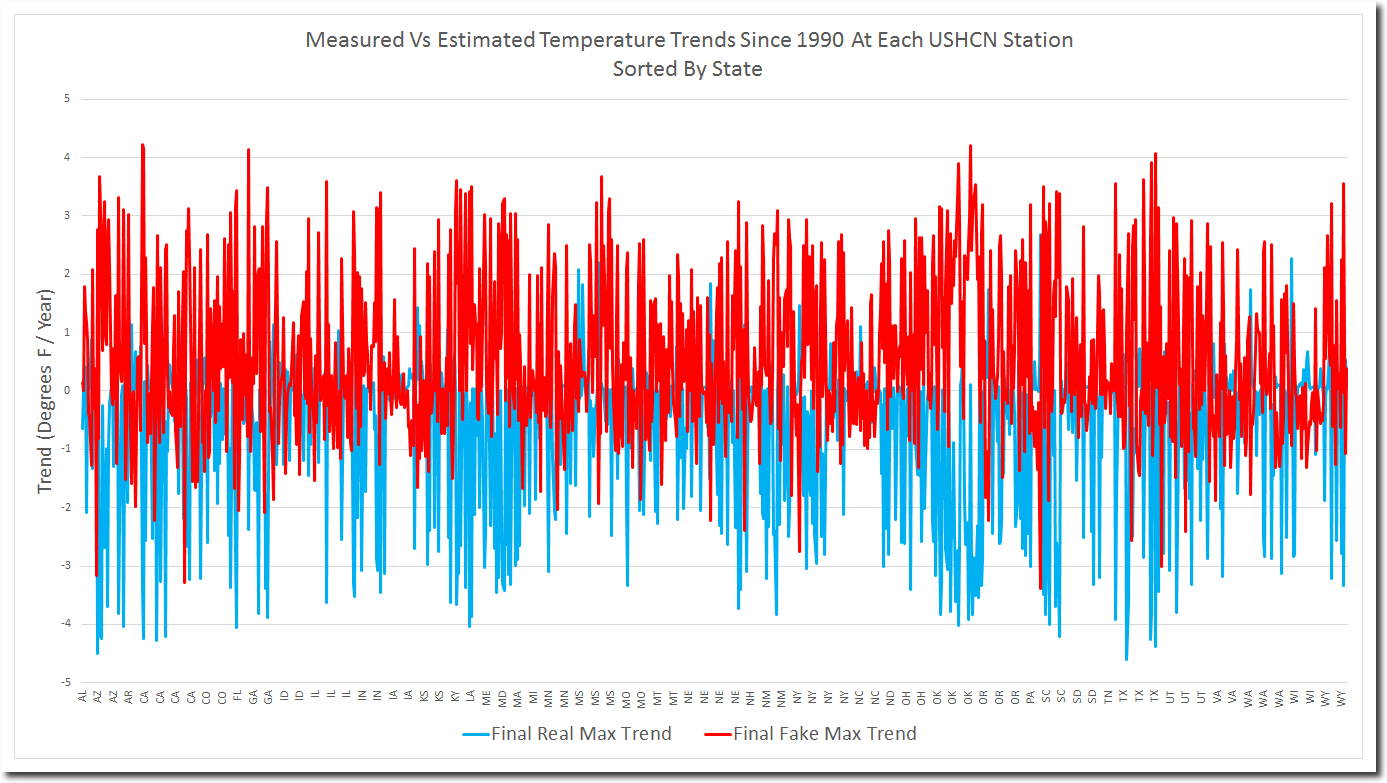
NOAA says their algorithm is working “as designed.”  There is no wiggle room here. NOAA has been caught red-handed. How do think they can get away with this?
Posted in Uncategorized | Leave a comment

Visualizing Government Climate Action

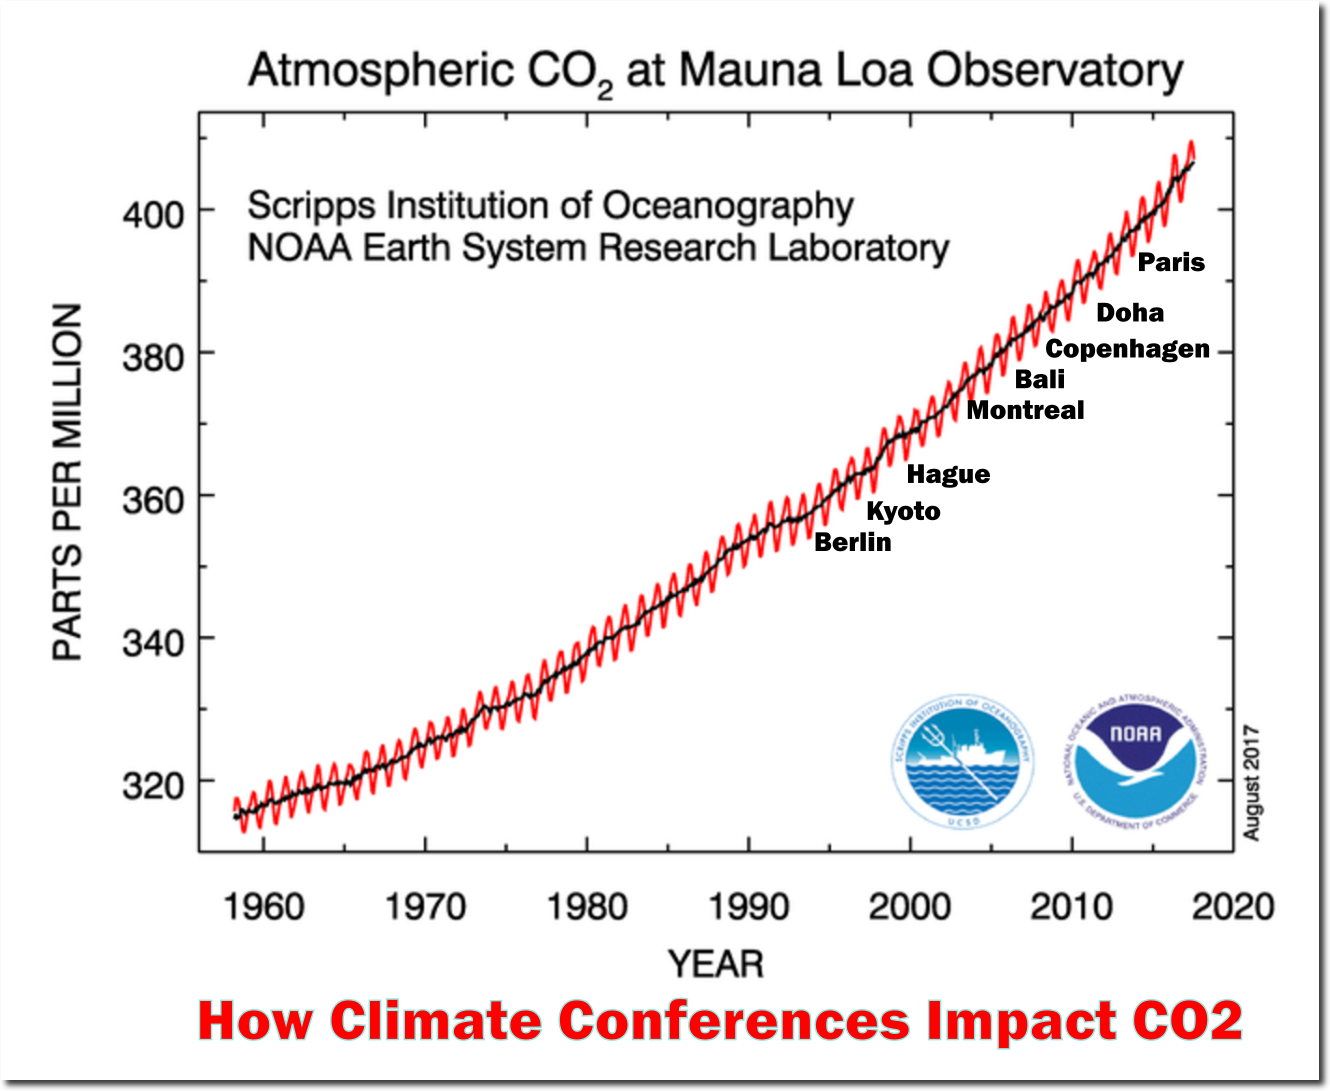
CO2 has little or nothing to do with climate, and government climate action has nothing to do with CO2 or climate. It is all about the money and power.

Posted in Uncategorized | Leave a comment

Climate Community Responds To My Charges Of Fraud

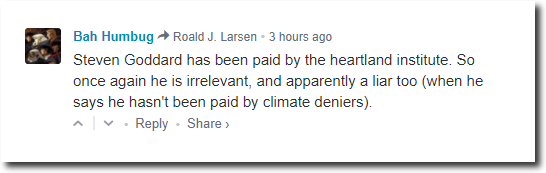
I uncover rock solid proof of fraud, so the climate community responds on Breitbart with their predictable anonymous non-sequitur ad hom attack.

I’ve never taken any money from Heartland. I am spent several thousand dollars of my own money for the Heartland events I have attended. They pre-paid for my hotel when I spoke at the Heartland Conference in 2014. I paid for the plane ticket. They offered to pay for my plane travel and hotel when I spoke at the Washington State Senate and at a recent meeting in Washington D.C.  I have not billed them for either.

Climate alarmists steal billions of dollars every year from taxpayers, and then they attack anyone who calls them out on their fraud. Anyone who wants to make money lying about the climate is on their side,

The only funding I get is from small donations on this blog, which works out to much less than minimum wage for the time I put in.

Climate alarmists are the very filth of the earth. They have no interest in science, honesty or integrity. It is all about money and power and attacking anyone who threatens their scam.

My net loss for blogging, including lost time and opportunity cost, is probably close to  one million dollars. And then they accuse me of being on the take.

Posted in Uncategorized | Leave a comment

First Texas Hurricane For Nine Years

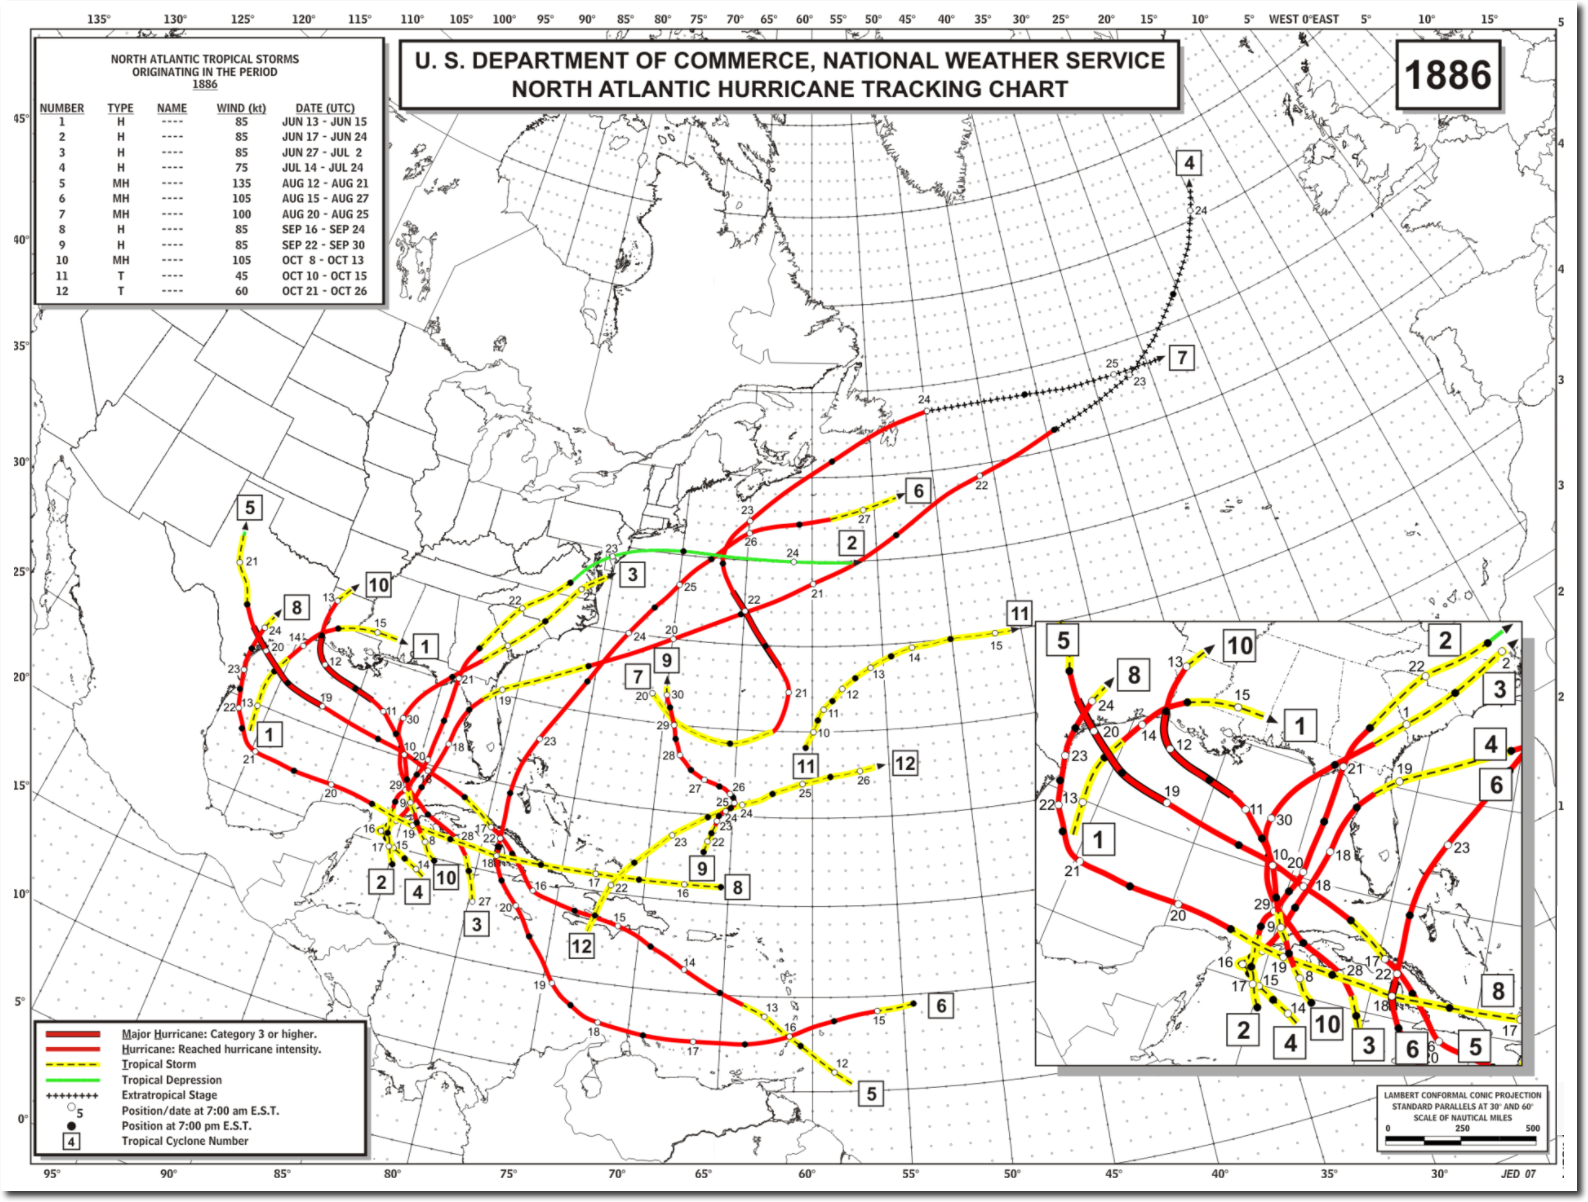
In 1886, Texas was hit by four hurricanes, including two major hurricanes.

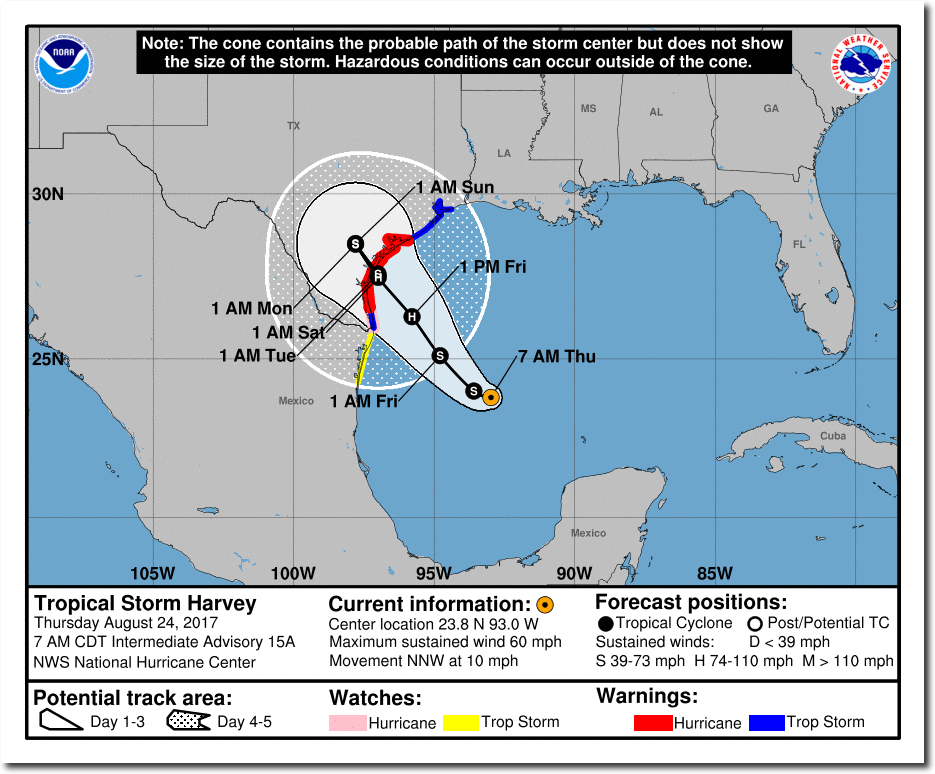
Harvey will be the first Texas hurricane since Ike in 2008, and will of course be blamed on “climate change.”

Posted in Uncategorized | Leave a comment

Global Warming Fraud Washes Away The Integrity Of Science

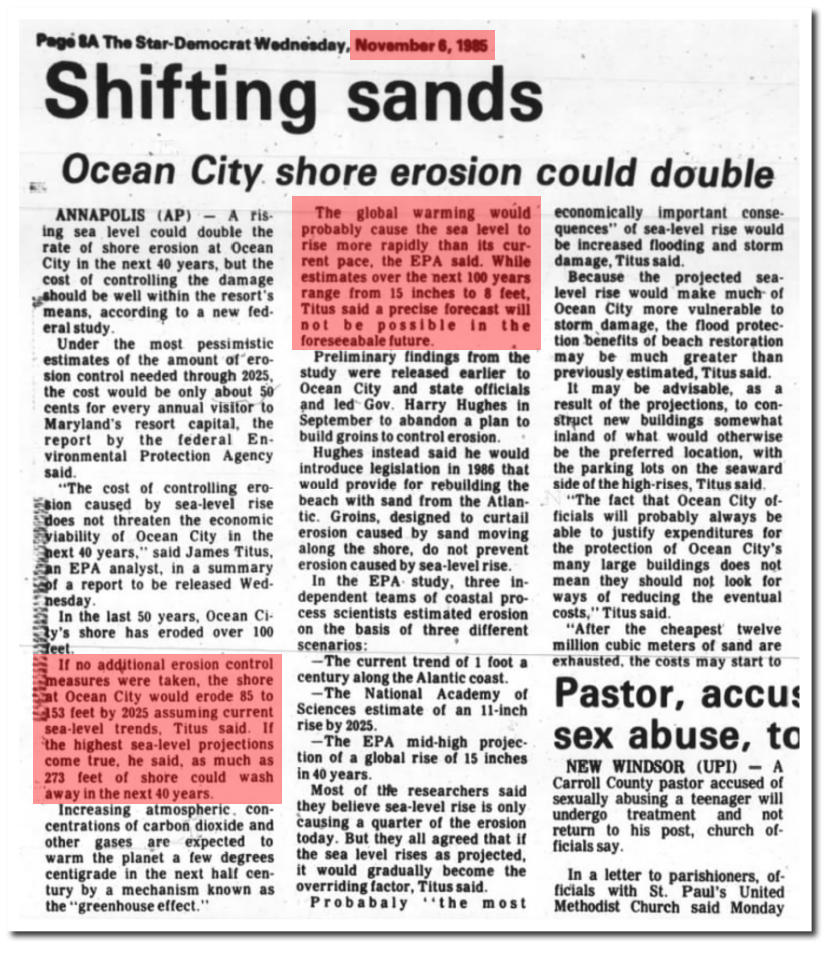
In 1985, the EPA said global warming would wipe out the beach at Ocean City, Maryland by 2025.

273 feet of shore could wash away in the next 40 years.

06 Nov 1985, Page 8 – The Star-Democrat at Newspapers.com

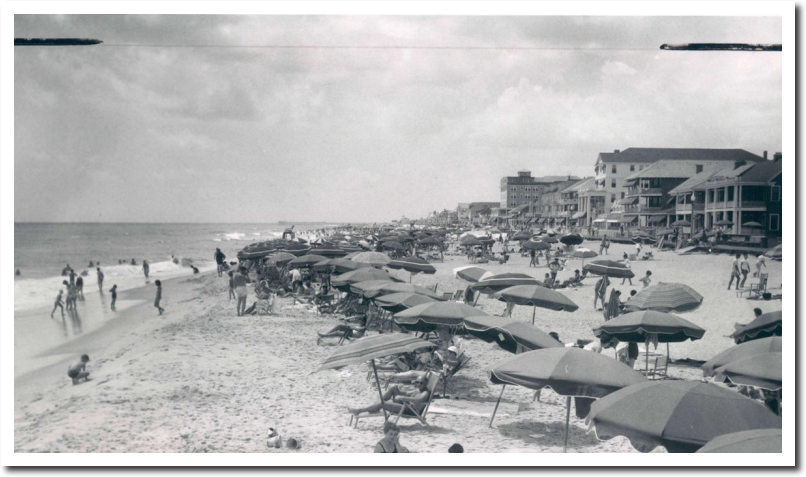
This was the Ocean City Beach in 1919

Exactly the same as 1959

Exactly the same as now.

In climate science, it is all lies, all the time. It is about scaring people out of their money.

Posted in Uncategorized | Leave a comment

Keeping Your Lawn Green

These two ponds are located a half mile apart. This pond is healthy.

This pond is downstream from thousands of people who put chemical fertilizers on their lawn. Algal blooms appeared last year and killed all the fish.

Posted in Uncategorized | Leave a comment

100% Of US Warming Is Fake

Zeke and Nick and all the other apologists for NOAA data tampering claim that adjustments to US temperature are due to Time Of Observation Bias or some other sciencey sounding reason, But the reality is that the data is simply fake.

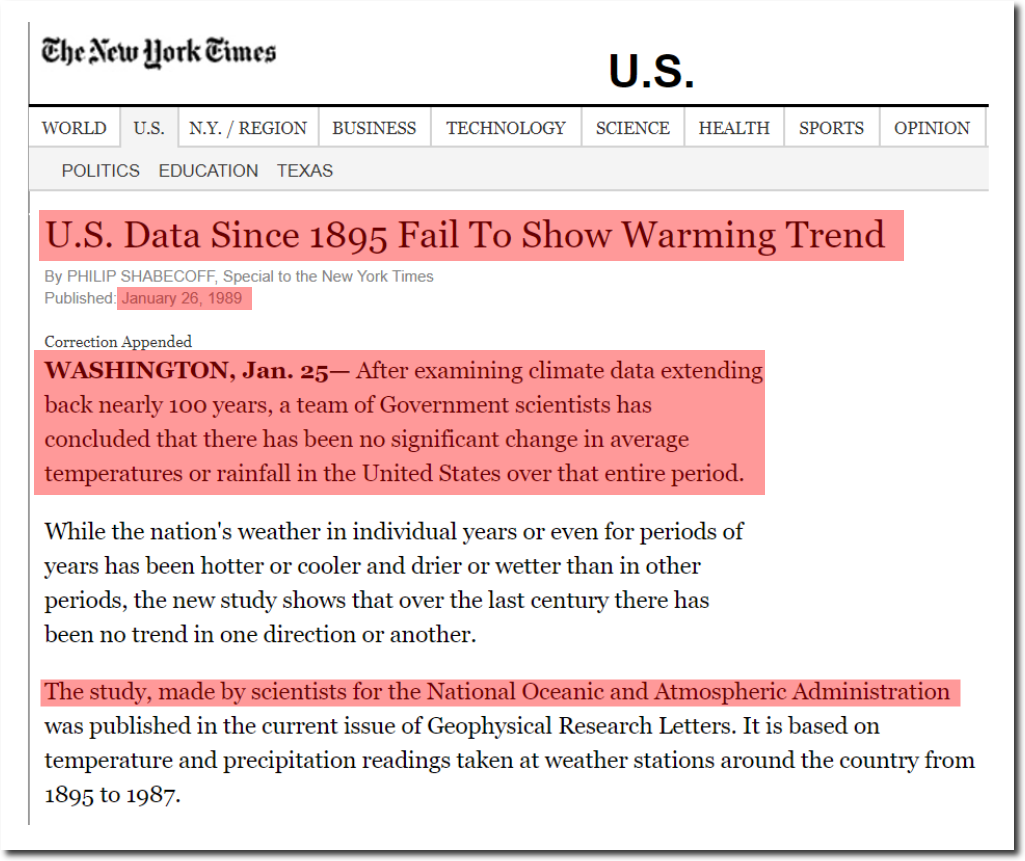
In 1989, NOAA reported no US warming since 1895.

U.S. Data Since 1895 Fail To Show Warming Trend

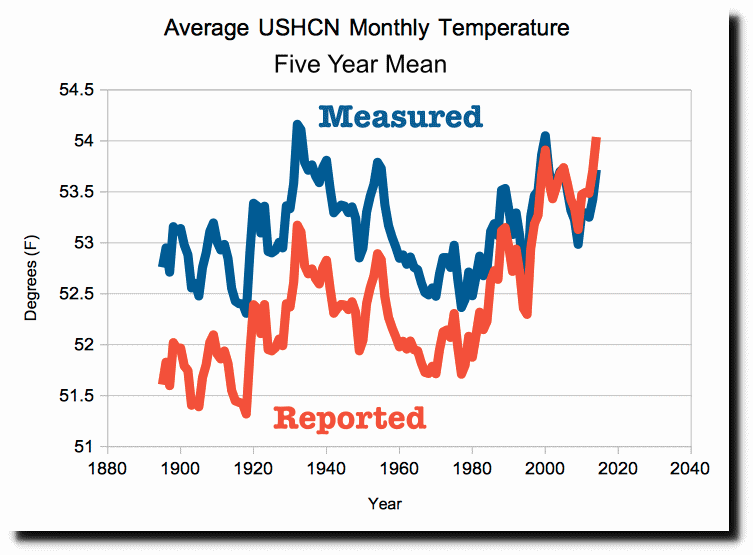
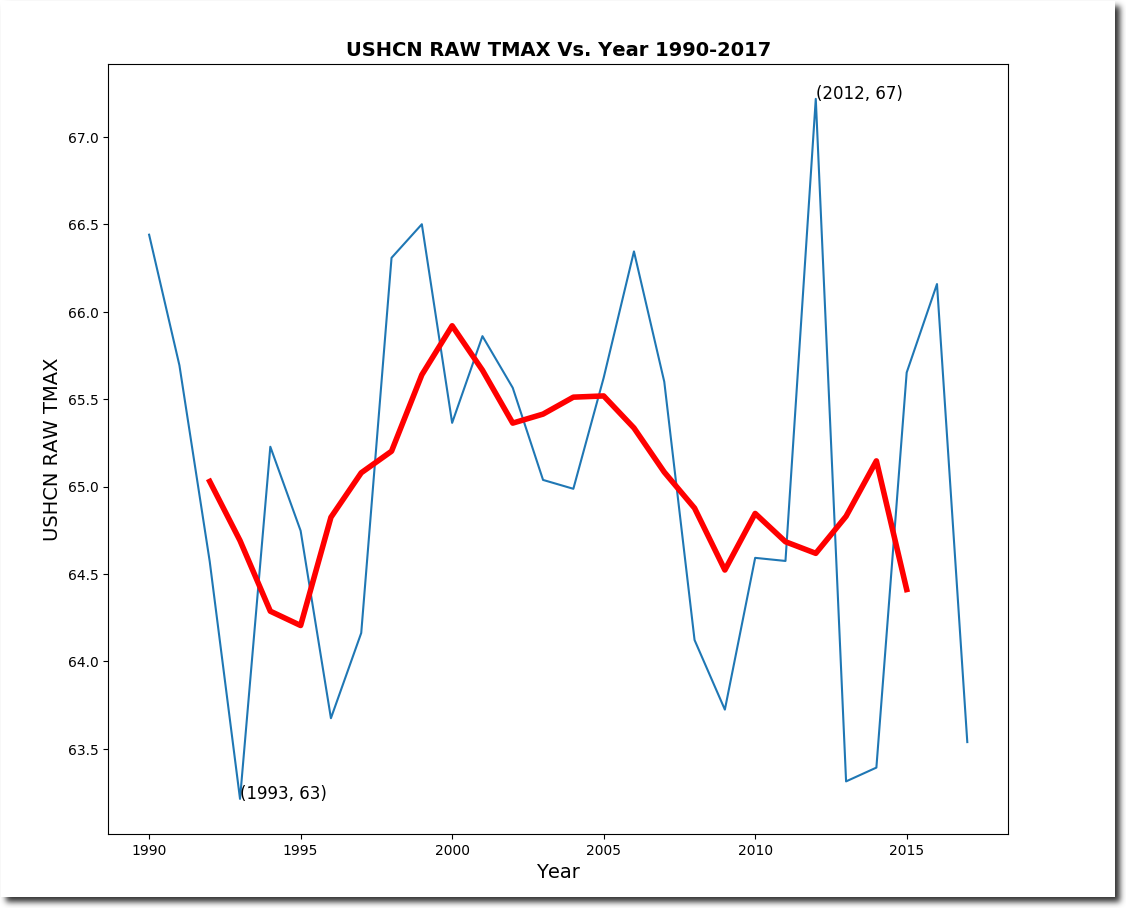
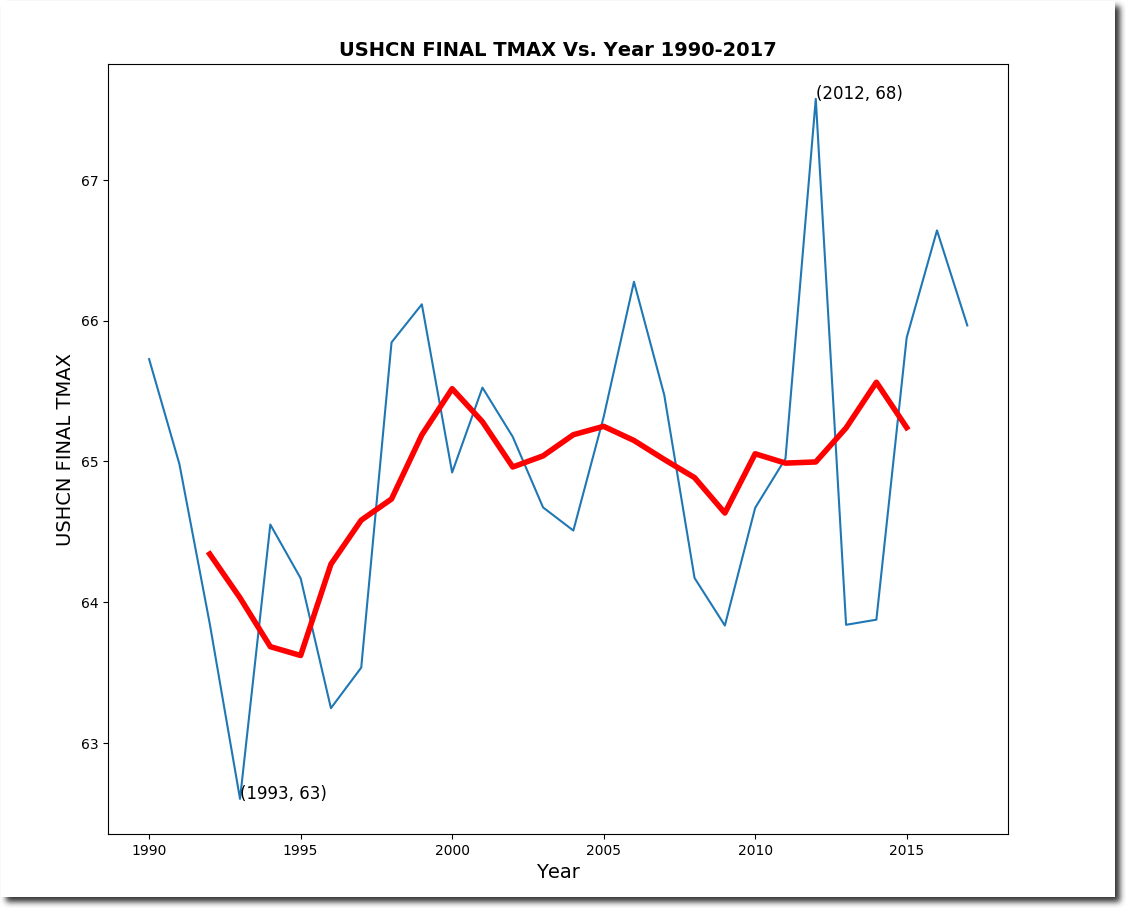
So what has been happening since 1990? The measured NOAA data shows no warming.

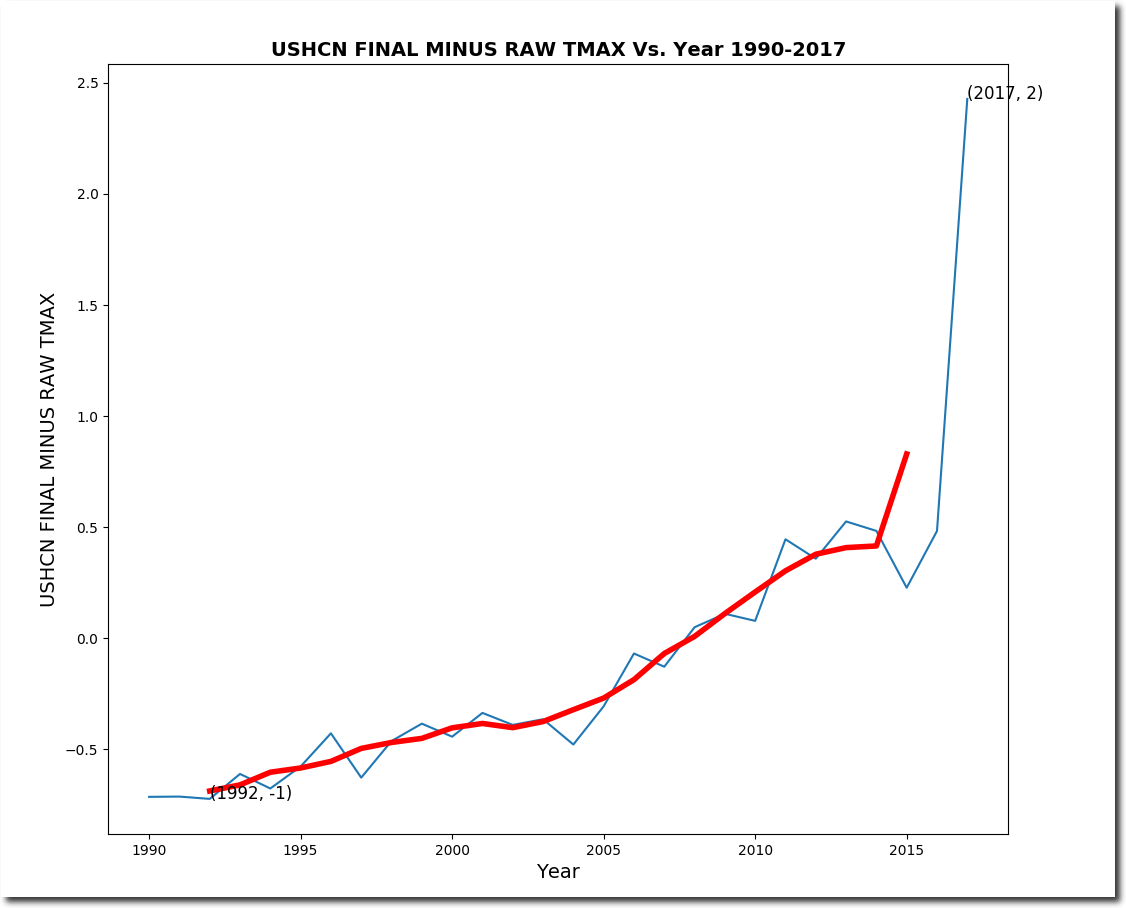
But the adjusted data shows a lot of warming.

The adjustments form a familiar hockey stick of data tampering.

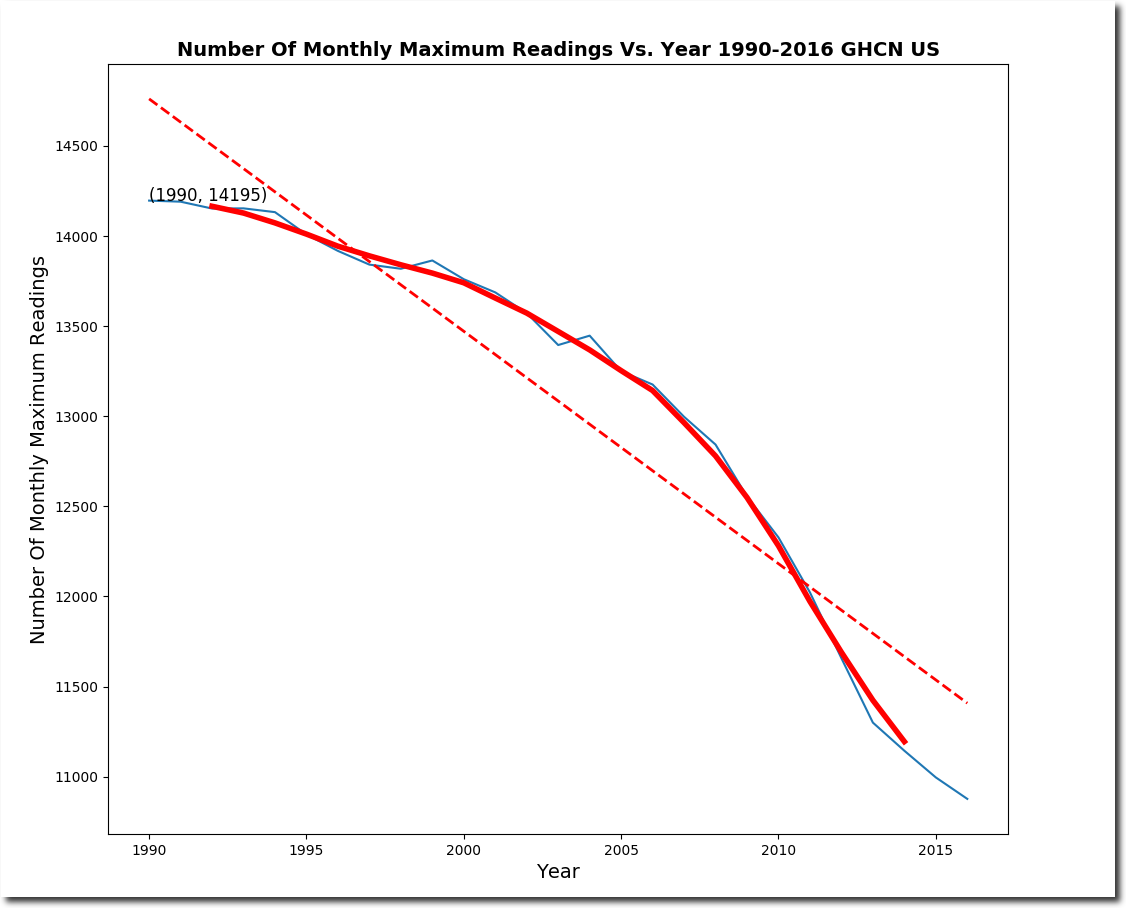
Let’s look at what NOAA is doing to make this happen. Since 1990, NOAA has been losing monthly temperature data at a phenomenal rate. When they don’t have real data, they simply make up fake data. Almost 50% of their “adjusted” data is now fake, but in 1991 it was only 16% fake.

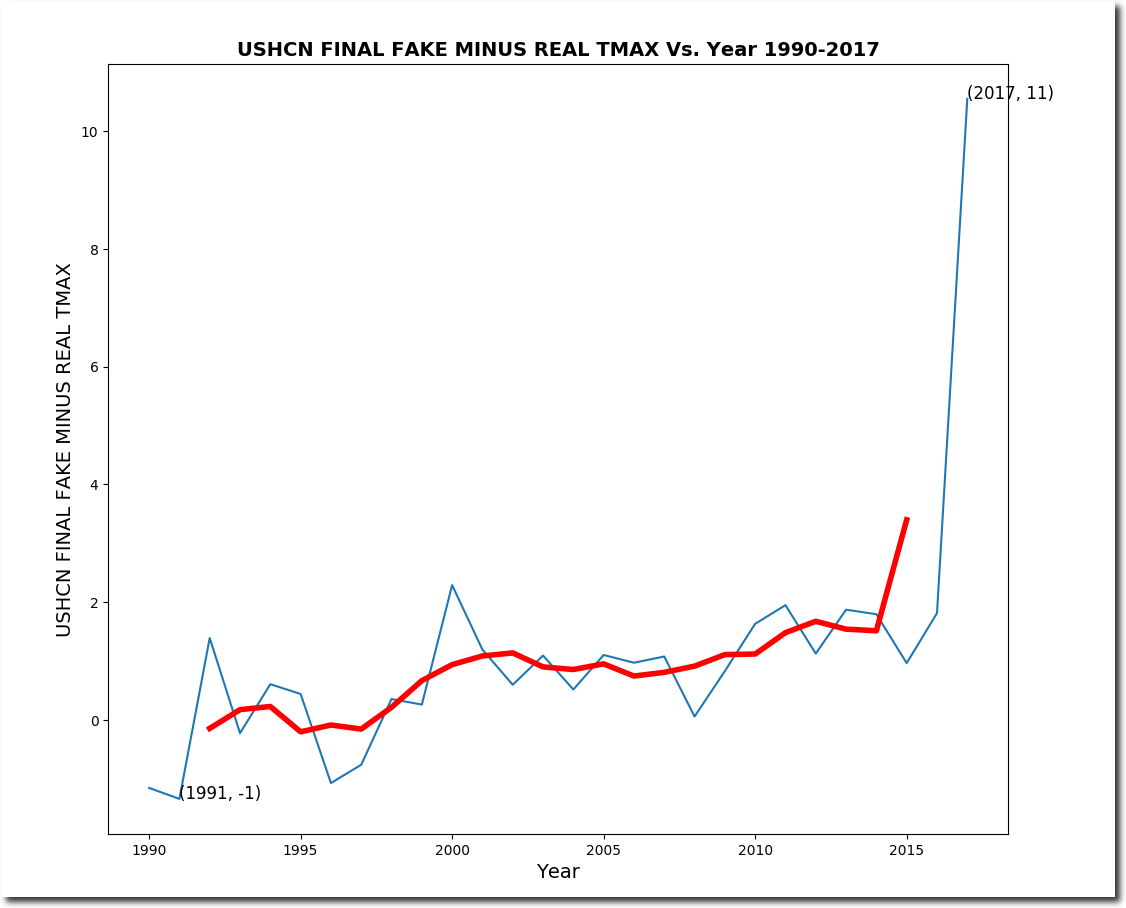
I split up the NOAA adjusted (Final) data into two categories – “real” data has underlying thermometer data, and “fake” data has no underlying thermometer data. The “real” adjusted data shows very little warming.

Bu the fake adjusted data shows lots of warming.

The infilling of fake adjusted data (no underlying thermometer data) corrupts the US temperature data in a spectacular hockey stick.

But it is much worse than it seems. The graph below plots the real adjusted (blue) and fake adjusted (red) trends for all 1200 USHCN stations. NOAA is consistently infilling missing cold temperatures with fake warm temperatures, across the board and across the country. How cynical can they get?

When confronted about their data tampering, they say “our algorithm works exactly as designed.”

In other words, the fraud is intentional. But I’m not done yet. The fraud is worse than it seems (if that is possible.)  Almost 50% of USHCN adjusted data is now fake, but they have only lost 25% of their data. So  they are throwing out a large percentage of their measured data.

The next phase of my discovery process will be to find out what type of measured data they are throwing out and replacing with fake data. But it seems a safe bet that they are tossing measured cold data, and replacing it with fake hot data.

This is the biggest and most cynical scam in science history.

Posted in Uncategorized | Leave a comment

New UNHIDING THE DECLINE Release

Lots of new stuff, but the most noticeable is KML file generation for Google Earth

above_maximum_threshold_90.0_7141936.kml

Linux/Mac : python3 ghcn.py US.txt date=07141936

Windows : ghcn.exe US.txt date=07141936

Follow the directions here to get the latest.  First time Linux/Mac users will also have to  execute these lines from a terminal window.

python3 -m pip install matplotlib
python3 -m pip uninstall numpy
python3 -m pip install numpy==1.12.1

Posted in Uncategorized | Leave a comment

Arctic Fake News Update

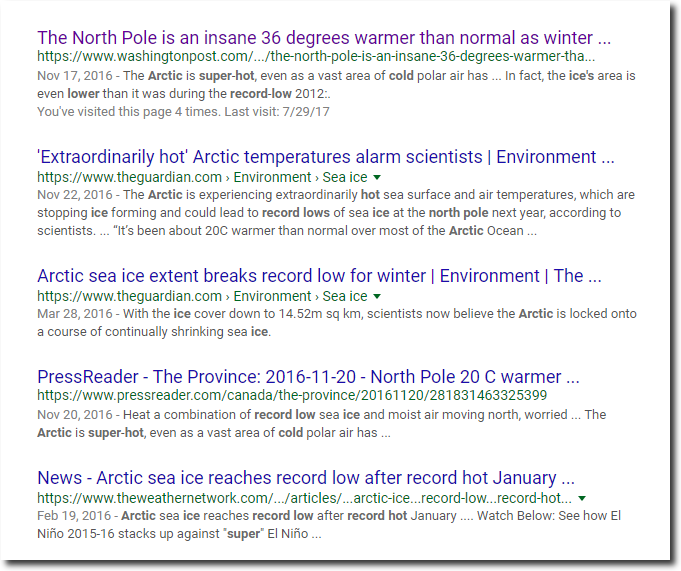
All year long, the criminals and useful idiots in the press have been telling us how hot the Arctic is, and ice extent is at a record low.

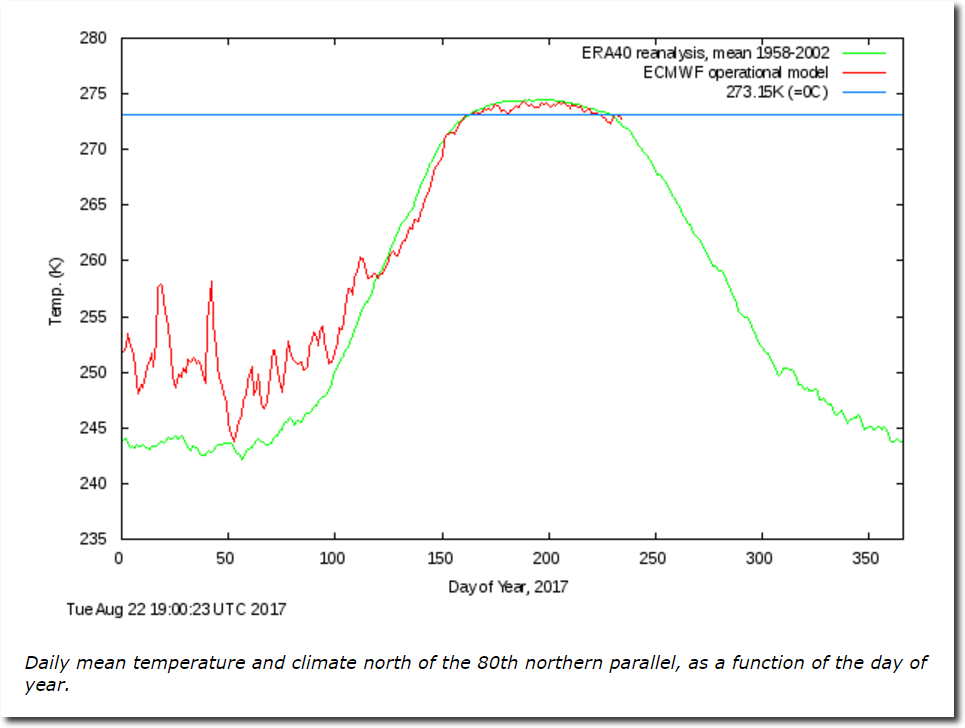
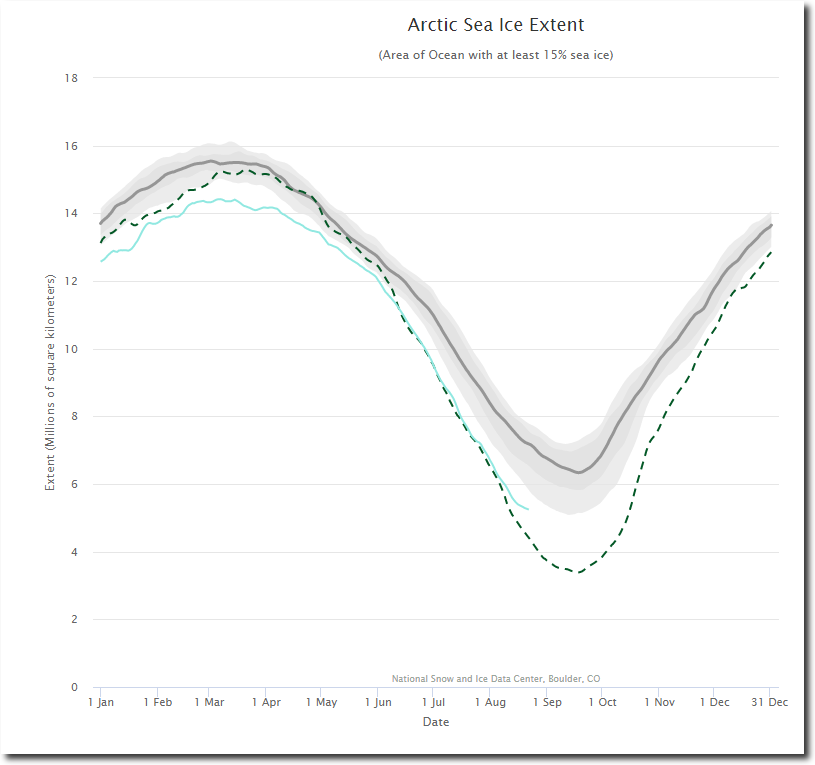
The actual North Pole was below normal temperature every single day during the melt season, and appears headed for the highest summer minimum extent in years.

Ocean and Ice Services | Danmarks Meteorologiske Institut

Charctic Interactive Sea Ice Graph | Arctic Sea Ice News and Analysis

The press will of course be silent about this information, because they are Orwellian fake news. 97% of all climate stories are 100% fake, and the other 3% are 97% fake.

Posted in Uncategorized | Leave a comment

Why They Need To Hide The 1940’s Blip

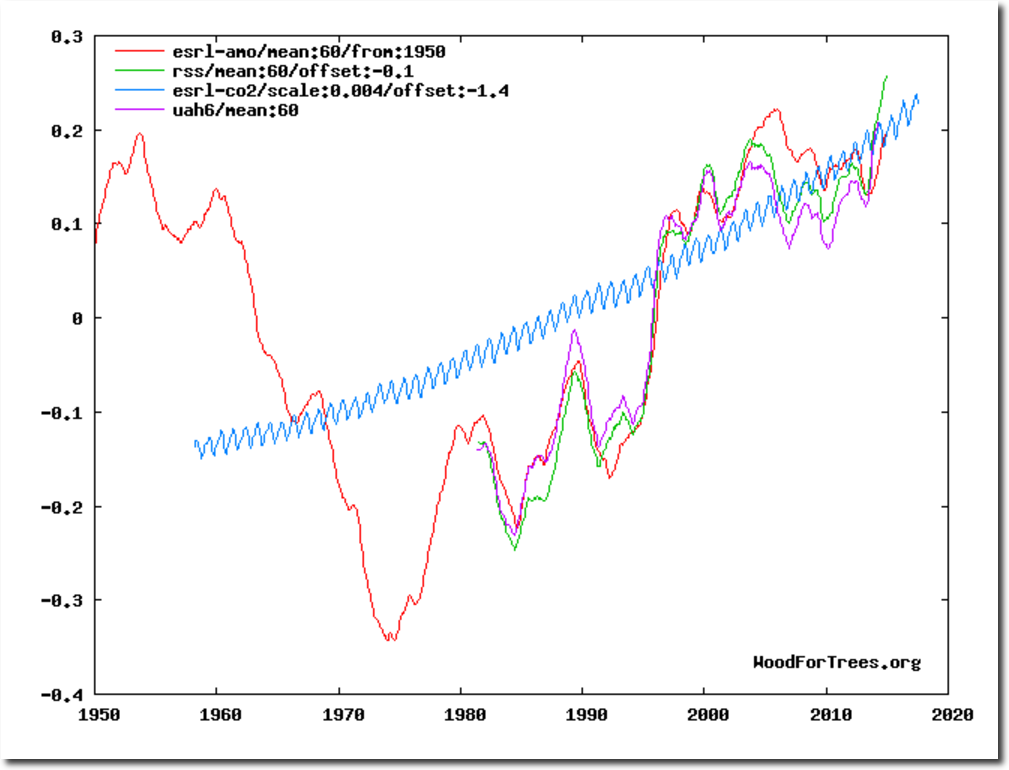
Troposphere temperatures show very close correlation with the Atlantic Multidecadal Oscillation (AMO) and essentially no correlation with CO2.

Wood for Trees: Interactive Graphs

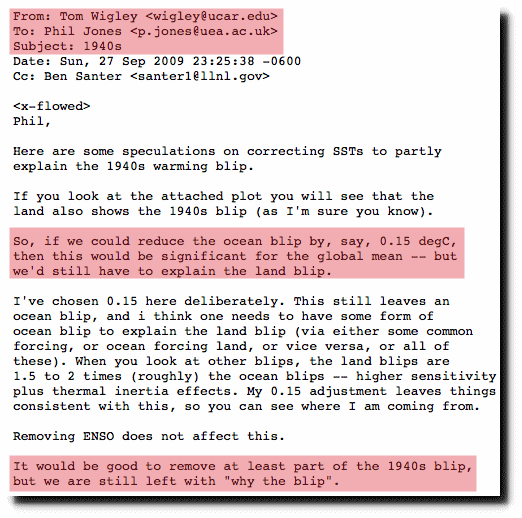
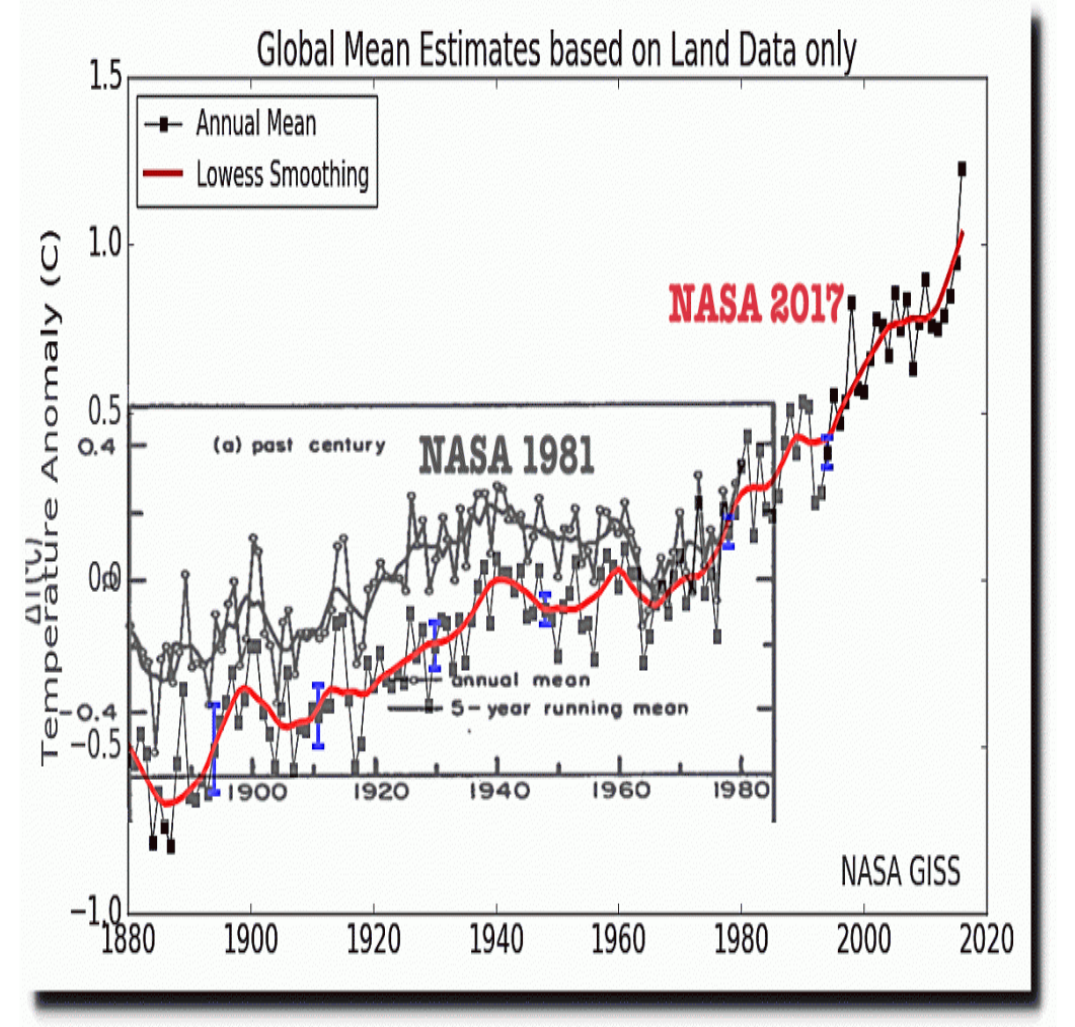
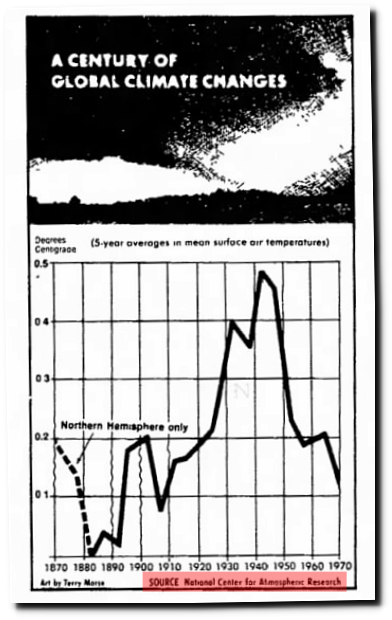
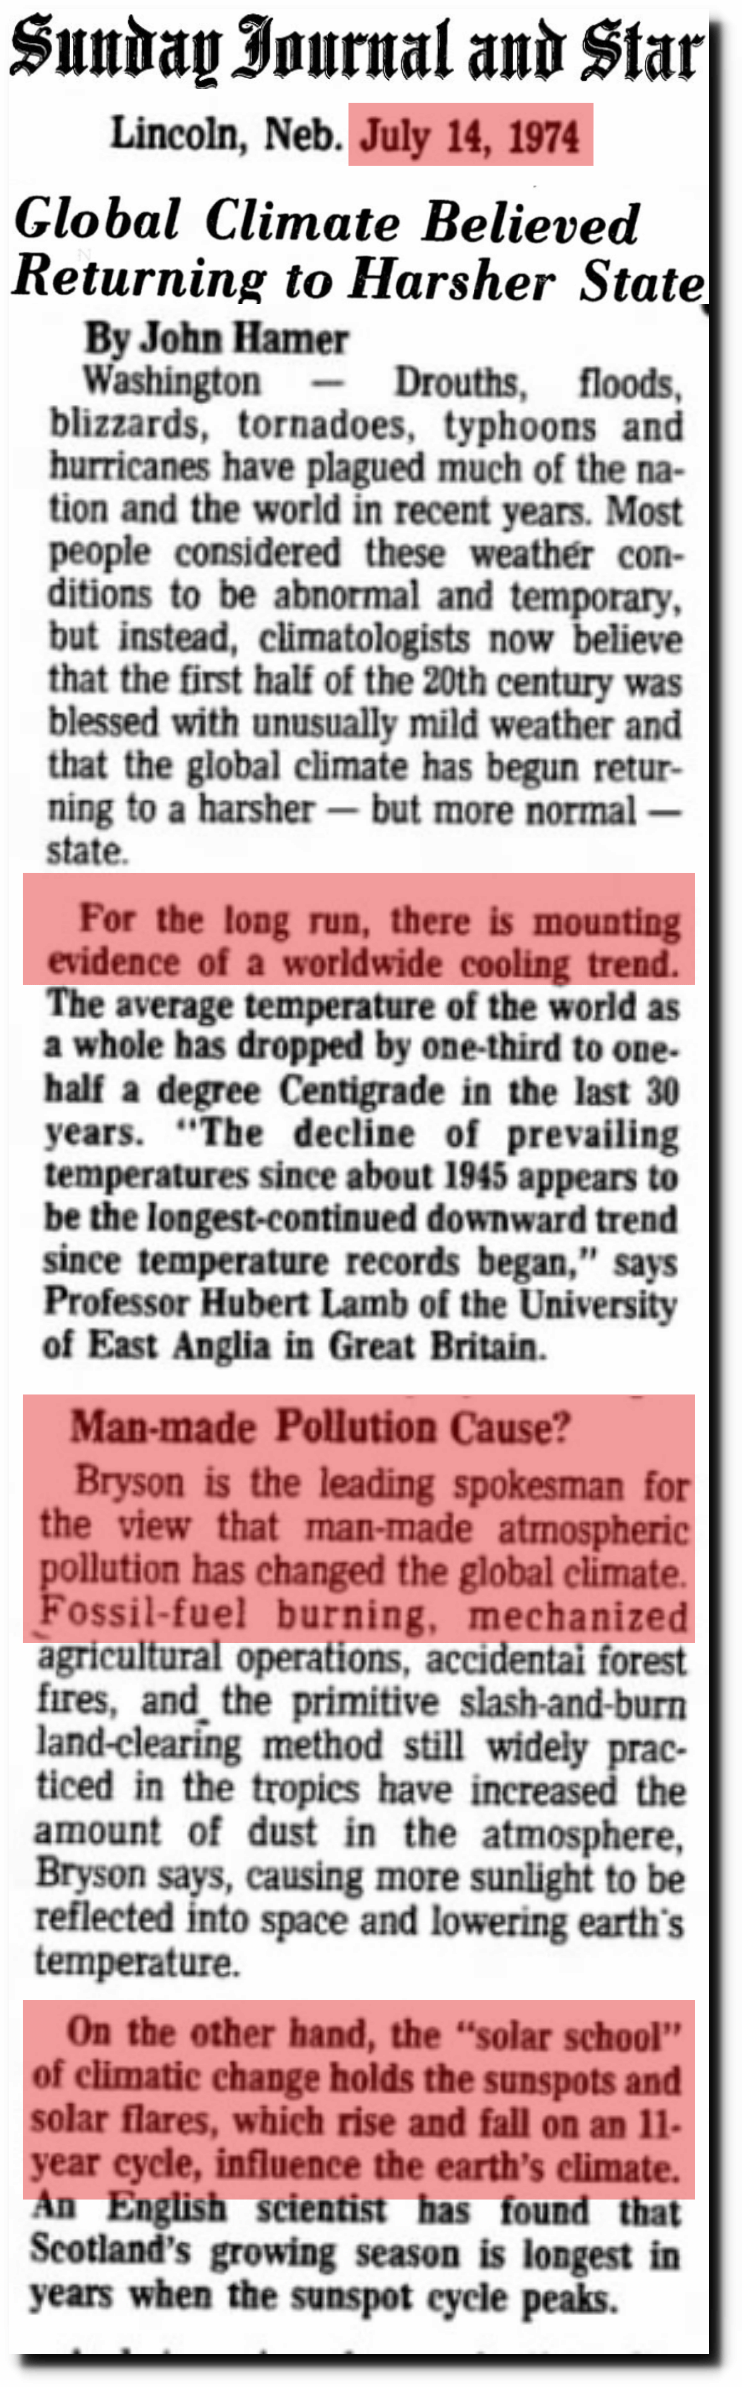
That is why government agencies have worked so hard to remove the 1940s blip.

di2.nu/foia/1254108338.txt

1981 version     2017 version

14 Jul 1974, Page 1 – Lincoln Evening Journal at Newspapers.com

If they didn’t hide the blip, it would become obvious that Earth was probably warmer in the 1940’s than it is now, and that global temperatures have almost nothing to do with CO2.

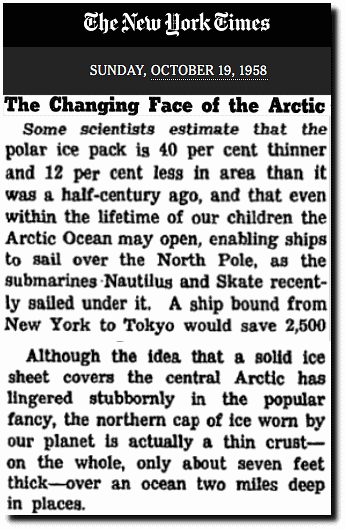
The Changing Face of the Arctic; The Changing Face of the Arctic – The New York Times

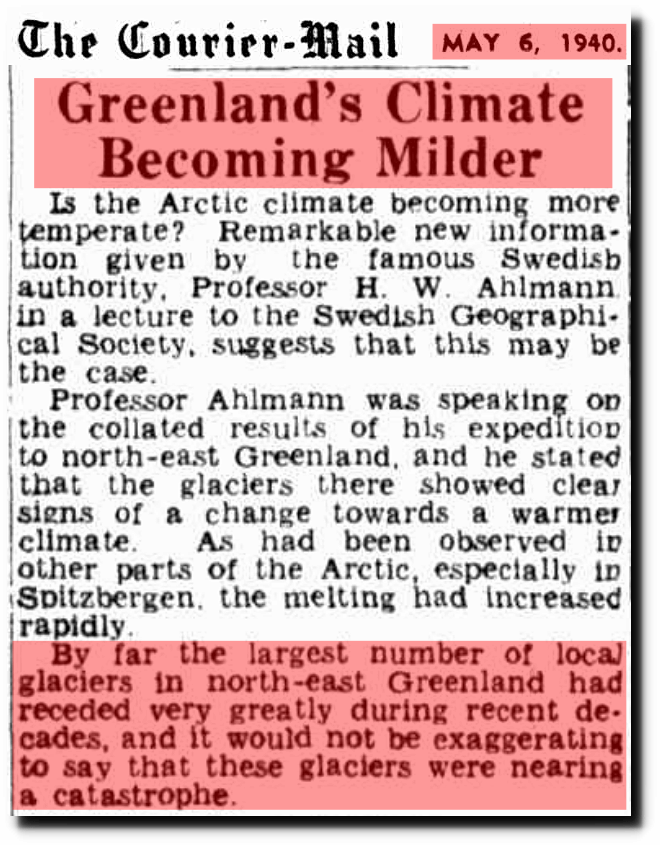
06 May 1940 – Greenland’s Climate Becoming Milder 

Billions of dollars in climate scam funding depends on fake temperature graphs from NASA and NOAA.

Posted in Uncategorized | Leave a comment