



Disrupting the Borg is expensive and time consuming!

Google Search
-
Recent Posts
- Fifty Years Ago Today
- Truth Or Consequences
- US Climate Trend Maps
- Declining Spring Snow Cover In Northern New Mexico
- You Can’t Fool Mother Nature
- Cattle And The Climate
- One Atomic Bomb Per Hour
- New Video : Analyzing Oil And Gas
- Is Antarctica Melting?
- High Speed Analysis And Visualization
- El Nino To The Rescue?
- Fake News Update
- Growth Of Antarctic Sea Ice
- 65 Years Of Progress!
- El Nino To The Rescue?
- Worst March Drought On Record
- ChartGL Process Control Demo
- The Biggest Money Laundering Scam
- Drought In The Headwaters Of Lake Powell
- Unrealistic Expectations Of Water Availability
- Did Bill Gates Do This?
- Worst March Drought On Record In The US
- The Real Hockey Stick Graph
- Analyzing The Western Water Crisis
- Gaslighting 1924
Recent Comments
- Bob G on Truth Or Consequences
- Weylan McAnally on One Atomic Bomb Per Hour
- conrad ziefle on Declining Spring Snow Cover In Northern New Mexico
- Bob G on You Can’t Fool Mother Nature
- Ivan G Wainwright on You Can’t Fool Mother Nature
- conrad ziefle on You Can’t Fool Mother Nature
- Bob G on You Can’t Fool Mother Nature
- Gordon Vigurs on You Can’t Fool Mother Nature
- arn on Cattle And The Climate
- Bob G on Cattle And The Climate
No Excuse For Data Tampering
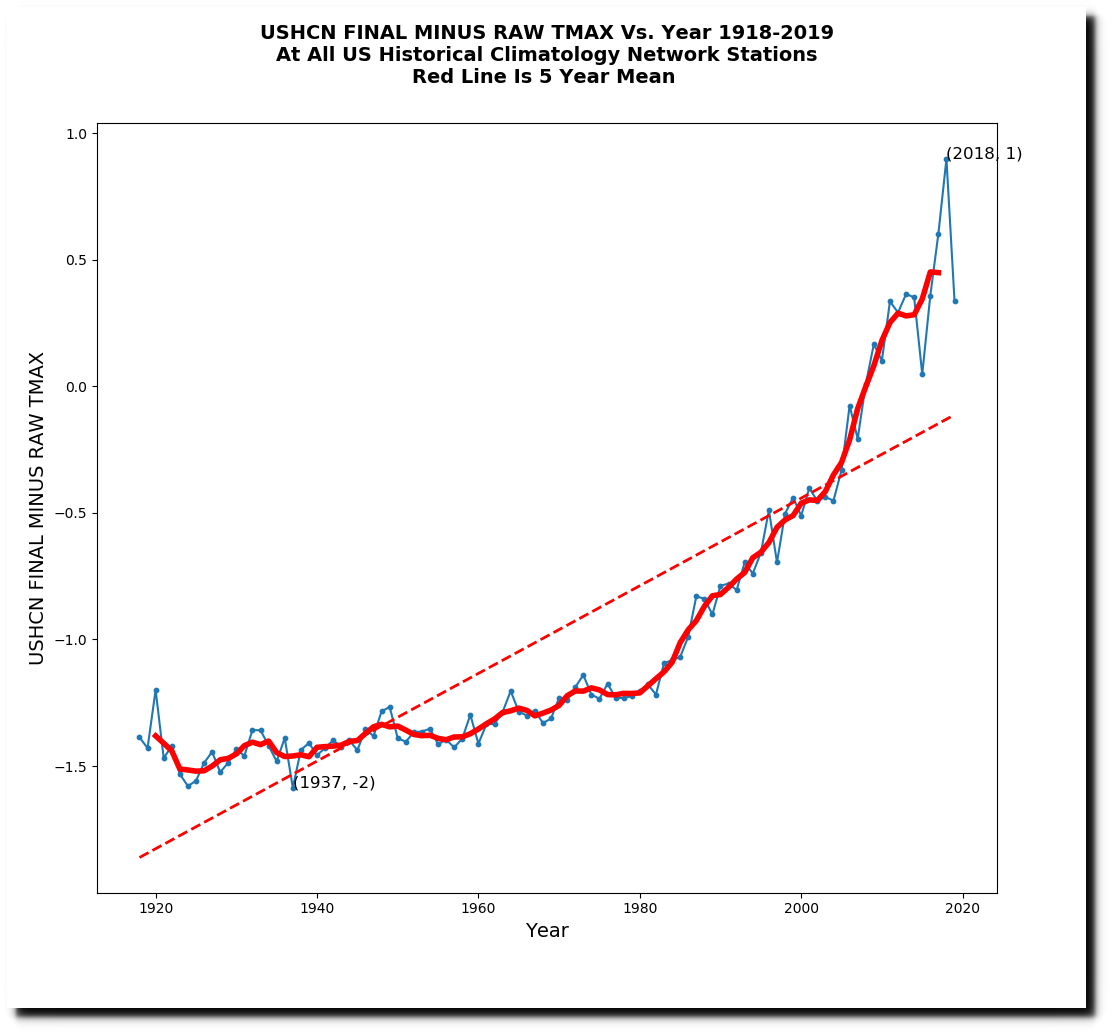
NOAA shows US afternoon temperatures increasing over the past century.
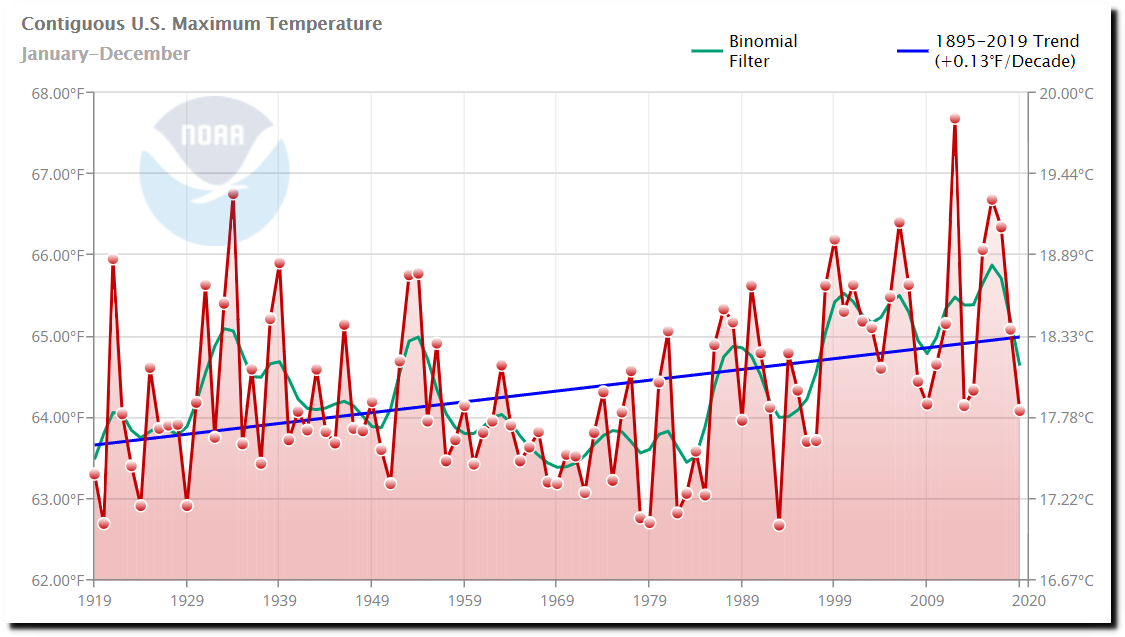
Climate at a Glance | National Centers for Environmental Information (NCEI)
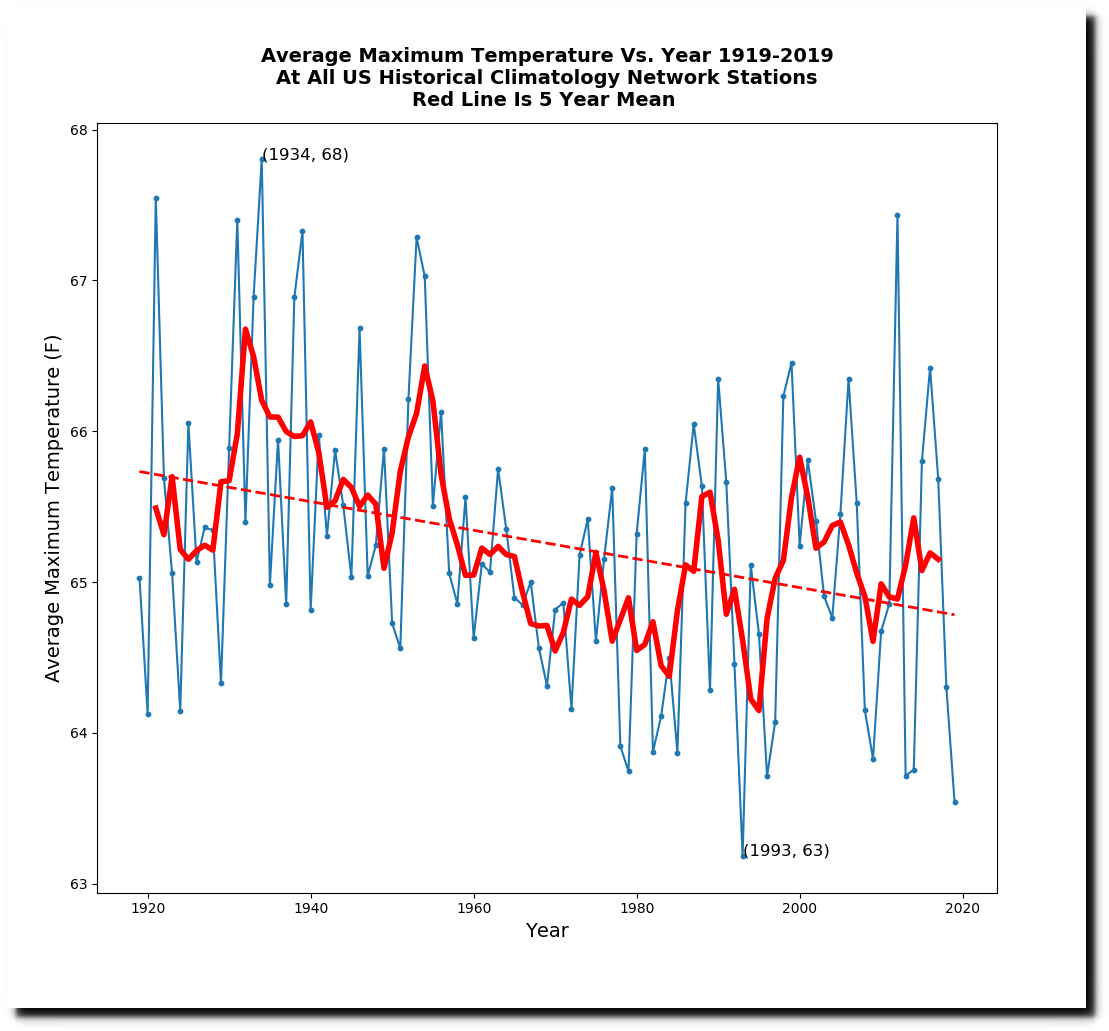
The raw data shows the exact opposite.
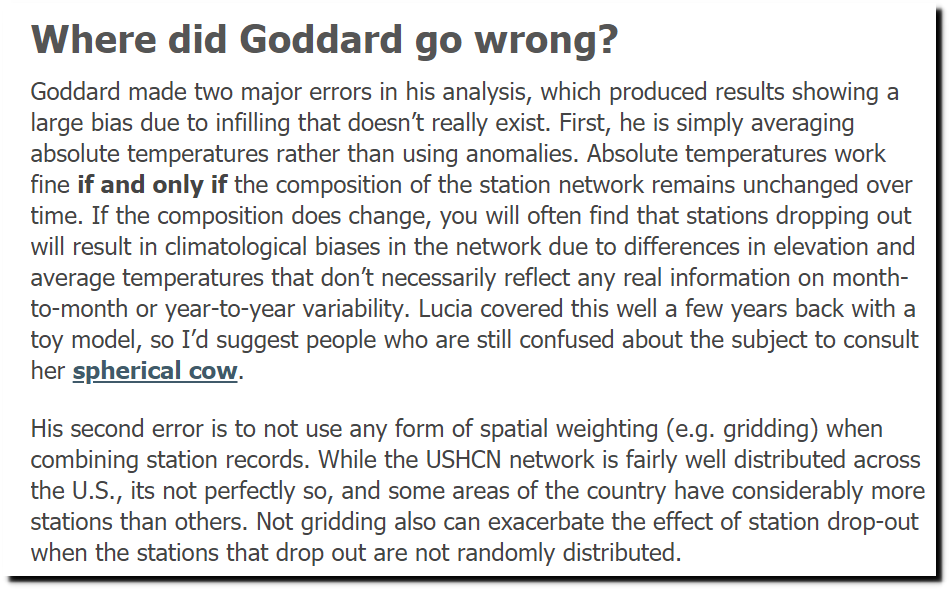
Zeke Hausfather explained why they tamper with the data, and said that I made “major errors” by not tampering with the data like he does.
The Blackboard » How not to calculate temperature
Zeke’s first excuse for data tampering was “changing station composition” – meaning that the USHCN station set has changed over time. It is simple enough to eliminate that problem by using only a stable set of stations. The map below shows all USHCN stations which were active in both 1919 and 2019.
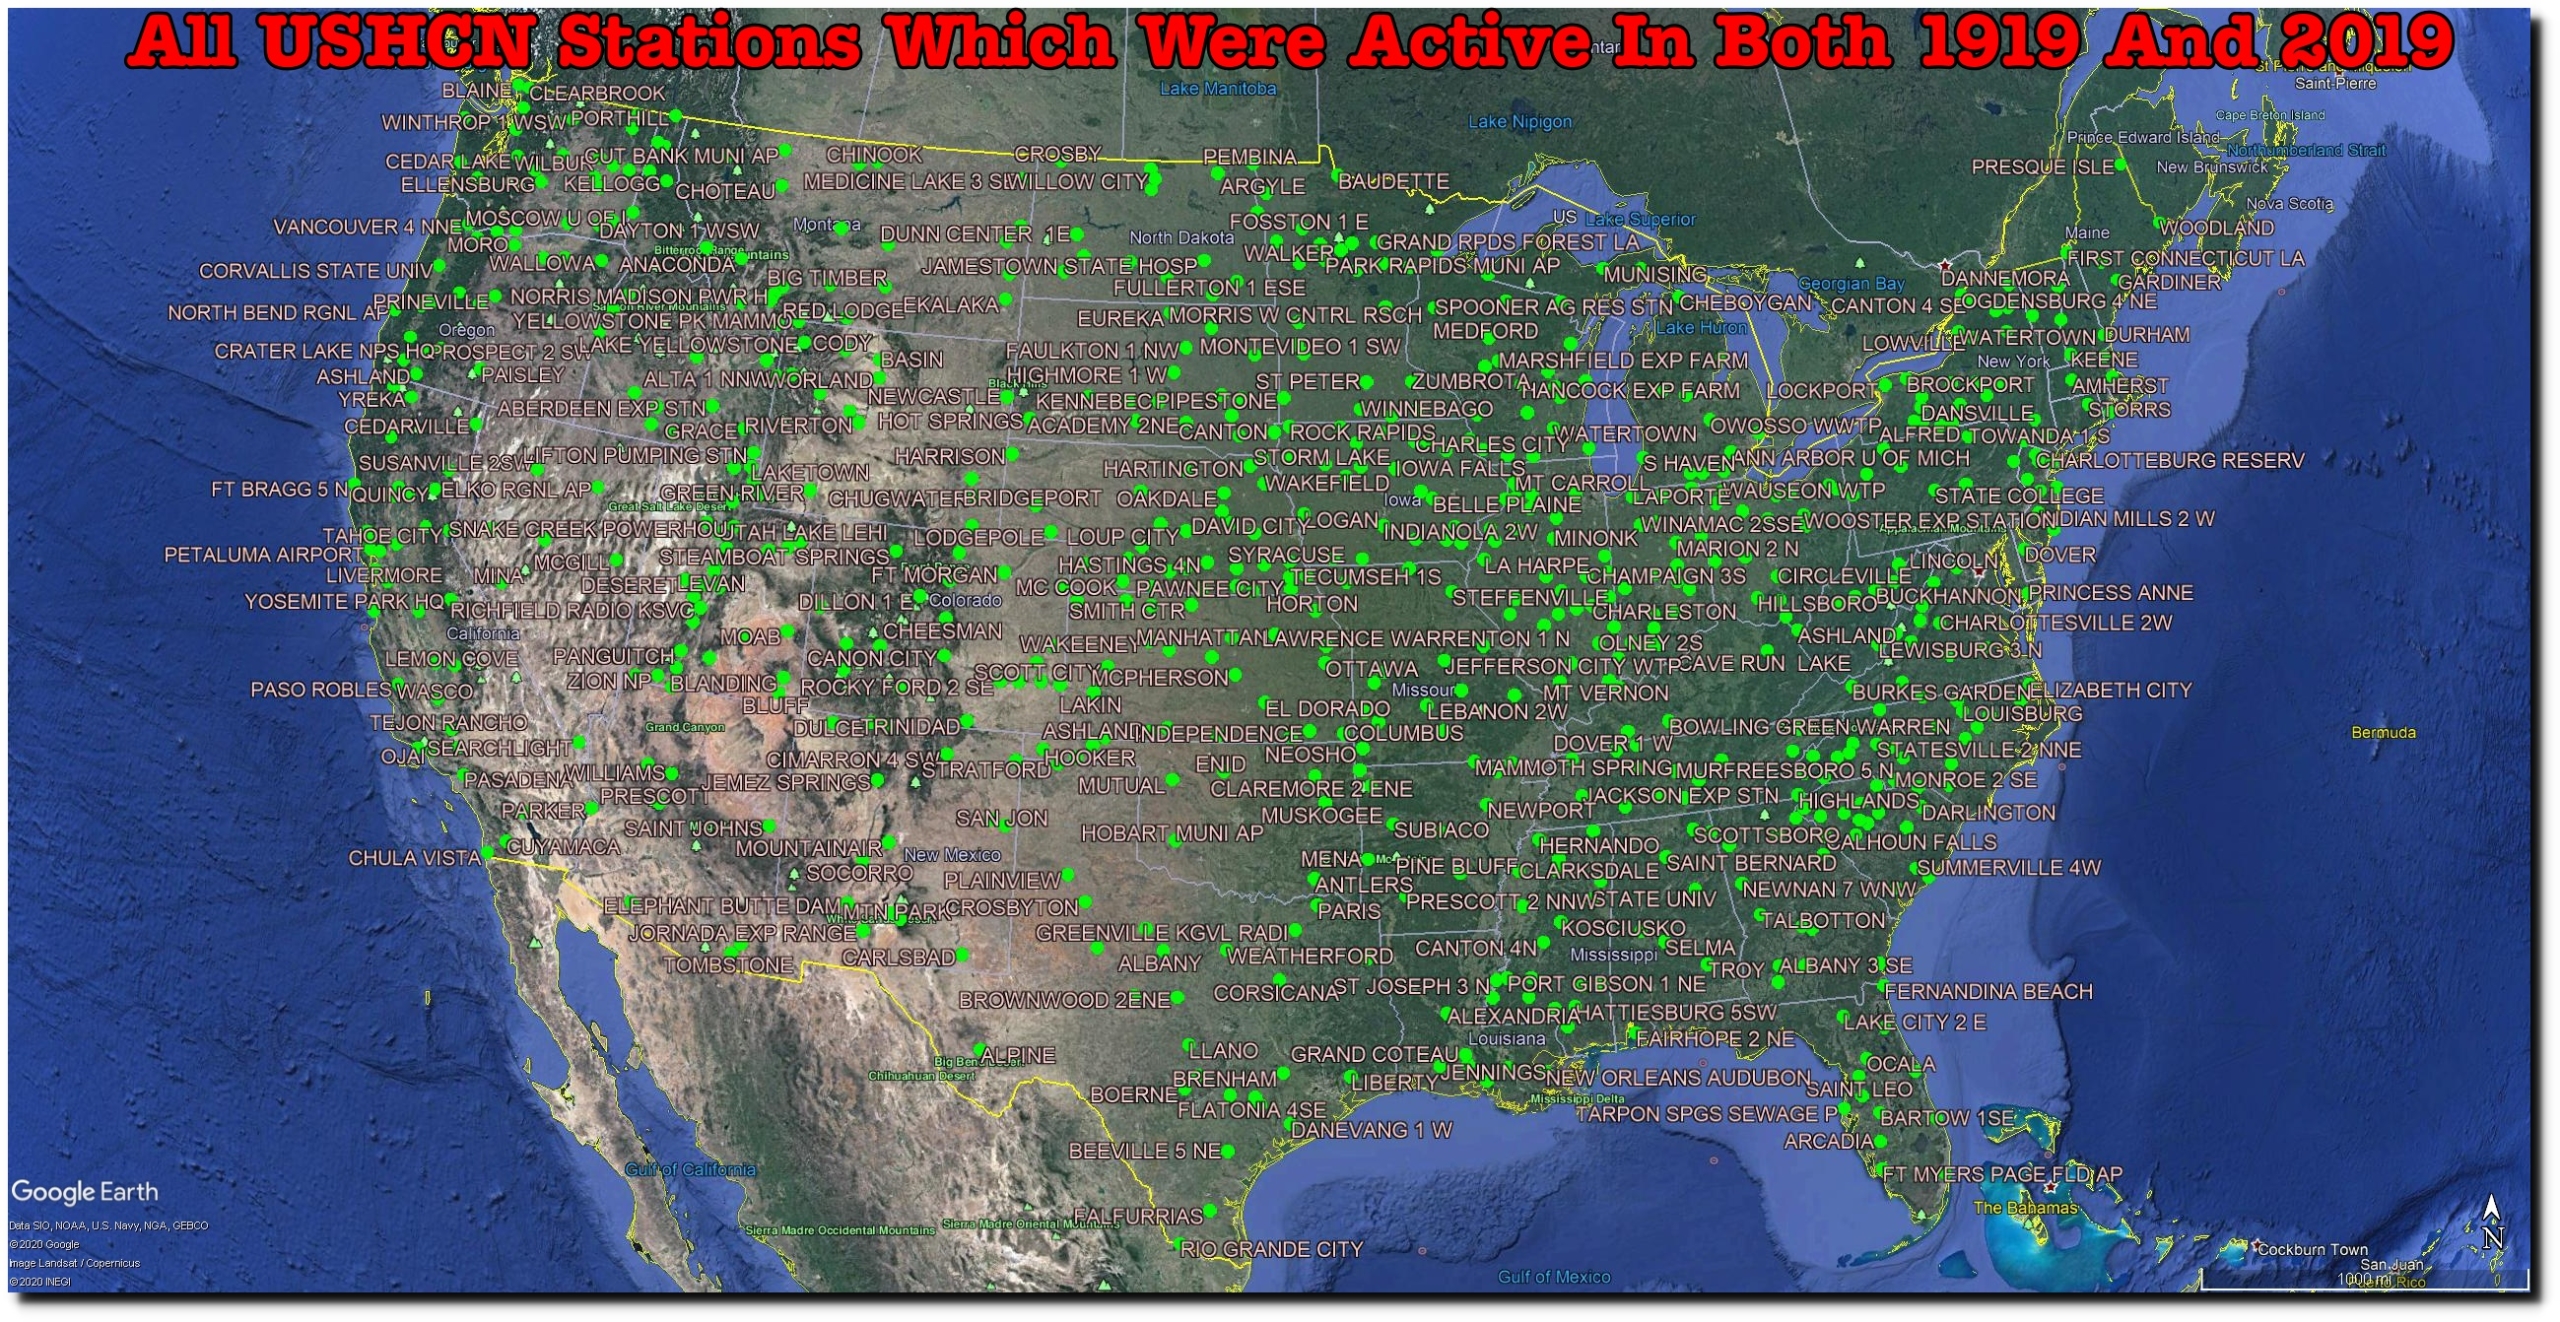
The average elevation and latitude of this set of stations has hardly changed over the past century.
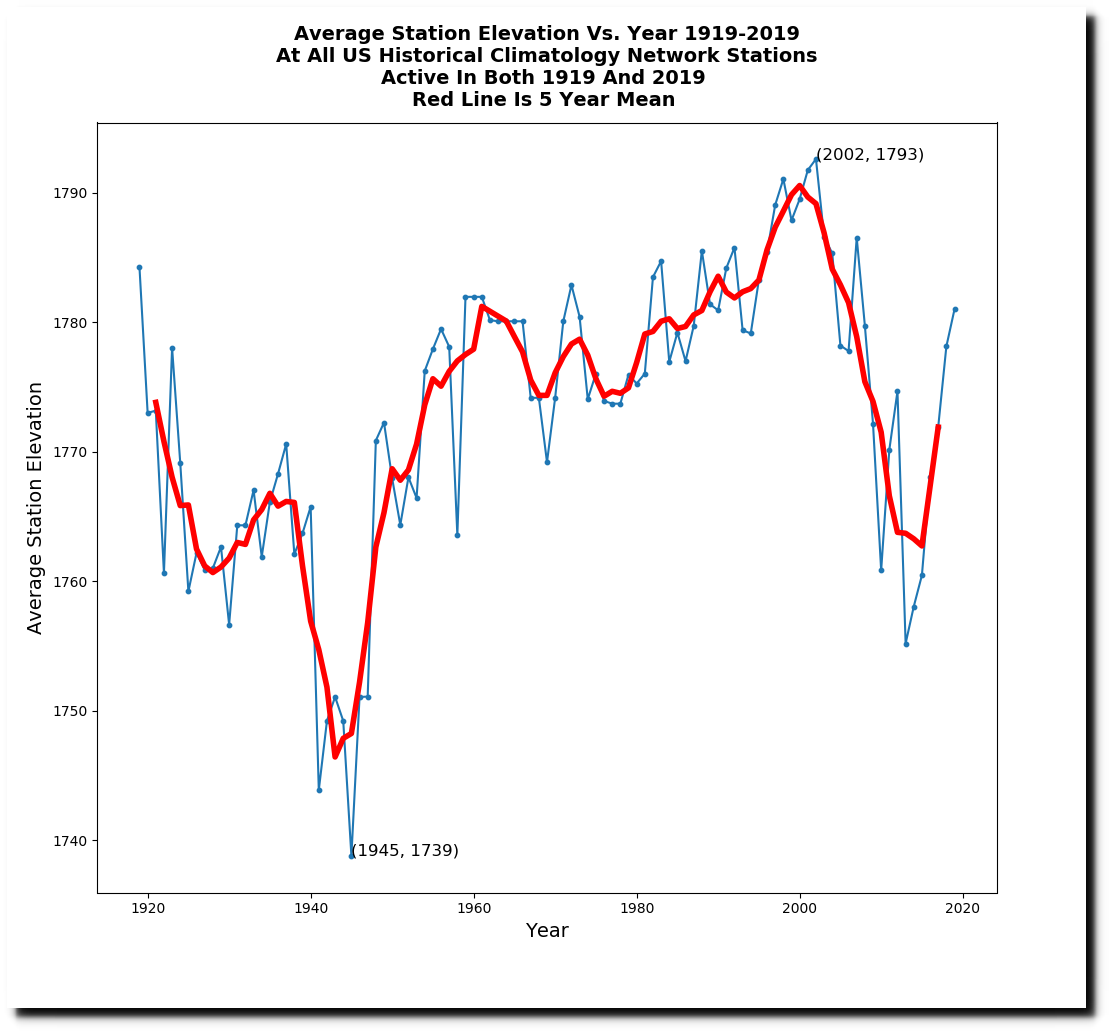
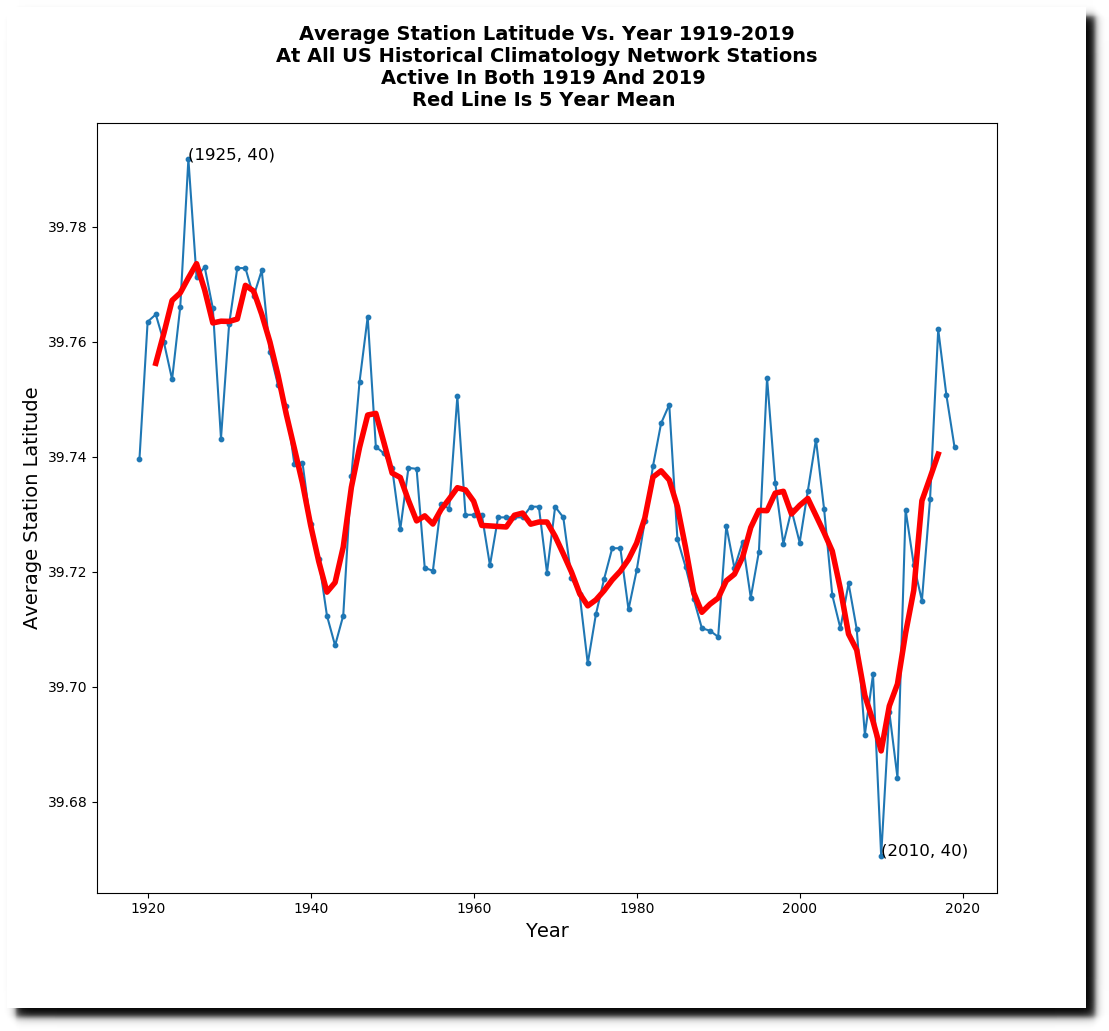
I calculated the trend averages and trend for this set of stations, and it is not very different from the set of all stations. Changing station composition has minimal impact. What does have a major impact is that NOAA fabricates data for hundreds of stations which no longer exist.

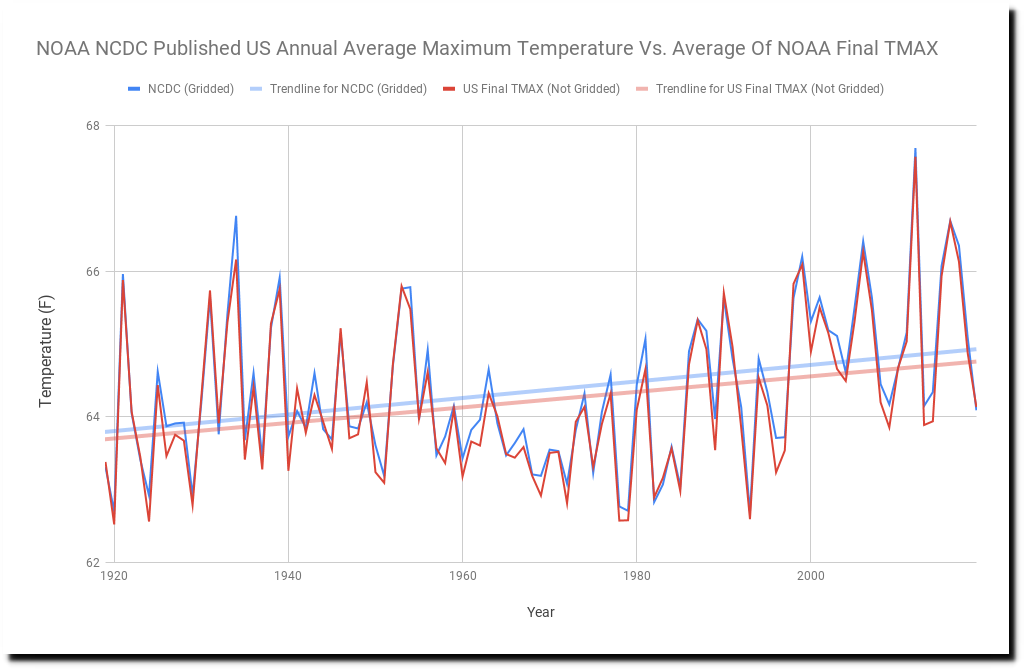
Second complaint from Zeke was that I don’t grid the data. The importance of gridding is simple enough to test out. The graph below compares NCDC gridded temperatures vs. my simple average of the USHCN Final (adjusted) temperatures. Once again, there is very little difference, indicating that gridding has minimal effect.
The third standard excuse is time of observation bias. NOAA believes that most stations used to take readings in the afternoon, which caused double counting of hot days, and thus the past needs to be adjusted downwards. Once again, this is simple enough to test out, by splitting up the data set into morning and afternoon stations from 1936, which was the hottest summer on record.) And once again, the trend is scarcely different between the two.

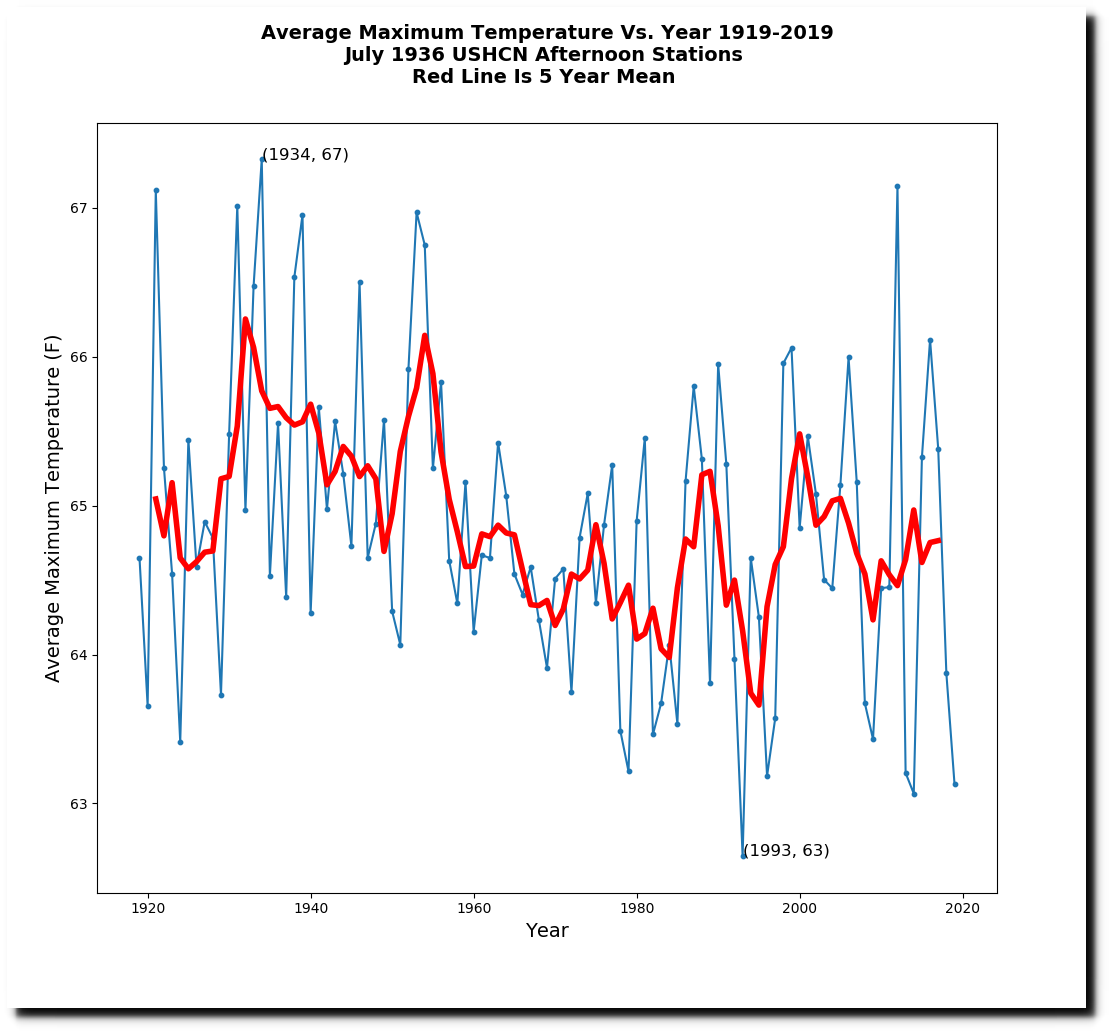
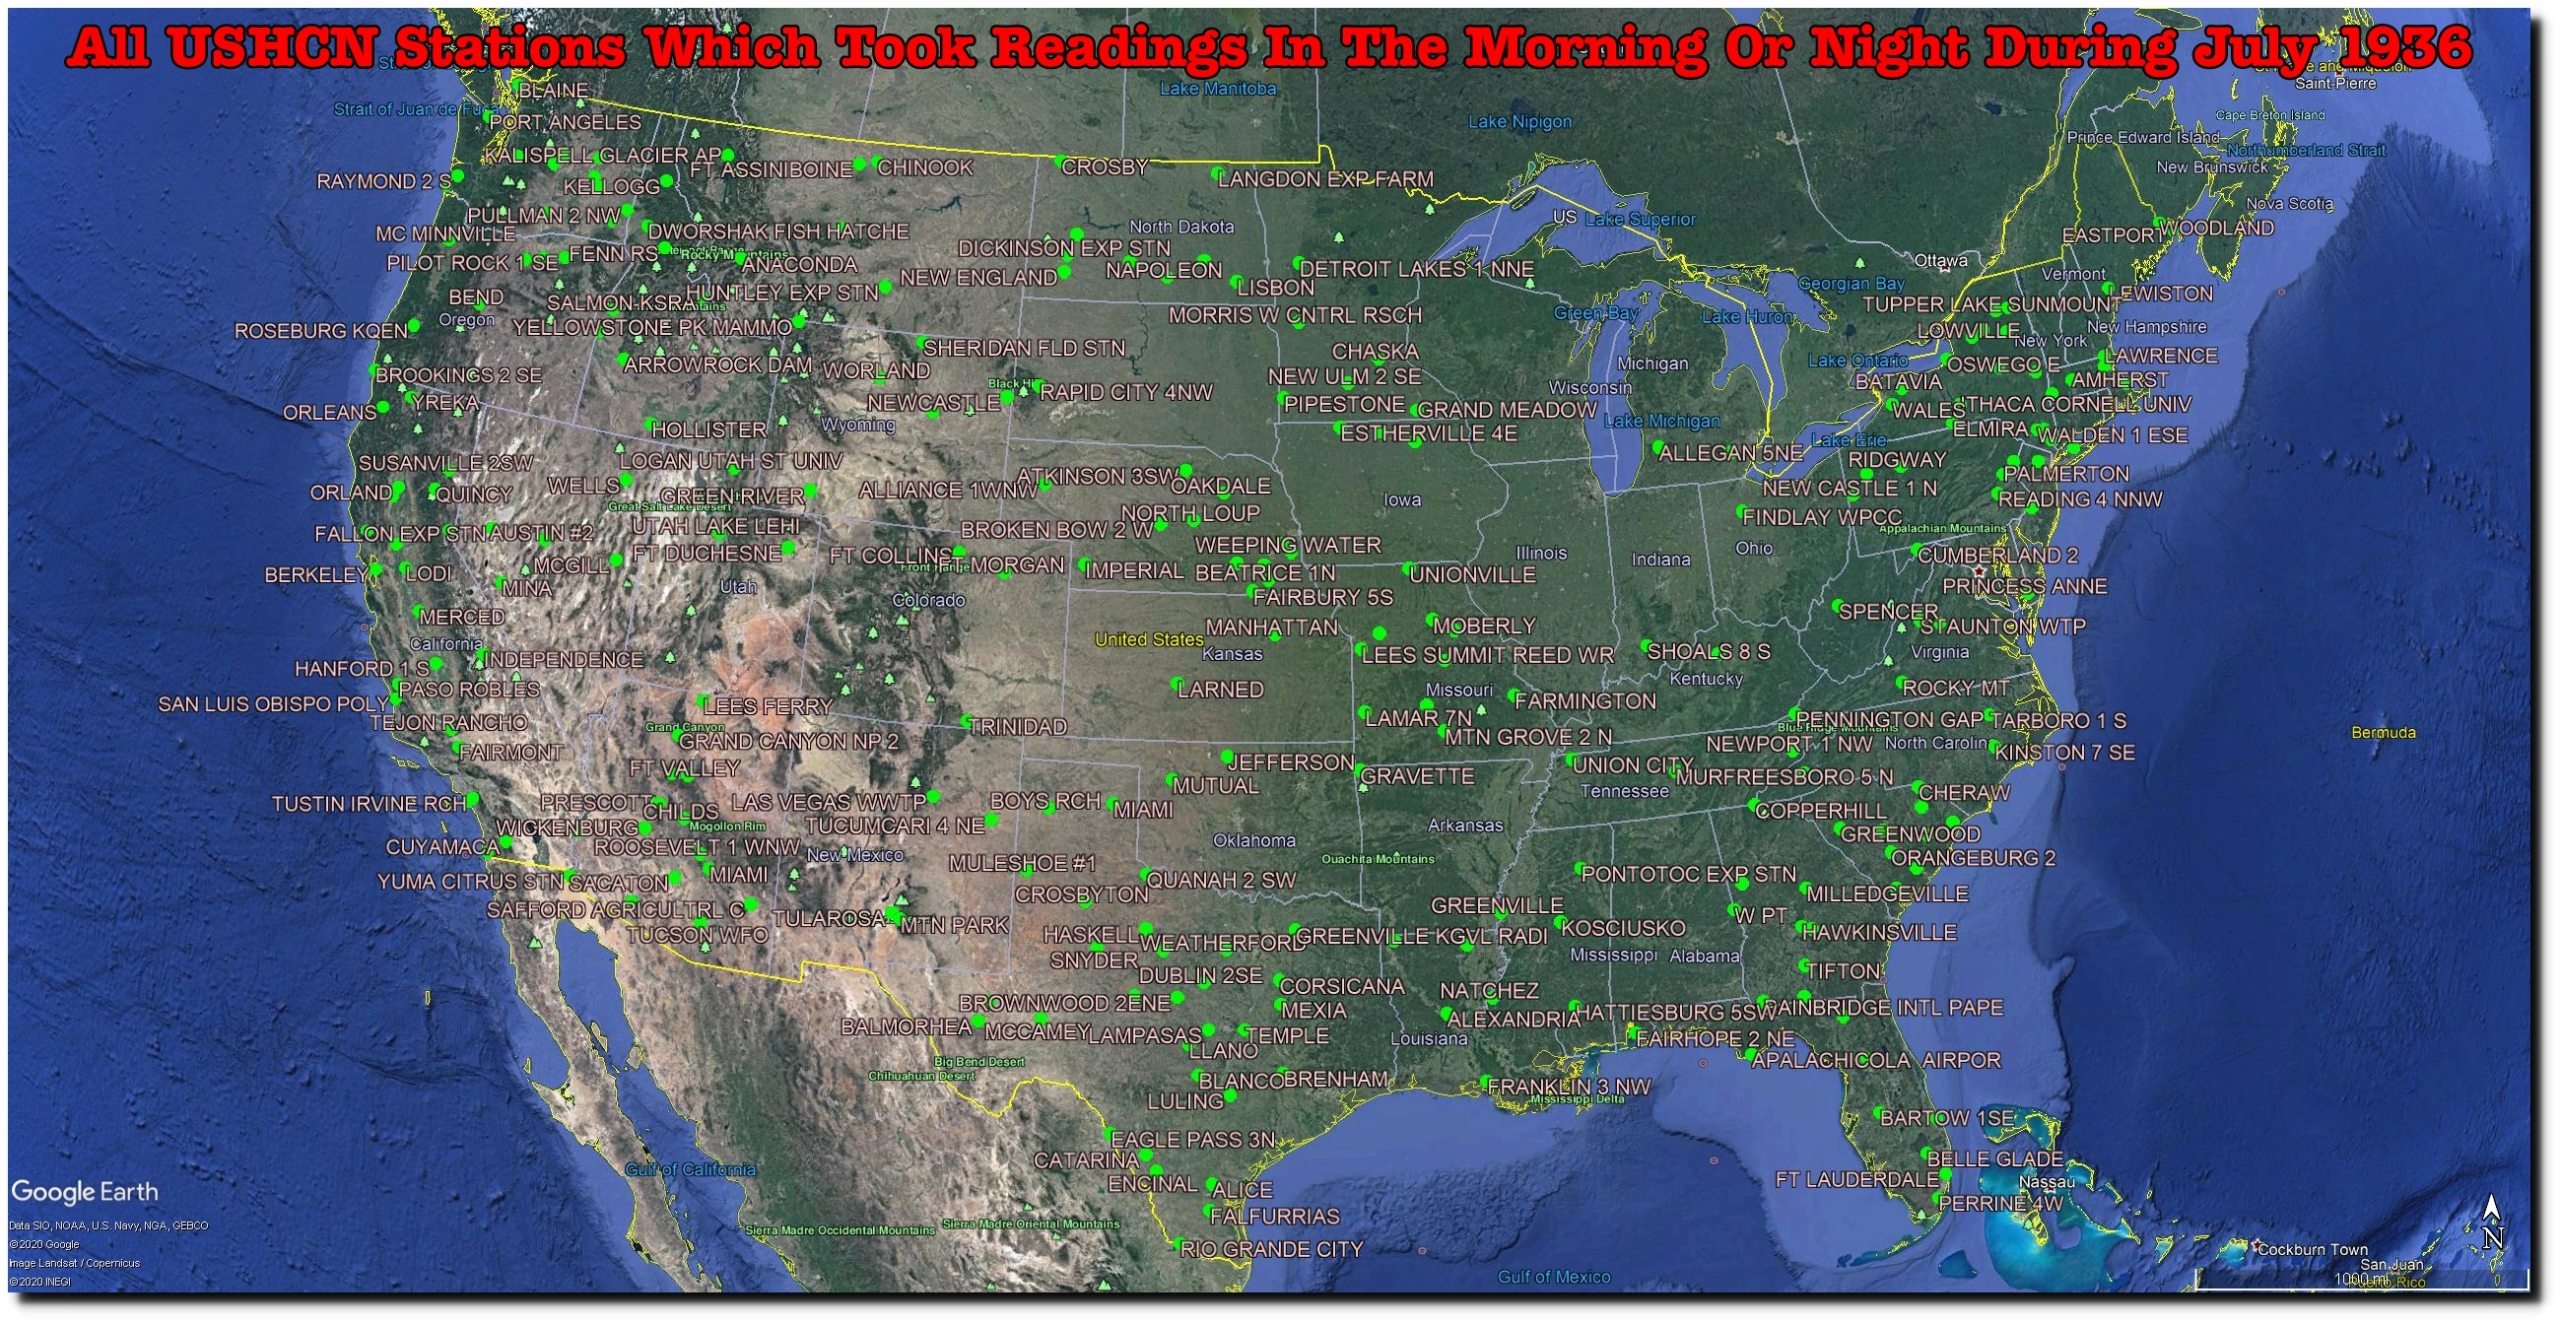
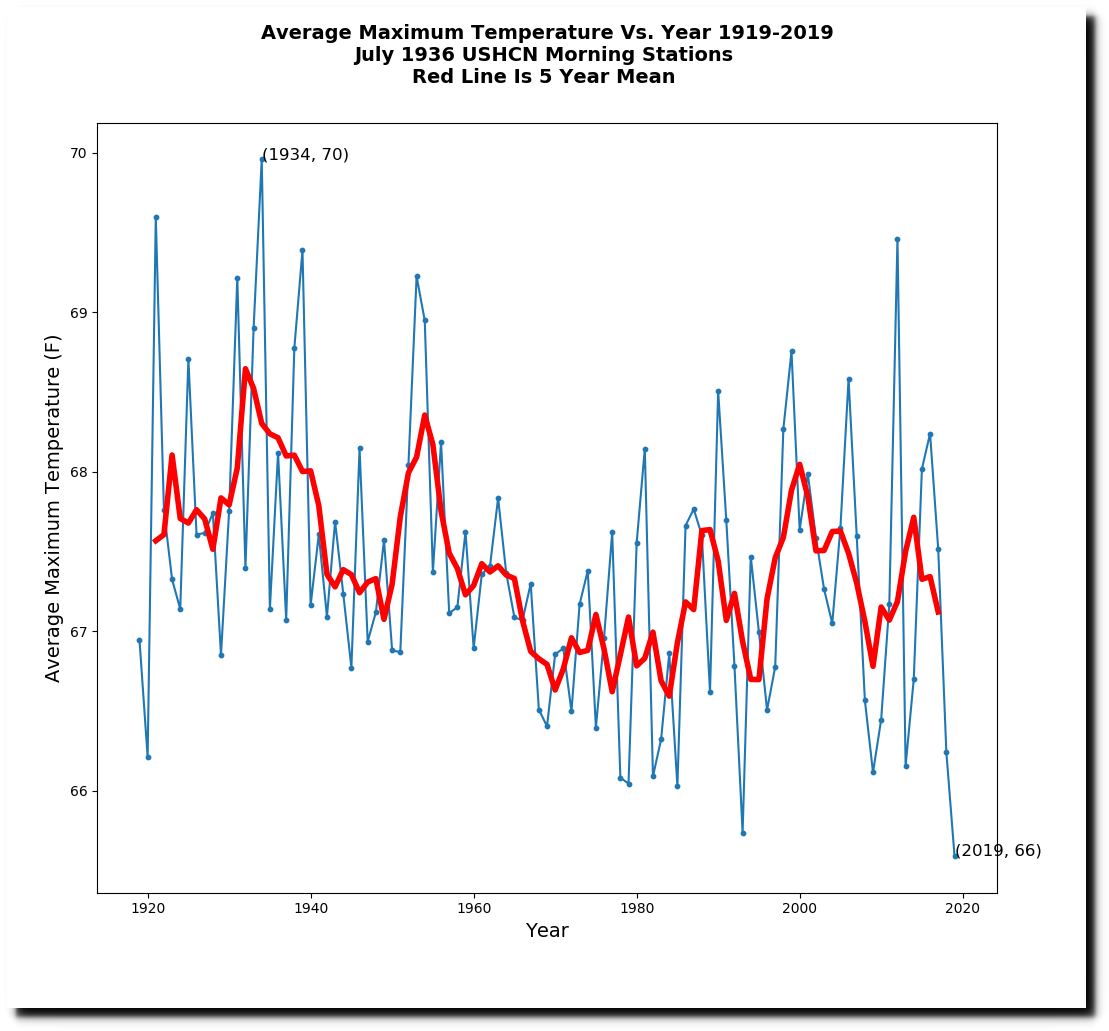
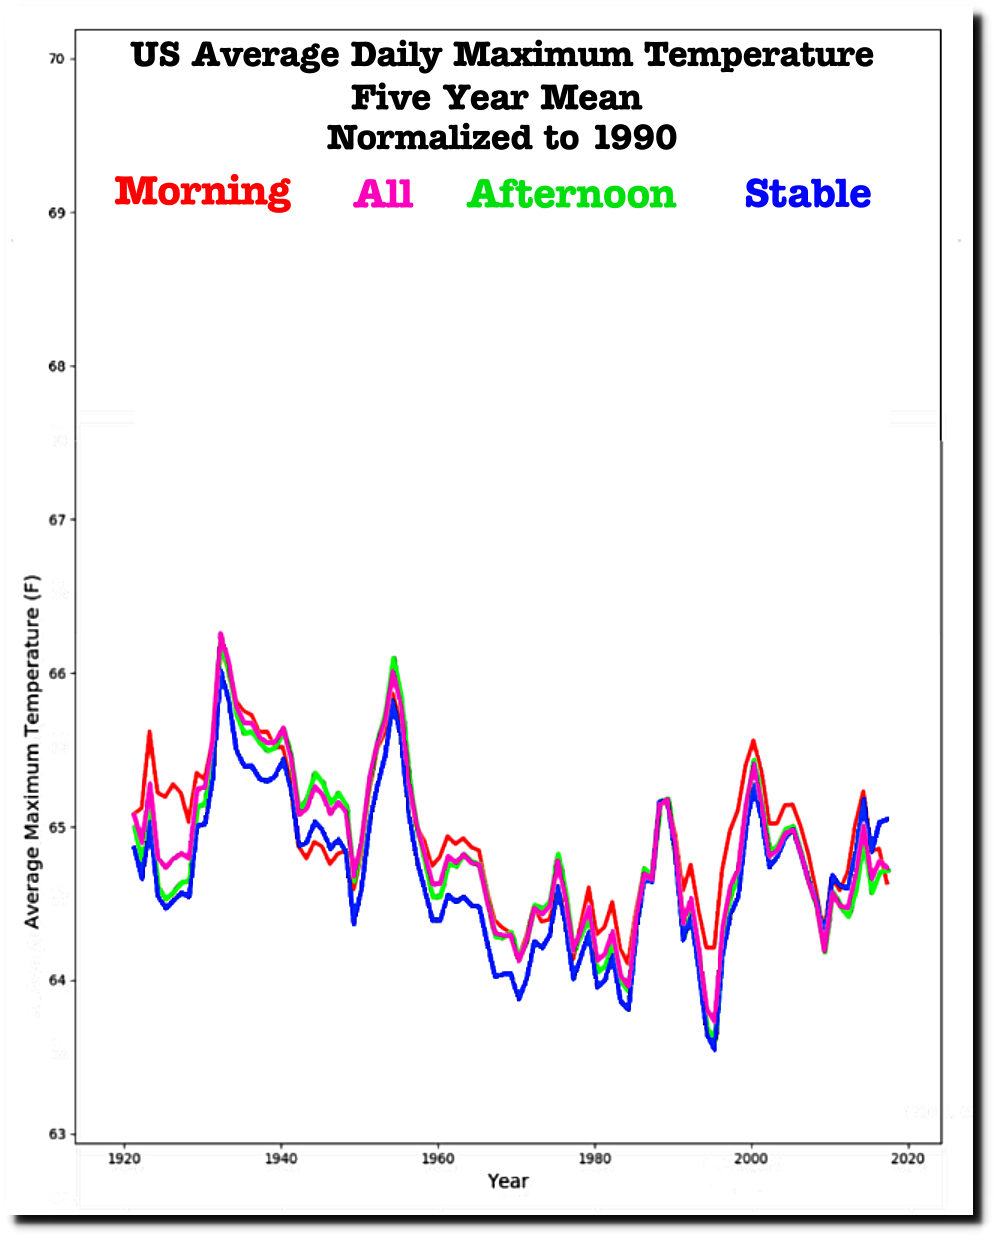
In the graph below, I combined four data sets. The set of all USHCN stations, the set of stable stations, 1936 morning stations and 1936 afternoon stations. The morning stations are warmer because the average latitude of morning stations is lower (people in warmer locations are more likely to read their thermometers in the morning.)

This graph normalizes all four data sets to 1990, and shows that none of the excuses for data tampering have much impact on the trend.
This is the same graph, with the NCDC temperatures thrown in. They look nothing like any of the other data sets.
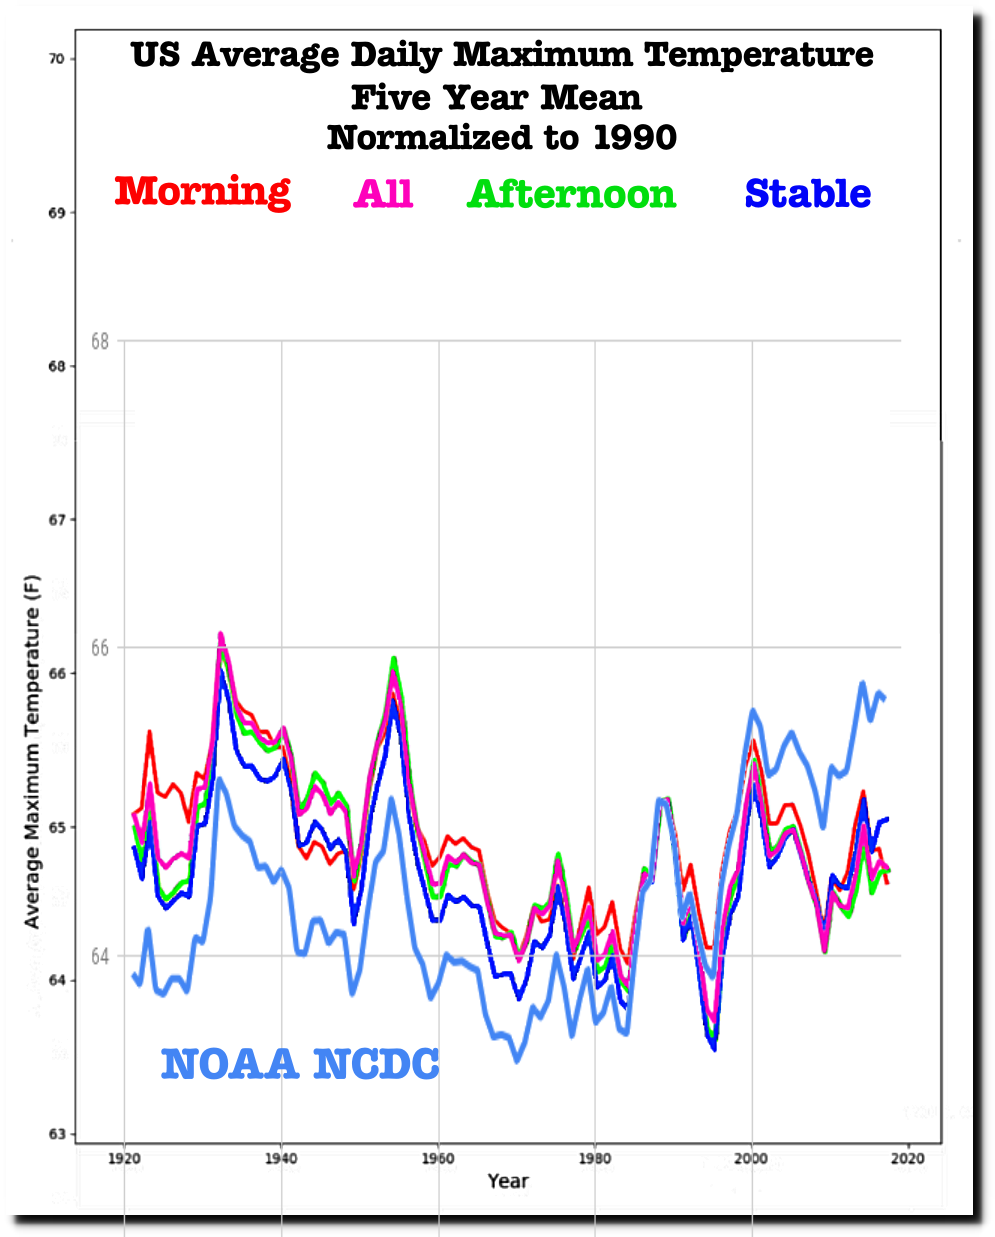
The real story is that NOAA is simply making data up. Almost half of it is now fake.
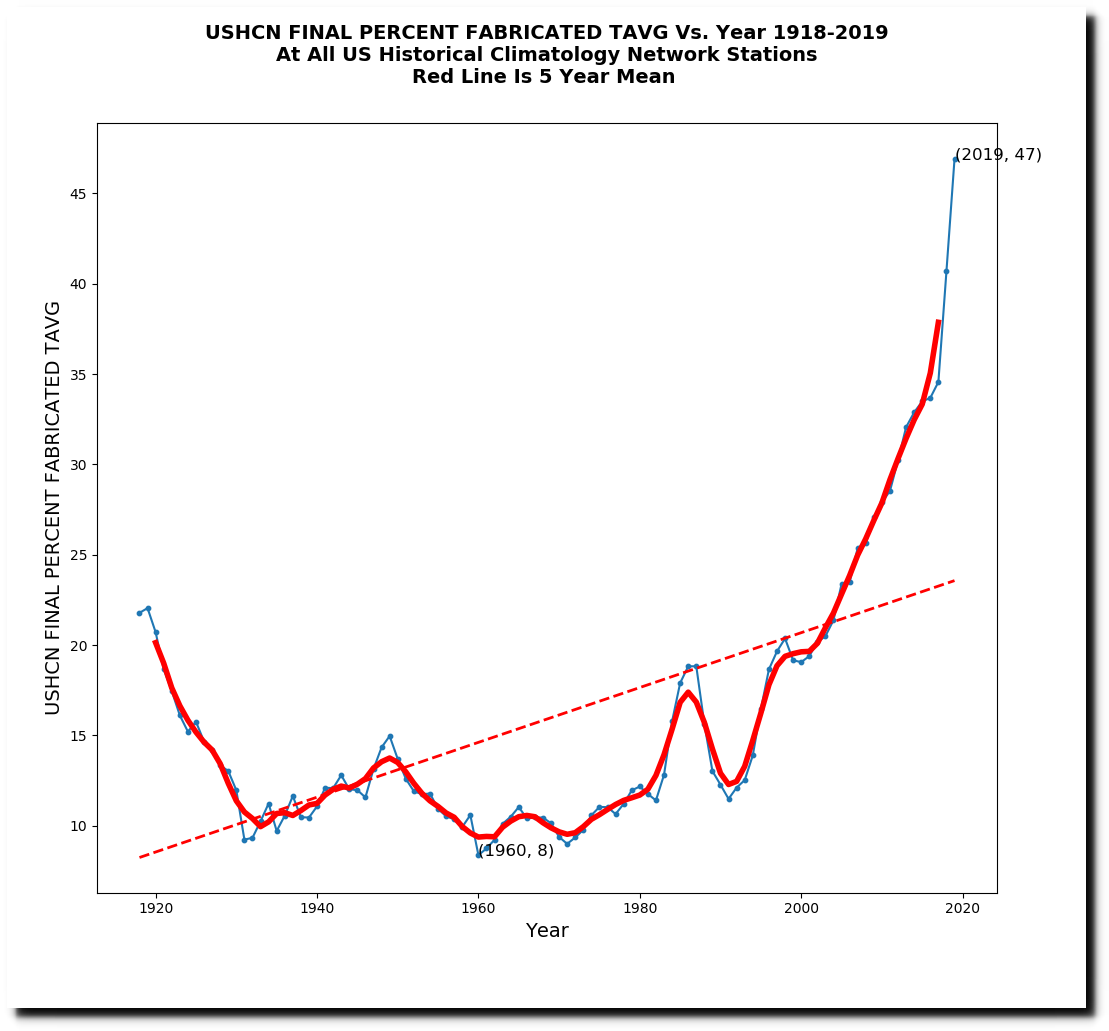
Anthony Watts describes the fake station data as being “zombie stations.”
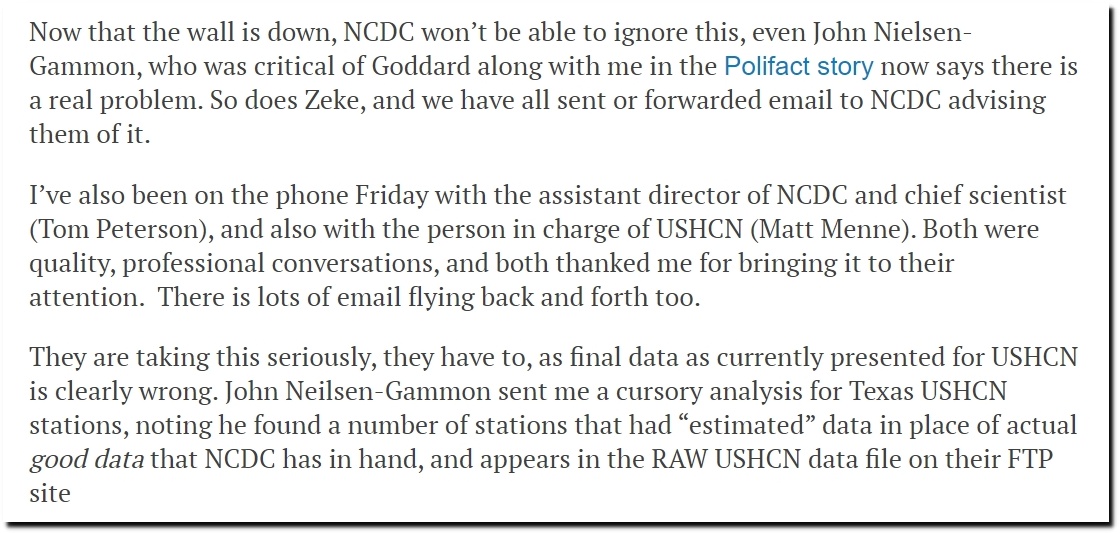
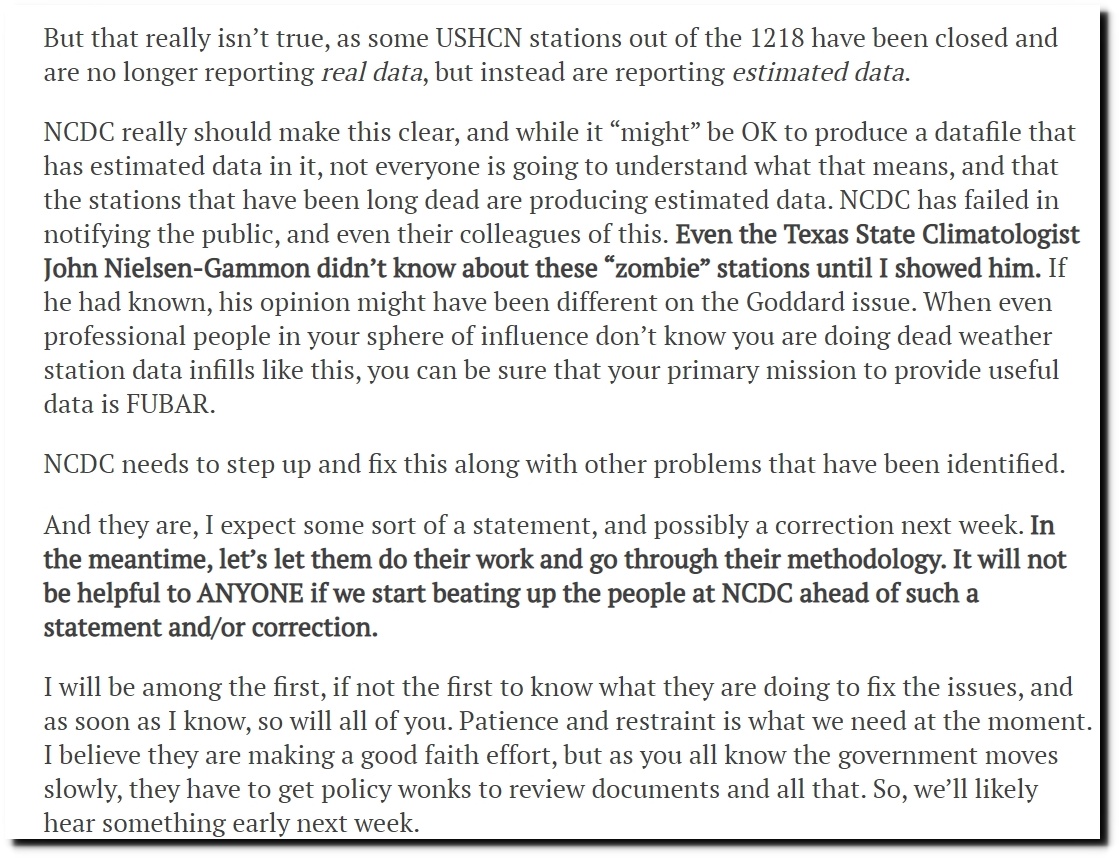
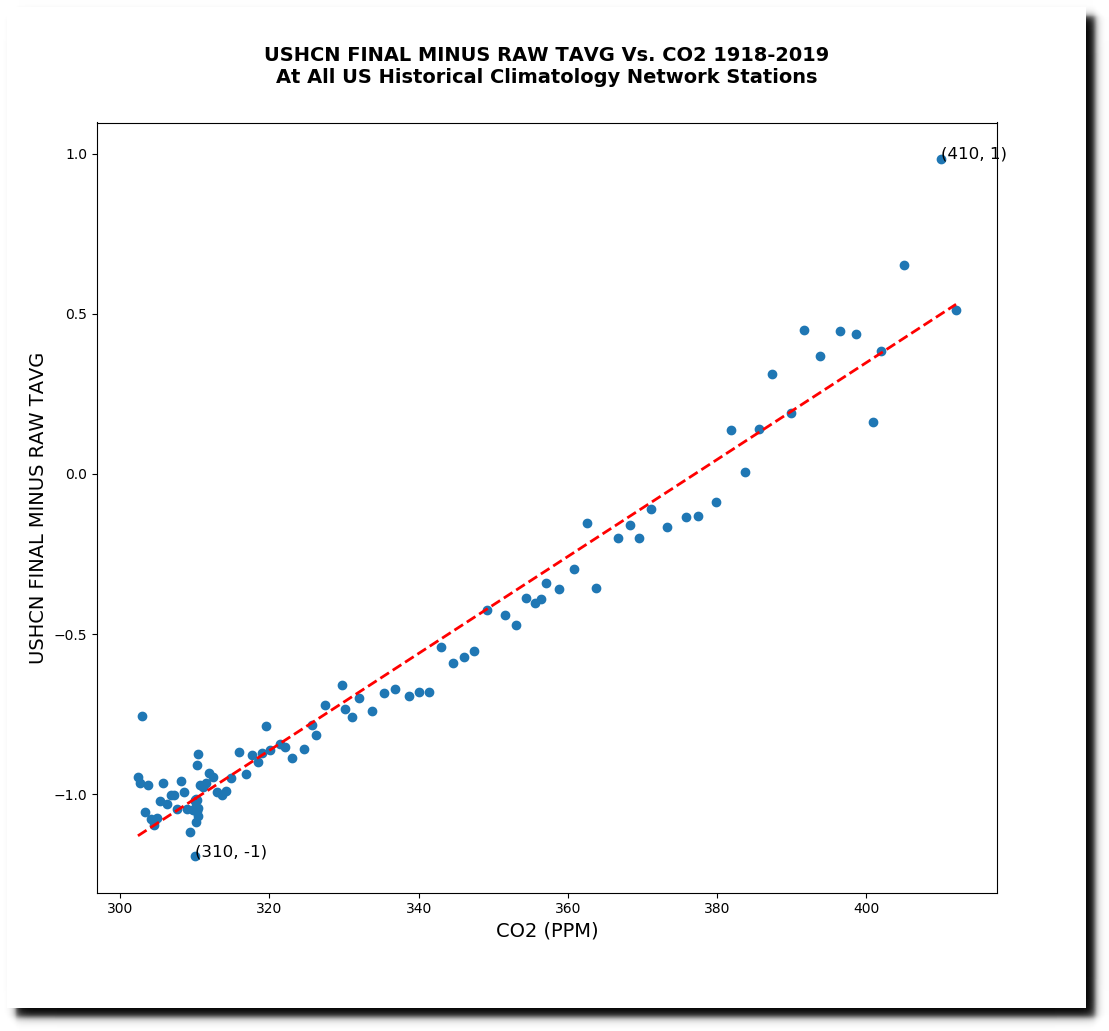
Reality is that the data is being tampered with precisely to match the increase in atmospheric CO2.
Posted in Uncategorized
Leave a comment
The Low CO2 Climate Of 1884
This week in 1884, one of the worst tornado outbreaks, snowstorms and floods on record hit the US. There was flooding from Southern California to the Ohio Valley, and tornadoes from Illinois to Alabama and Texas.

Enigma tornado outbreak – Wikipedia
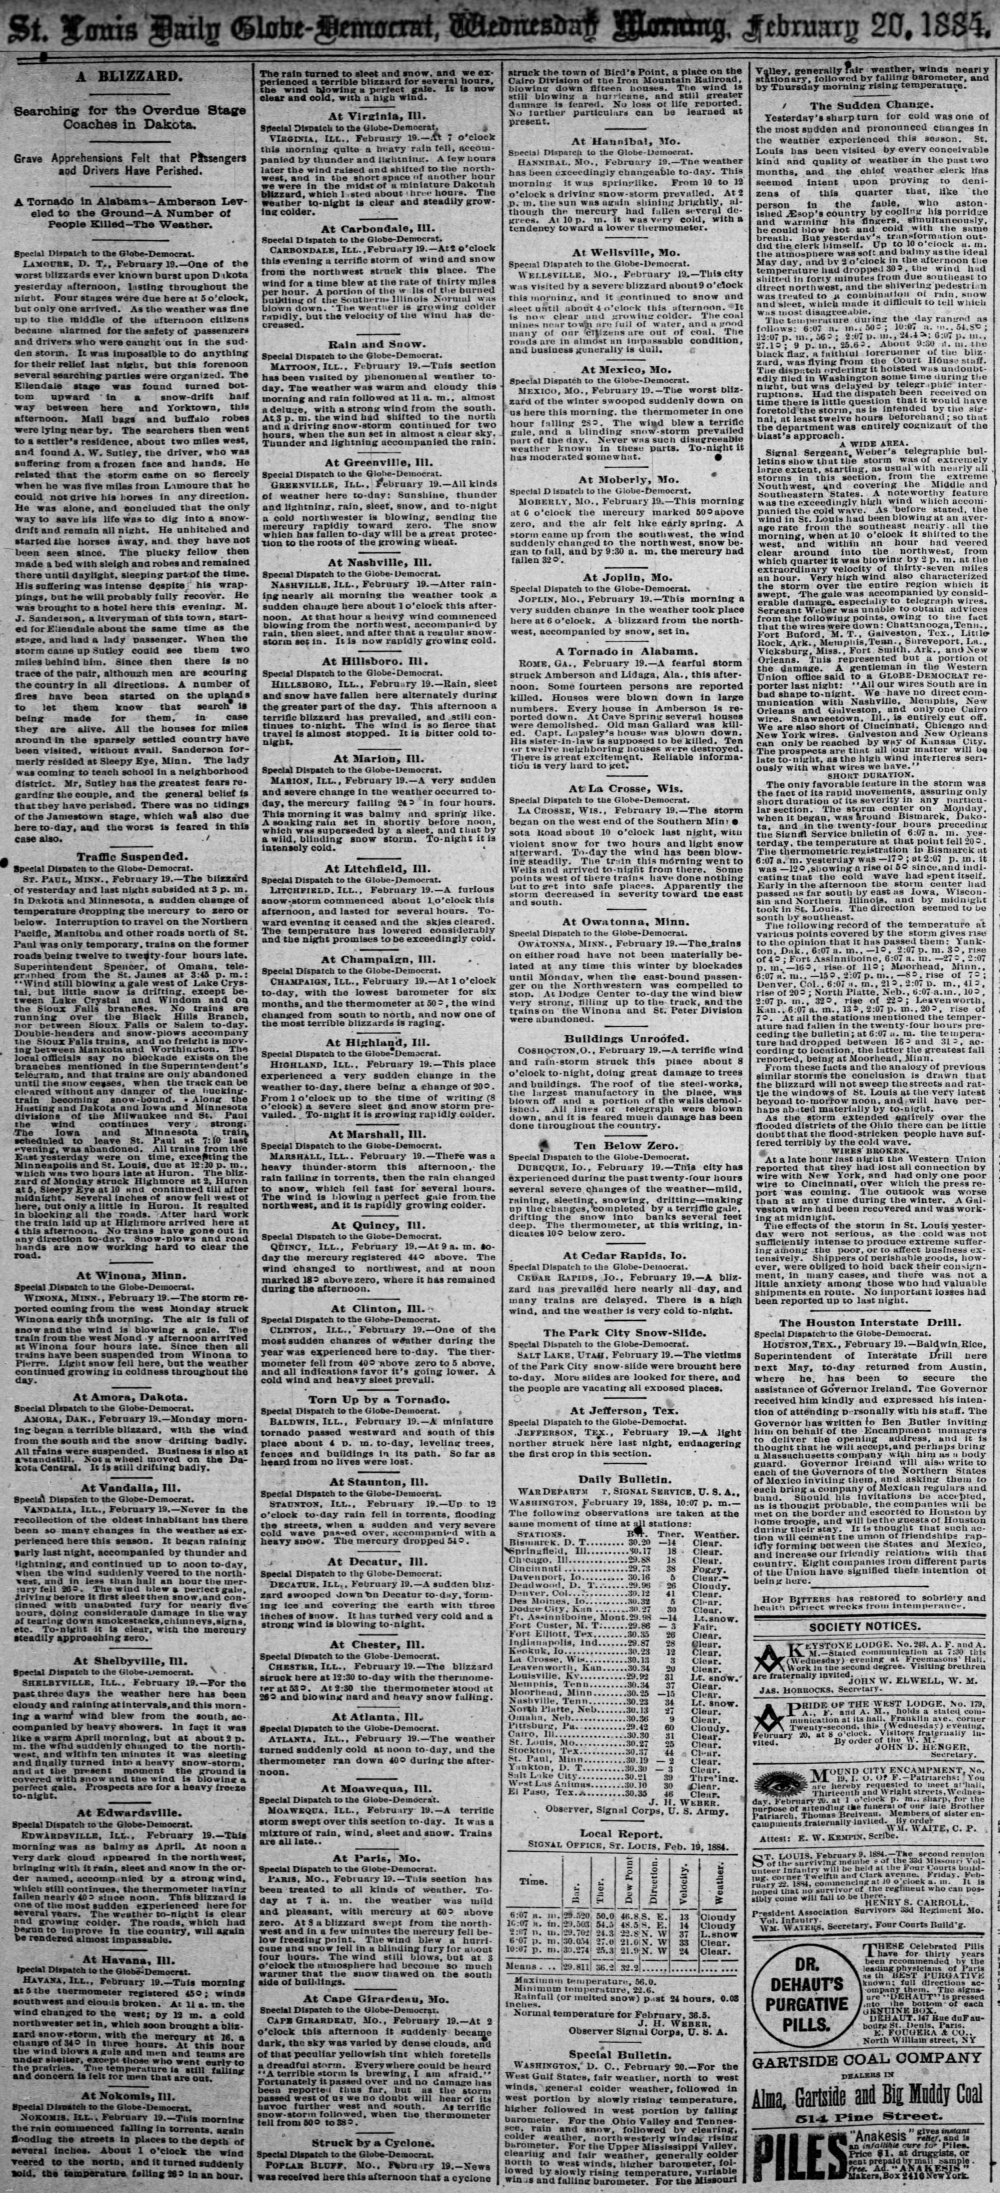
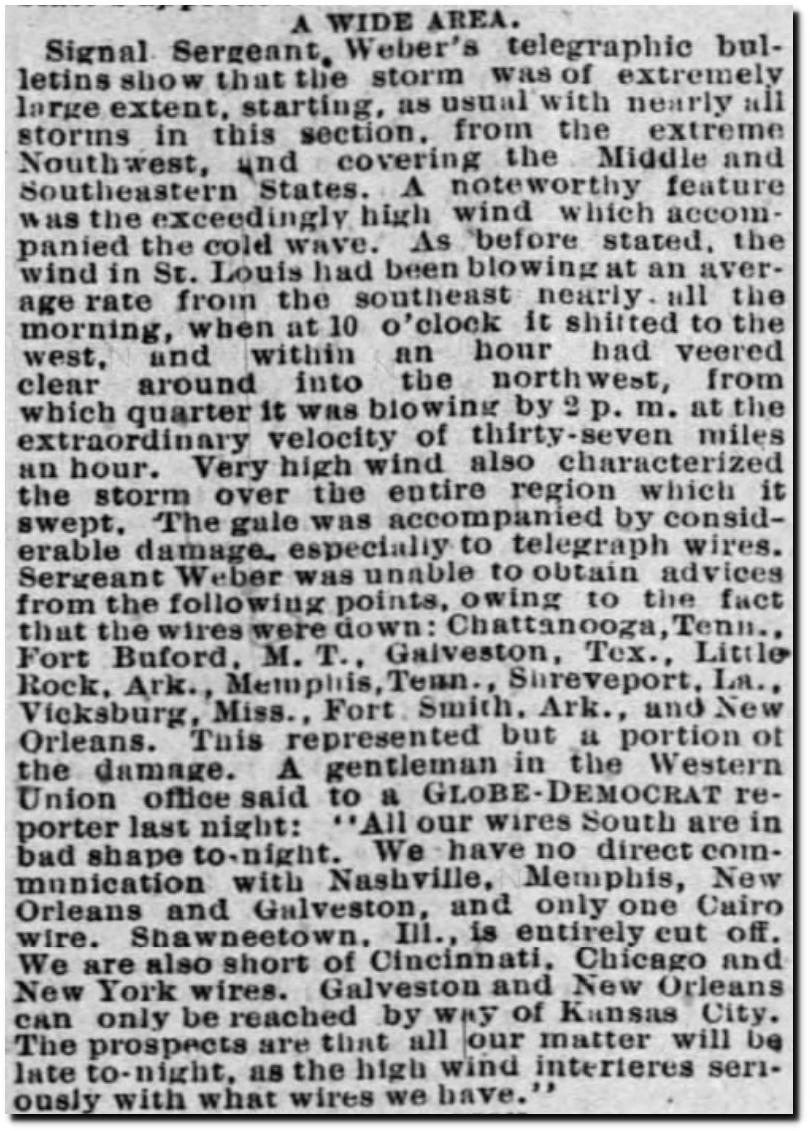
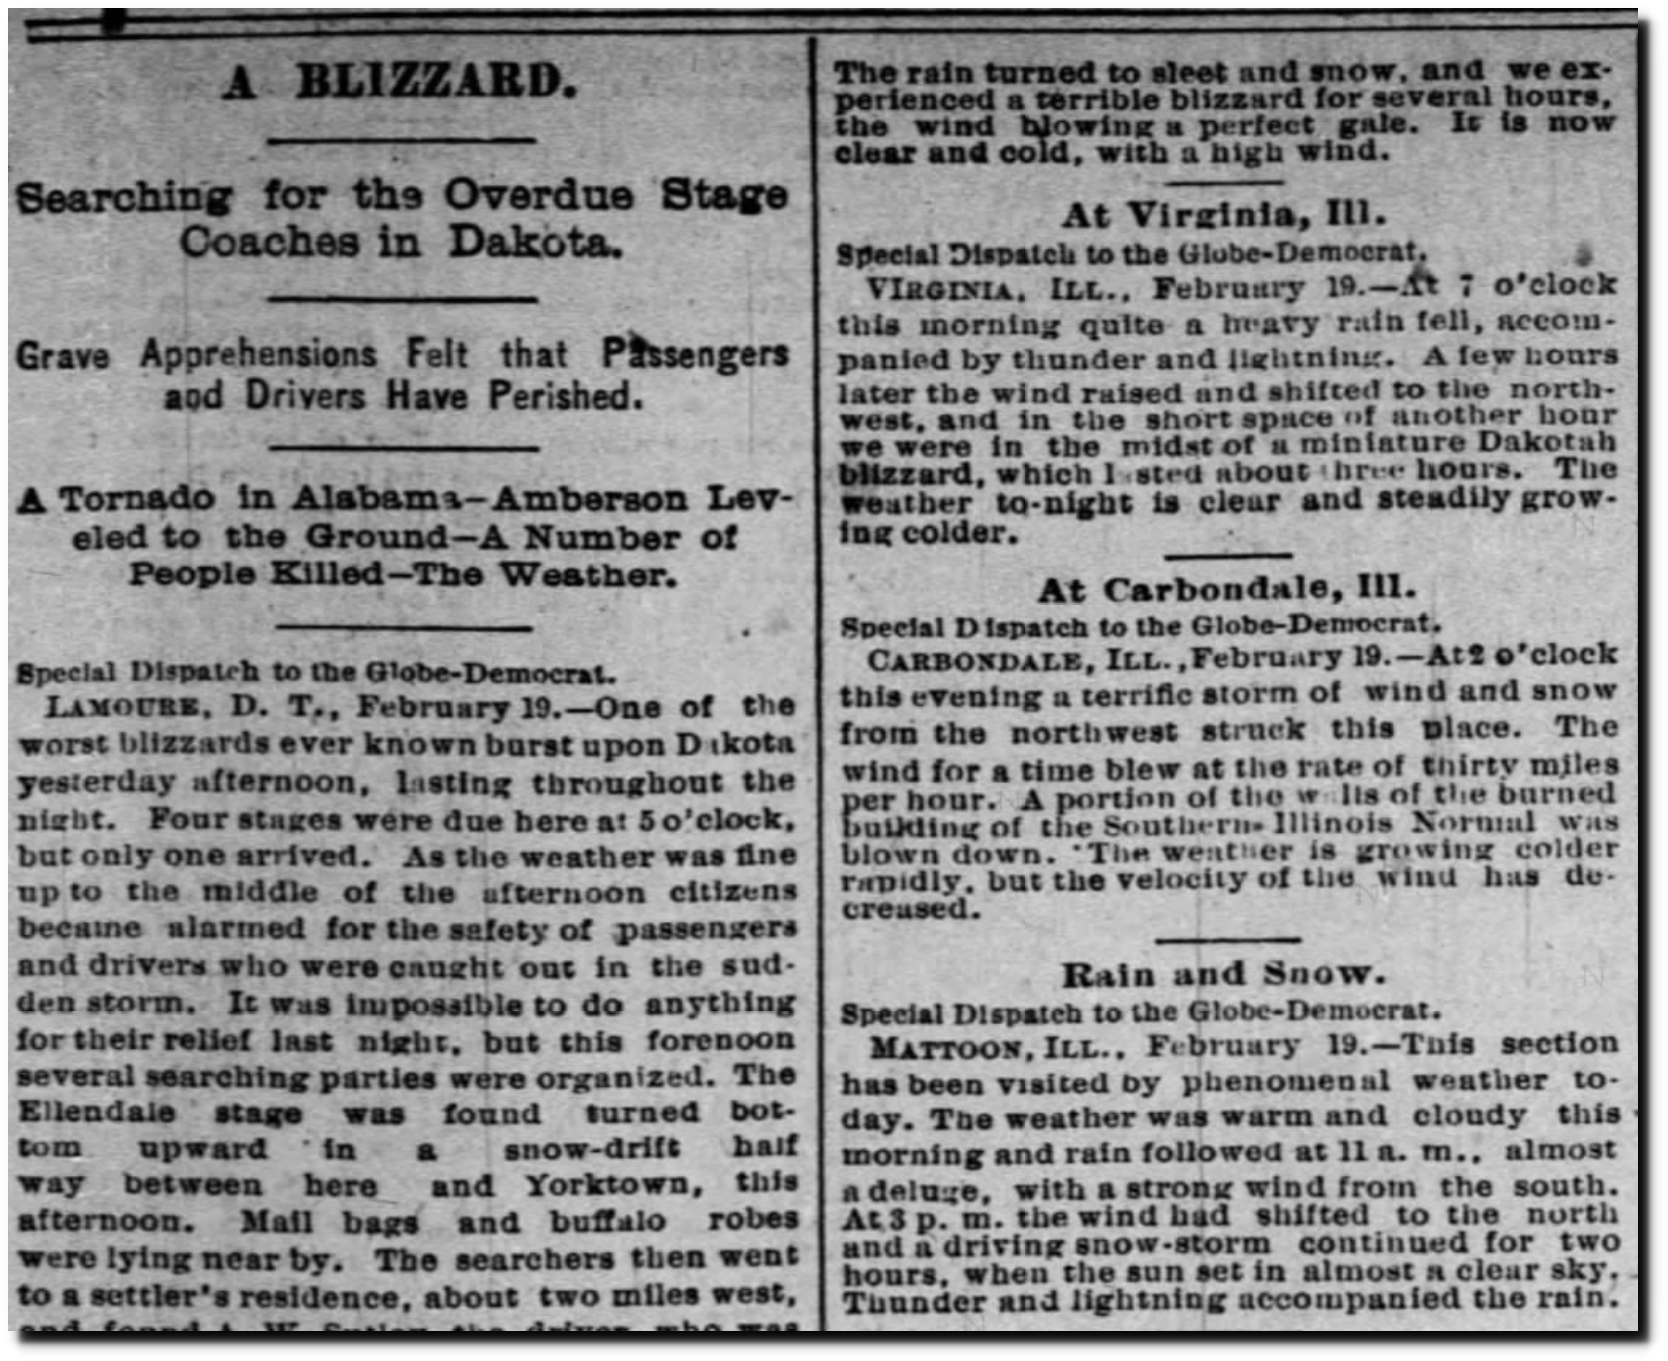
20 Feb 1884, 7 – St. Louis Globe-Democrat at Newspapers.com
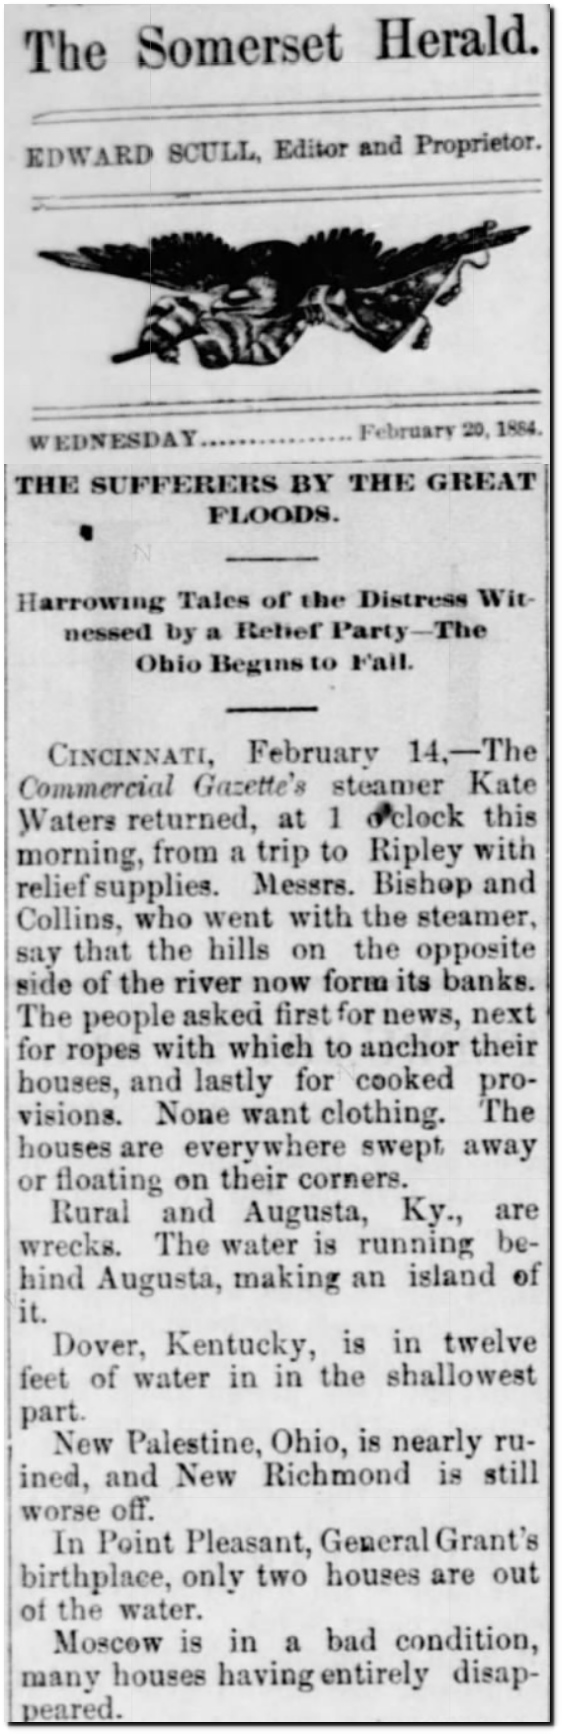
20 Feb 1884, Page 2 – The Somerset Herald at Newspapers.com
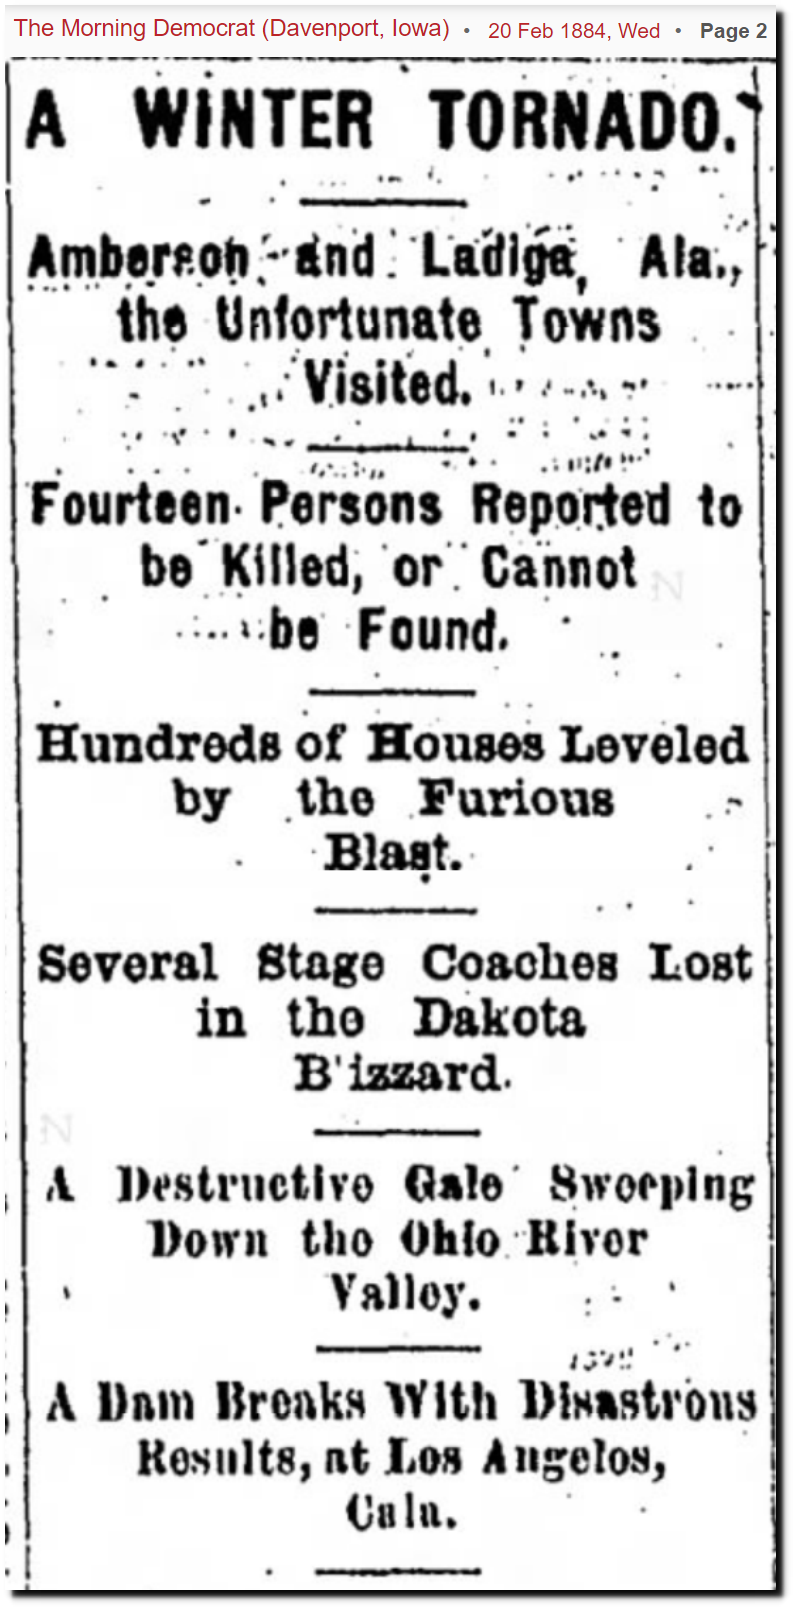
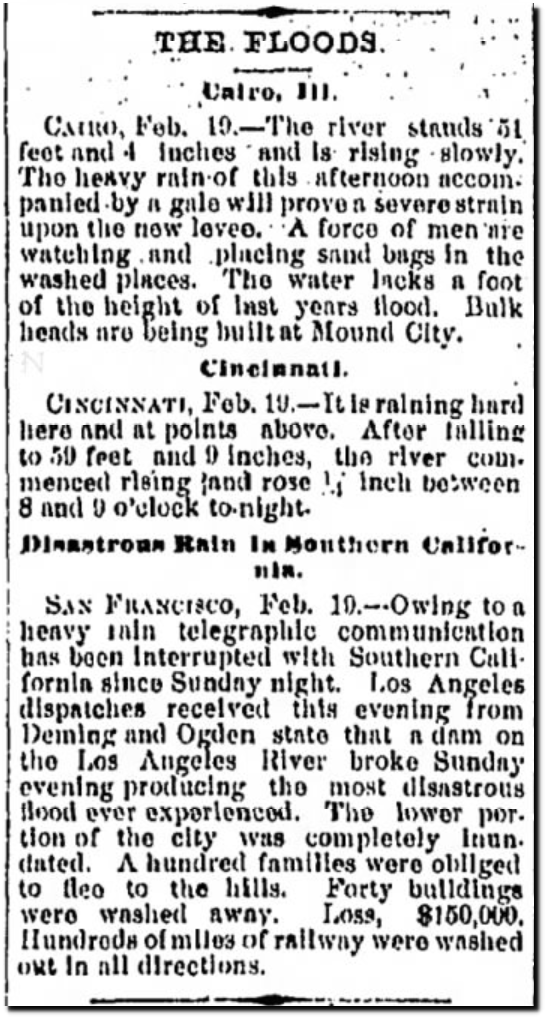
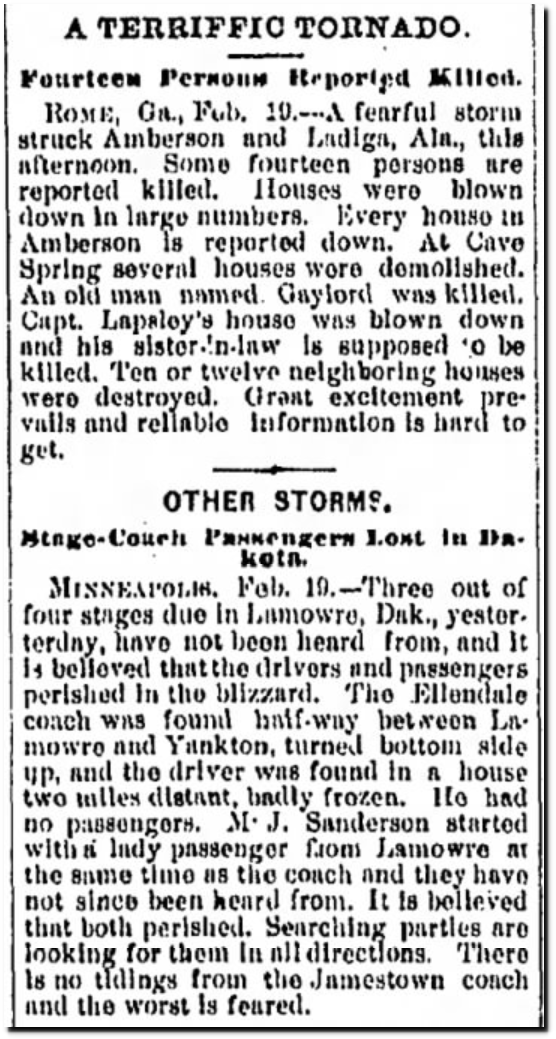
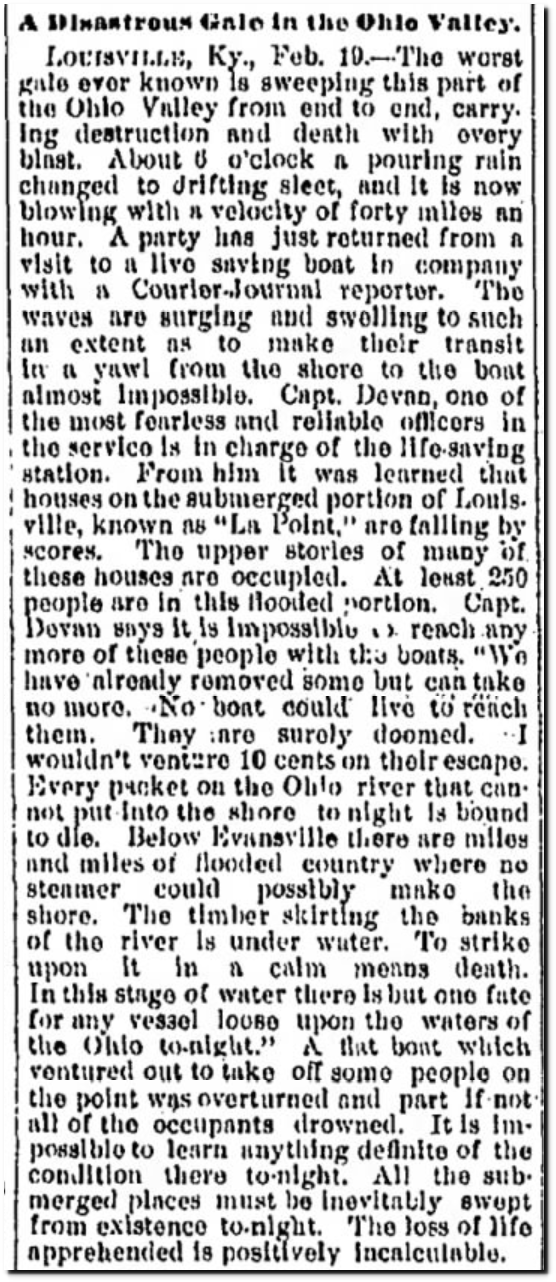
20 Feb 1884, Page 2 – The Morning Democrat at Newspapers.com
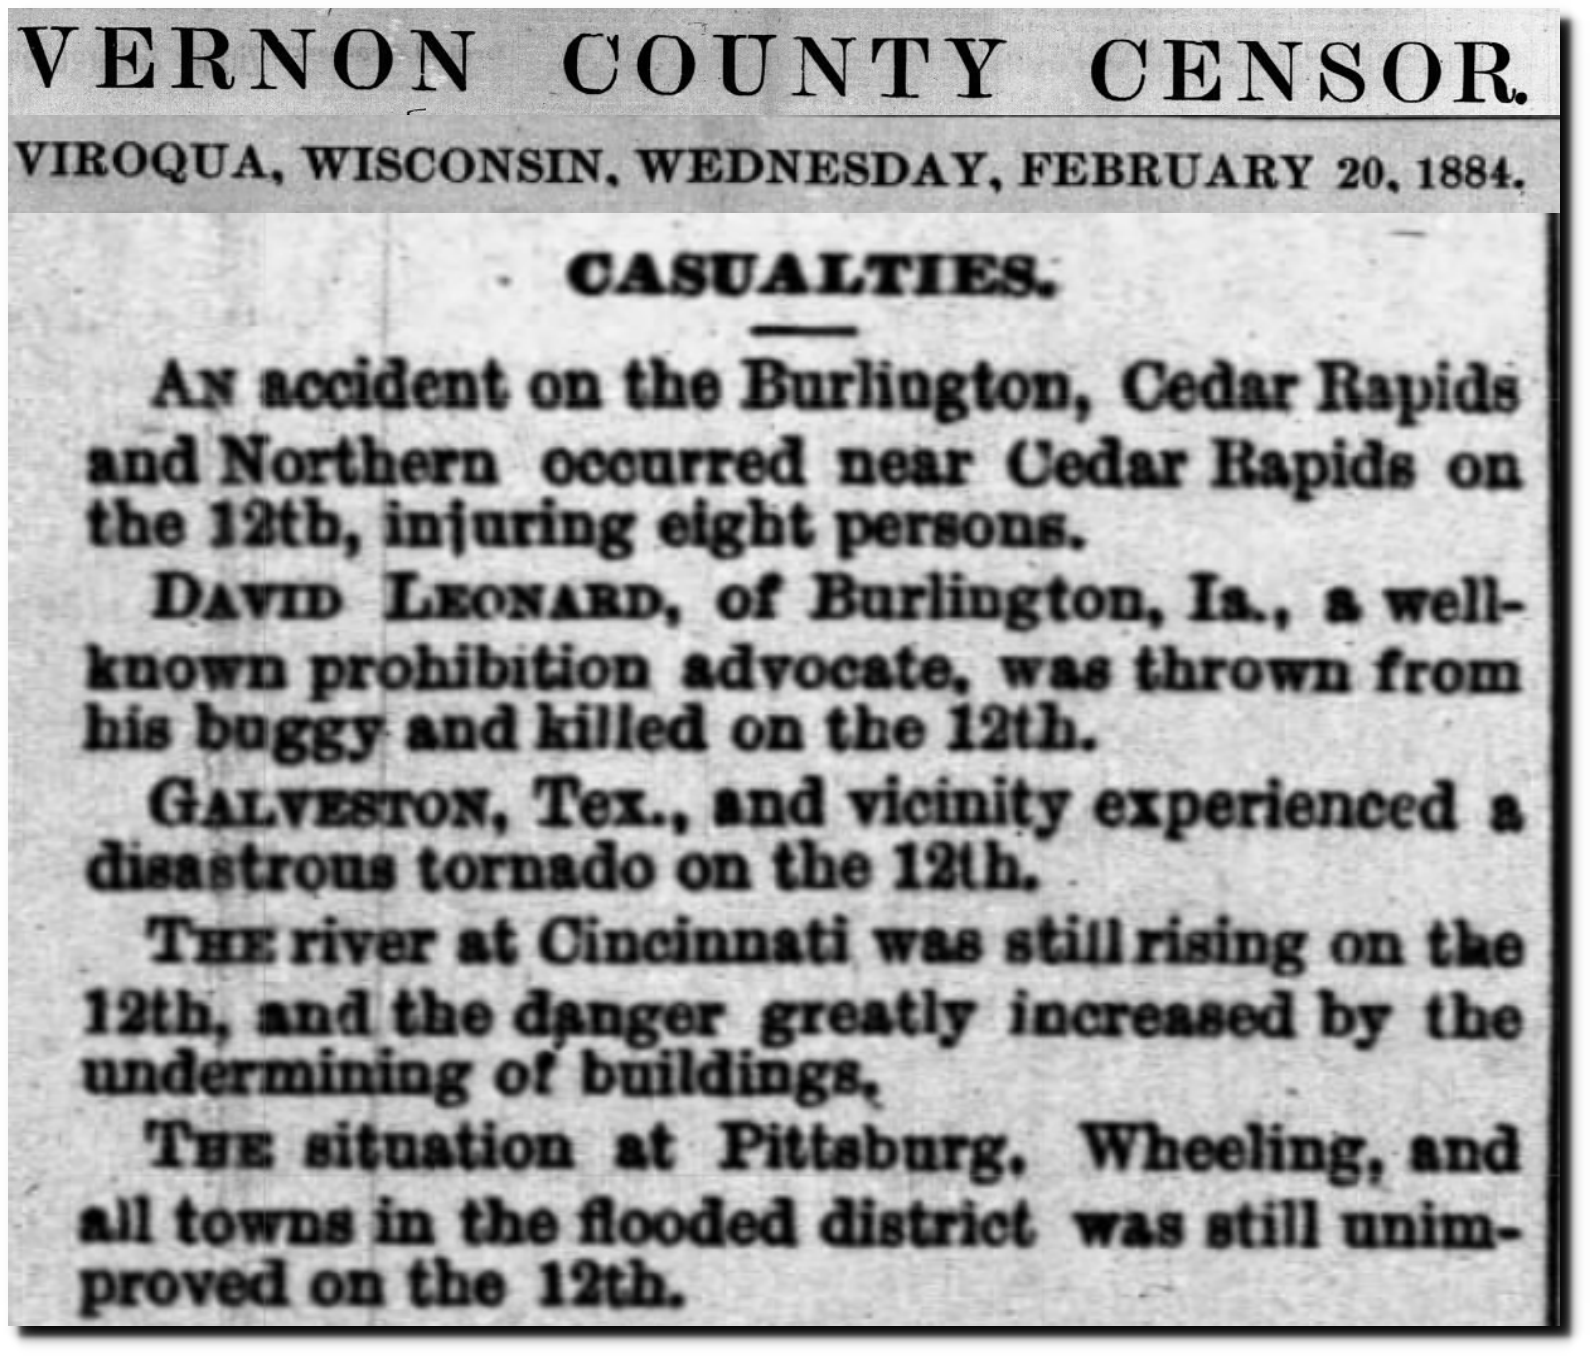
20 Feb 1884, 1 – Vernon County Censor at Newspapers.com
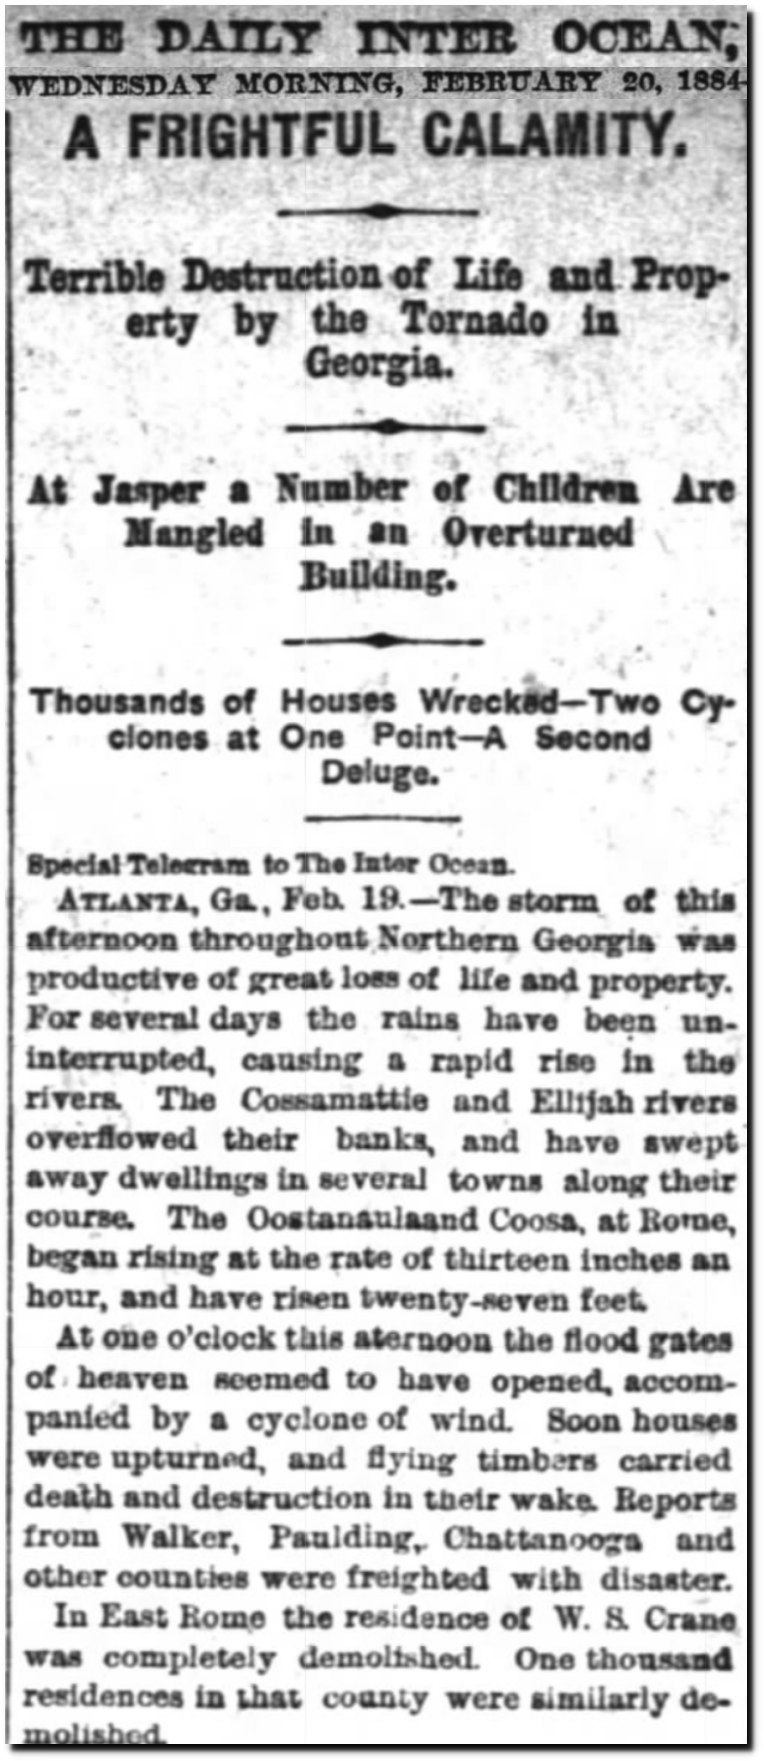
20 Feb 1884, Page 5 – The Inter Ocean at Newspapers.com
The 1880’s was also the worst decade on record for US hurricanes.

http://www.aoml.noaa.gov/hrd/hurdat/All_U.S._Hurricanes.html
On August 20, 1886 the city of Indianola, Texas was wiped off the map by a hurricane.
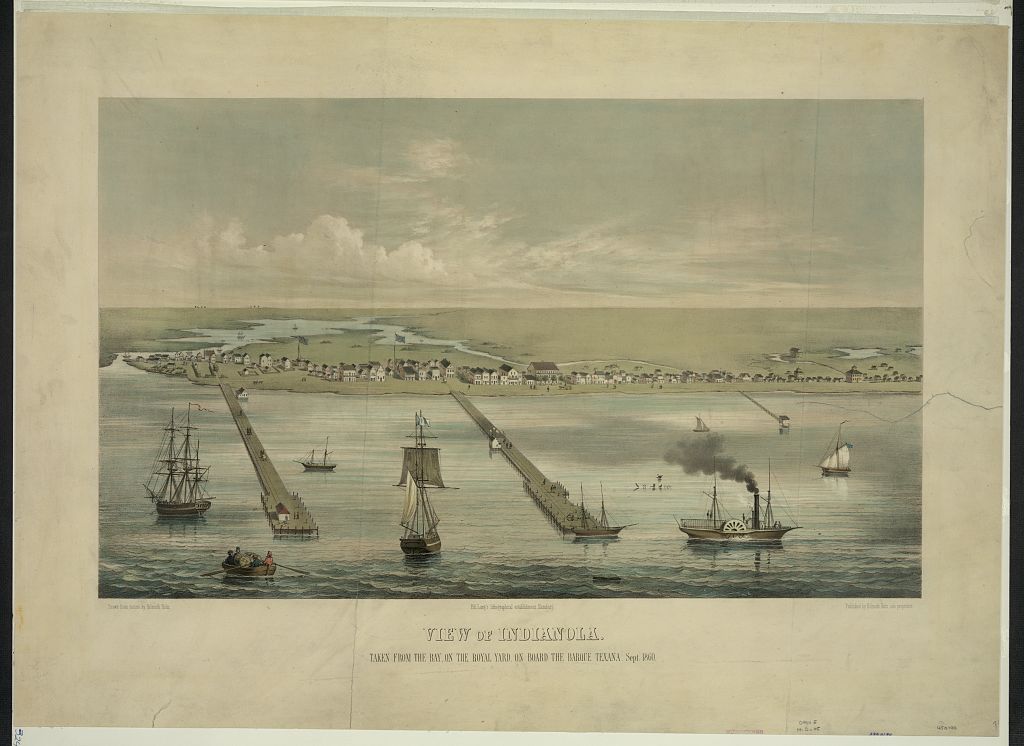
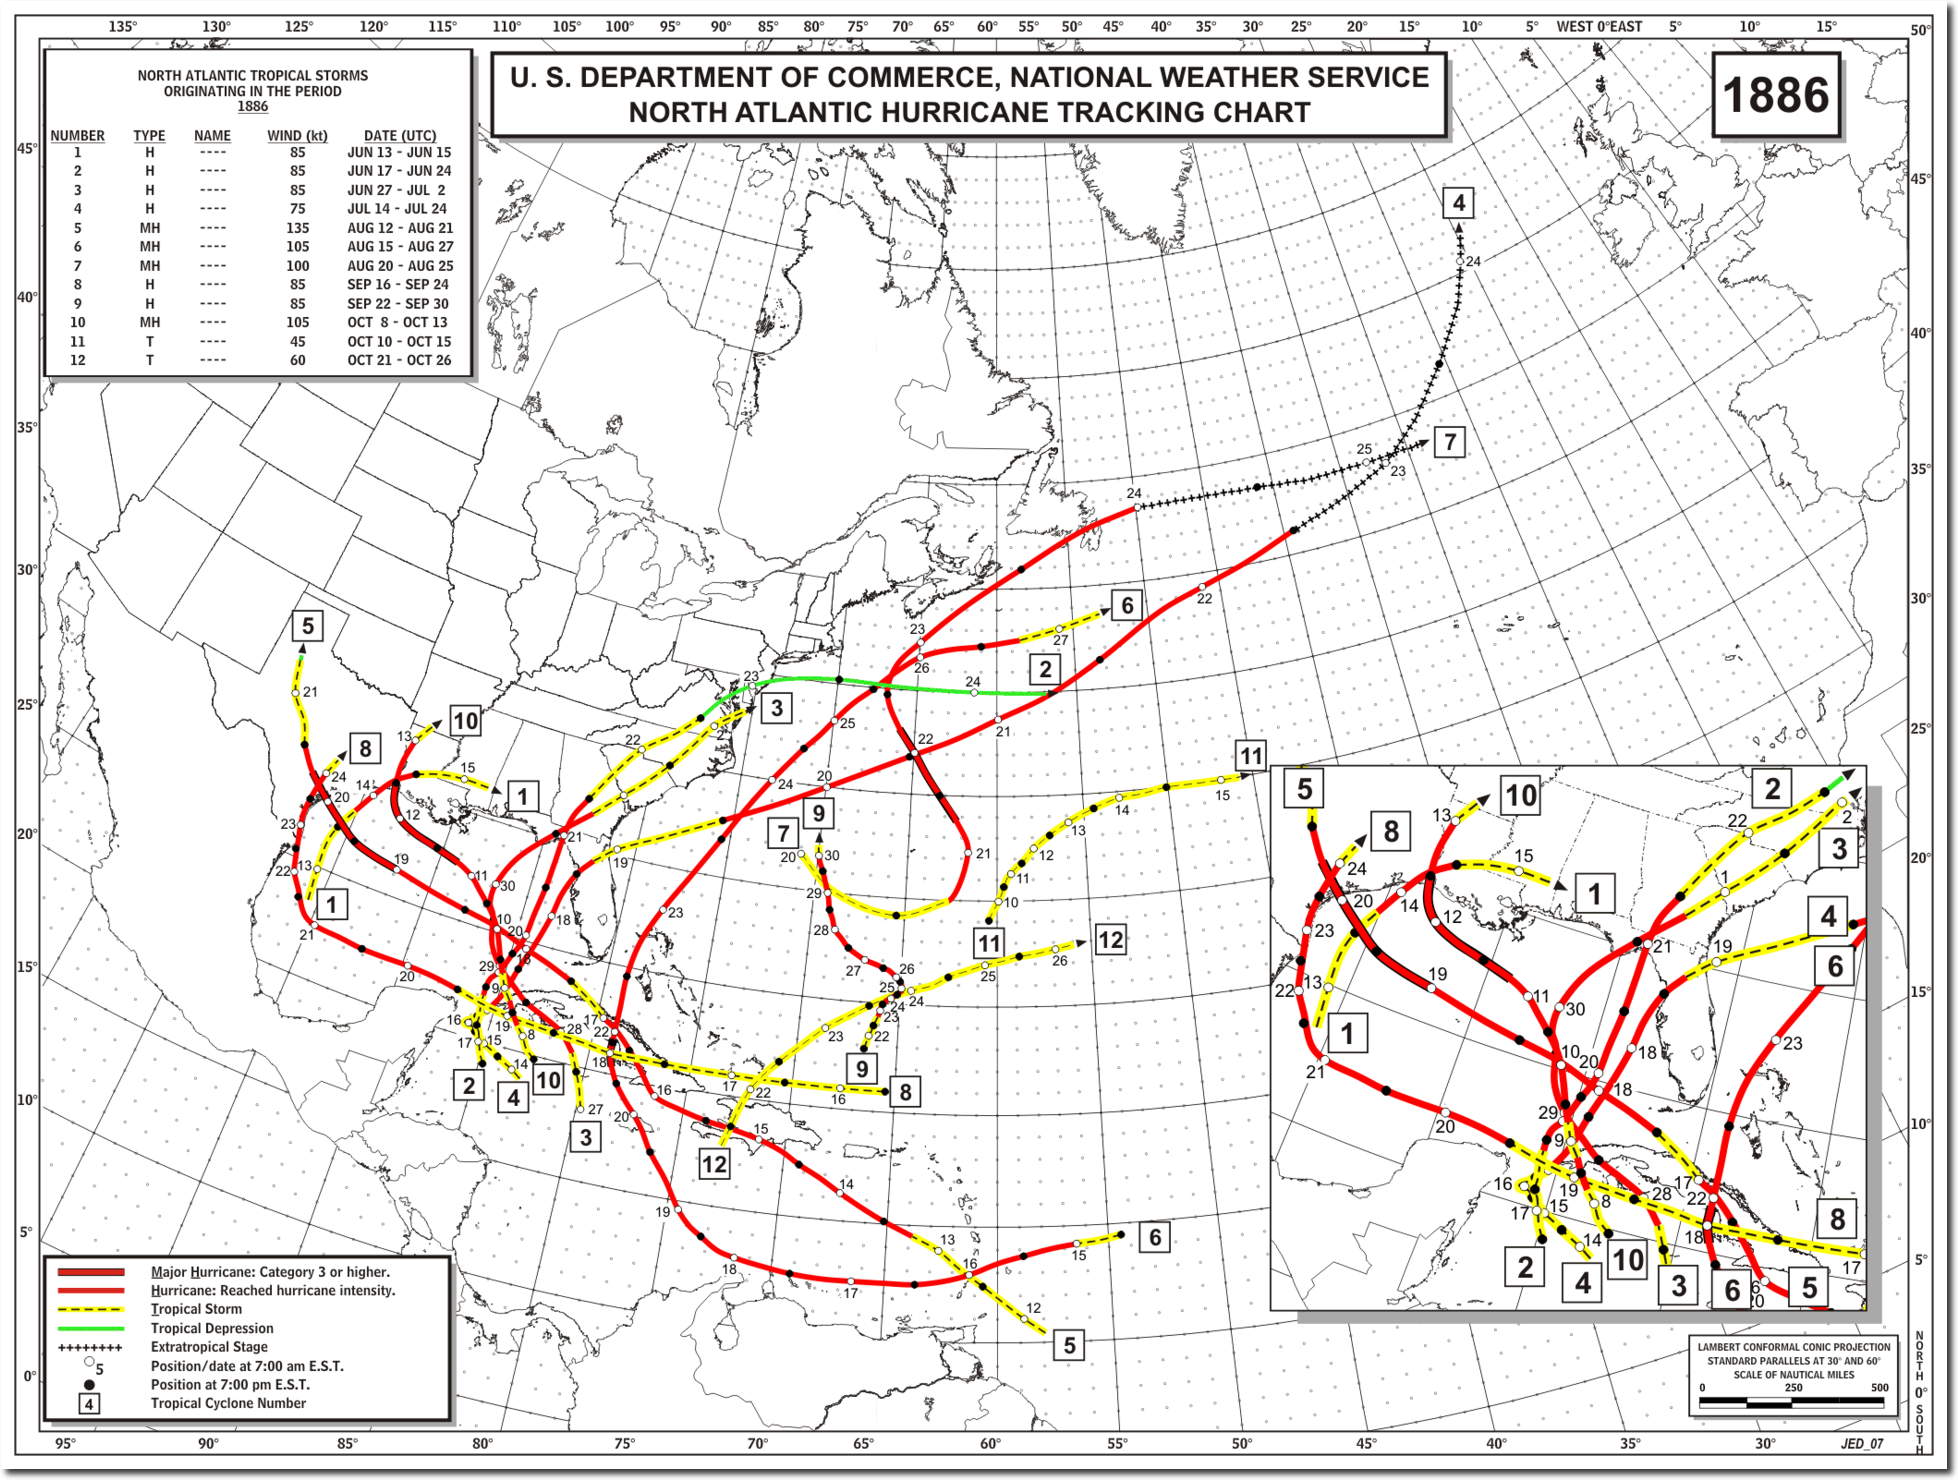
That year was the most active hurricane season in US history, with seven hurricanes making landfall.
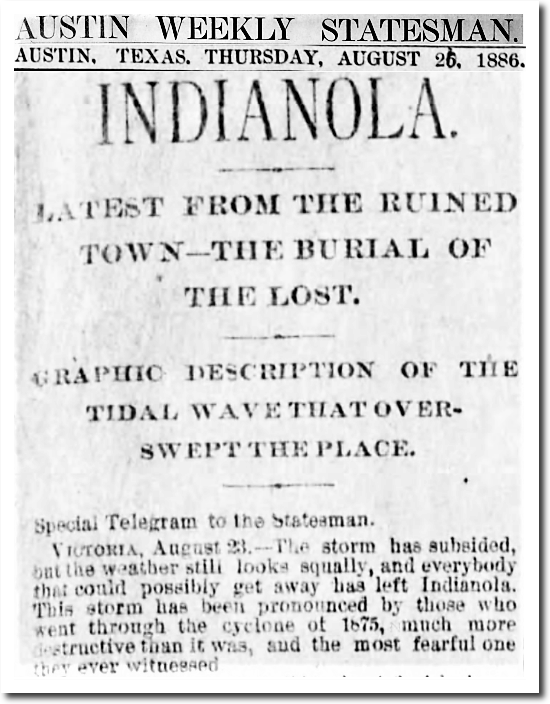
26 Aug 1886, Page 1 – The Austin Weekly Statesman at Newspapers.com
More hurricanes hit the US in 1886 than during Obama’s entire presidency.
Posted in Uncategorized
Leave a comment