
Mind-blowing incompetence or fraud from the 2007 IPCC report.
www.ipcc.ch/pdf/assessment-report/ar4/wg1/ar4-wg1-chapter5.pdf
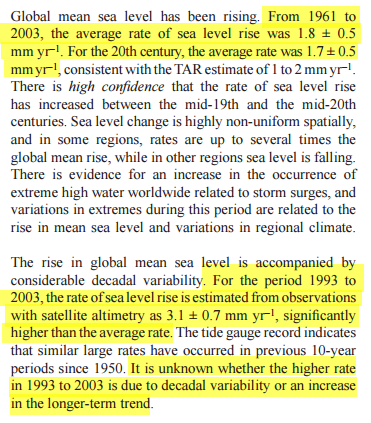
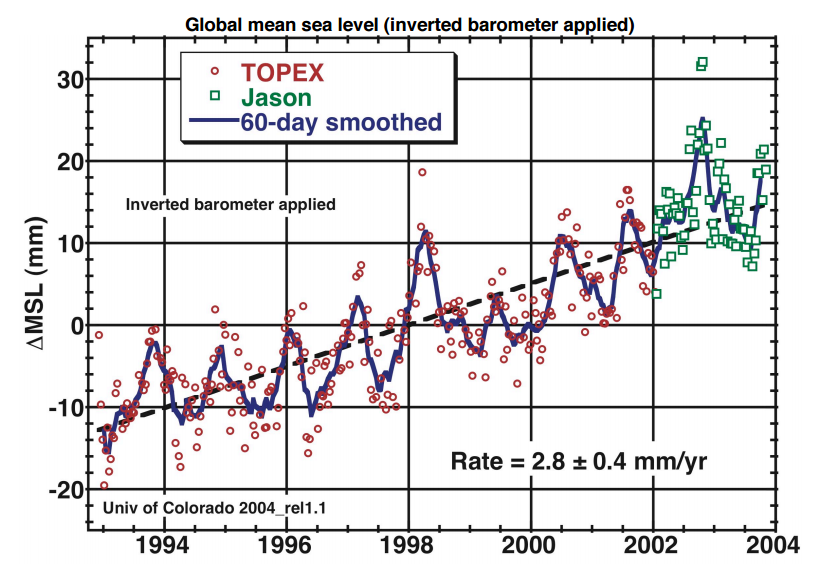
The IPCC switched measurement systems in 1993 from tide gauges to satellites, declared a huge increase in sea level rise rates, and didn’t consider the possibility that the increase in rate was due to their changing measurement systems – rather than the climate.
Any third grader trained in science would have cross-checked vs. their earlier measurement system to see if there actually was an increase in 1993, rather than just an instrumentation issue. There wasn’t – the authors and reviewers are completely incompetent.
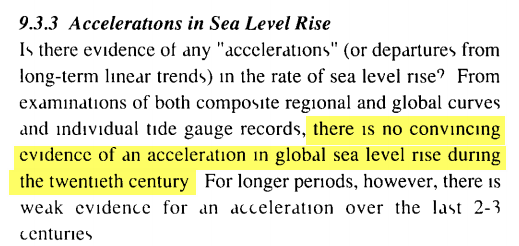
But the fraud is worse than it seems. The 1990 IPCC report showed around 1.2 mm/year and said there was no convincing evidence of acceleration during the 20th century.
https://www.ipcc.ch/ipccreports/far/wg_I/ipcc_far_wg_I_chapter_09.pdf
How did they go from 1.2 mm/yr to 3.1 mm/yr between 1990 and 2007? But the fraud is even worse than it seems. In 2004 the official rate of satellite sea level rise was only 2.8 mm/year.
web.archive.org/web/20040613002139/http://sealevel.colorado.edu/2004_rel1.2/sl_cu2004_rel1.2.pdf
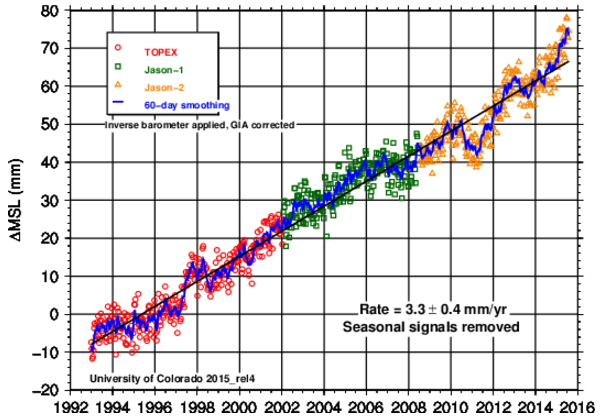
And now they have further bumped it up to 3.3 mm/year.
Using tide gauges, NOAA reports just over half that much sea level rise.
the absolute global sea level rise is believed to be 1.7-1.8 millimeters/year.
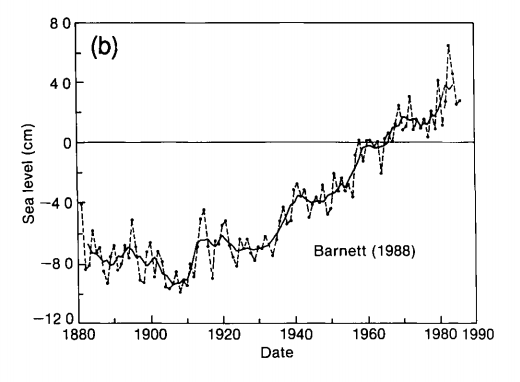
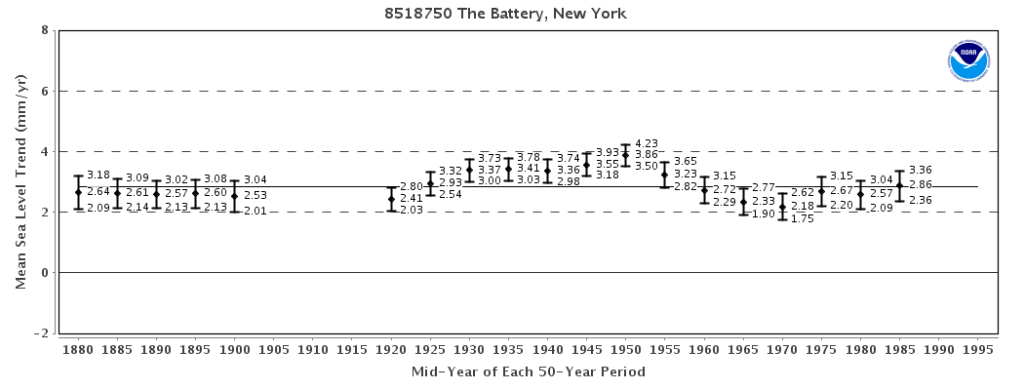
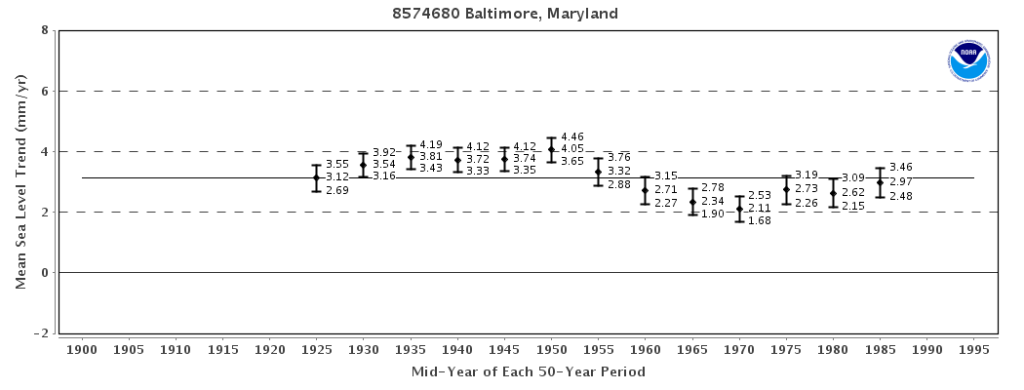
Tide gauges show that sea level rise rates peaked in the 1950’s. East coast tide gauges report high rates due to land subsidence, but they have slowed down over the past 60 years – not accelerated.
Sea Level Trends – Variation of 50-year Mean Sea Level Trends
Sea Level Trends – Variation of 50-year Mean Sea Level Trends
Climate scientists have no training in signal processing, and have a clear conflict of interest. They are not qualified in any way to do this sort of analysis, and keep bumping the numbers up to keep their funding coming in.

Steven, you still haven’t apologized to NOAA for denigrating their long range weather prediction for the CONUS during December. NOAA said warm, you said NOAA was wrong. Result: NOAA was right; you were wrong.
I’m so glad Martin is back, since I dropped cable TV and lost comedy channel.
Apparently, neither Steven nor you understand the mechanisms that are producing this unseasonably warm weather in the US. But you really should understand it by now. That’s what is disturbing here.
The western US is having a very cold December, but thanks for your stupid off-topic comment which serves no purpose other than to distract from the topic of the post.
Last winter, climate imbeciles ignored the Eastern US. This year they only see the Eastern US.
No they aren’t. Right now it’s mostly just normal in the western US, but up until last week, it was much warmer than normal for the whole US. The NOAA prediction has come true.Yours has come false. But I’m not trying to distract from the topic of your post. I just think, when you belittle someone who makes a science-based prediction that comes true while your own, non-science based prediction comes false, you should own up to it. That would give your posts like this one some credibility. As it is, you’re accusing NASA of fraud again without providing a shred of evidence of fraud, and you are basing your accusation on your implicit assumption that climate scientists in general, and the IPCC in particular, made no advances in climate science between the 1990 report and the 2007 report. And BTW, Steven, both the 1990 IPCC report AND the 2007 report are obsolete now. You must base accusations on the 2013 AR5 report now. Why aren’t you doing that?
[SG : I don’t make the NCEP forecasts, you moron. I’m not a forecaster. Your endless attempts to distract from the topic show your spectacular dishonesty]
http://realclimatescience.com/wp-content/uploads/2015/12/2015-12-21-07-39-32.png
Martin, you just said we shouldn’t believe them now either…..
Lat, seriously, how do you get that from what I wrote? The IPCC AR5 WG1 represents the current state of climate science as of 2013. We have made advances since then too. If you choose not to accept the science explained in that report, what science do you use?
But you claimed the NOAA prediction was wrong, and the NCEP prediction didn’t allow you to make that claim. So the claim was yours, not the NCEP’s.
And I did address your topic. Your accusation is baseless, as usual.
[SG : Your brainless off-topic banter will get you banned shortly]
“The IPCC AR5 WG1 represents the current state of
climate sciencePROPAGANDA as of 2013.”Is the IPCC being consistent in both draft and final figure, including non-peer reviewed content?
NO! The IPCC has no reason and no desire to be consistent with peer-reviewed or non-peer reviewed content.
The IPCC only needs to be consistent with the decisions made by politicians when amending and approving the Summary for Policymakers.
When John Houghton was IPCC Chairman. He decreed:
“We can rely on the Authors to ensure the Report agrees with the Summary.”
This was done and has been the normal IPCC procedure since then. So, IPCC custom and practice dictate that the AR5 report will be edited to match the SPM. This custom and practice enabled the infamous ‘Chapter 8? scandal.
Such adjustment of Reports to agree with the SPM is stated in Appendix A of the AR5. It says
I would be grateful if anybody were able to explain why some people like Marty want to think the IPCC is a scientific organisation when the purely political nature of the IPCC is declared by its name, its nature, its governing principles and its official procedures as stated in its own words in its own documents.
The IPCC is only permitted to say AGW is a significant problem because they are tasked to accept that there is a “risk of human-induced climate change” which requires “options for adaptation and mitigation” that can be selected as political polices and the IPCC is tasked to provide those “options”.
This is clearly stated in the “Principles” which govern the work of the IPCC. Near the beginning of that document says
So, the IPCC does NOT exist to summarise climate science. That has NEVER been its role.
The IPCC exists to provide
(a) “information relevant to understanding the scientific basis of risk of human-induced climate change”
and
(b) “and options for adaptation and mitigation” which pertain to “the application of particular policies”.
Hence, its “Role” demands that the IPCC accepts as a given that there is a “risk of human-induced climate change” which requires “options for adaptation and mitigation” which pertain to “the application of particular policies”.
Since a draft of the IPCC report BEFORE the politicians got at it was made available this has become evident by comparing the before and after copies.
FIXING THE FACTS: McIntyre on IPCC’s switching the pea under the thimble
Gail, please stop whining. If you can show errors in the IPCC AR5 WG-1, please report them to the IPCC so they can be corrected. That’s how the process works.
HA HA HA HA HA HA HA HA HA HA HA HA HA HA HA HA HA HA HA HA
You have to be KIDDING!
Don’t you think that has been tried by IPCC scientists with credentials more lofty than mine?
46 statements by IPCC experts against the IPCC
Dr Robert Balling: “The IPCC notes that “No significant acceleration in the rate of sea level rise during the 20th century has been detected.” This did not appear in the IPCC Summary for Policymakers.
Dr Lucka Bogataj: “Rising levels of airborne carbon dioxide don’t cause global temperatures to rise…. temperature changed first and some 700 years later a change in aerial content of carbon dioxide followed.”
Dr John Christy: “Little known to the public is the fact that most of the scientists involved with the IPCC do not agree that global warming is occurring. Its findings have been consistently misrepresented and/or politicized with each succeeding report.”
Dr Rosa Compagnucci: “Humans have only contributed a few tenths of a degree to warming on Earth. Solar activity is a key driver of climate.”
Dr Richard Courtney: “The empirical evidence strongly indicates that the anthropogenic global warming hypothesis is wrong.”
Dr Judith Curry: “I’m not going to just spout off and endorse the IPCC because I don’t have confidence in the process.”
Dr Robert Davis: “Global temperatures have not been changing as state of the art climate models predicted they would. Not a single mention of satellite temperature observations appears in the IPCC Summary for Policymakers.”
Dr Willem de Lange: “In 1996 the IPCC listed me as one of approximately 3000 “scientists” who agreed that there was a discernible human influence on climate. I didn’t. There is no evidence to support the hypothesis that runaway catastrophic climate change is due to human activities.”
Dr Chris de Freitas: “Government decision-makers should have heard by now that the basis for the long-standing claim that carbon dioxide is a major driver of global climate is being questioned; along with it the hitherto assumed need for costly measures to restrict carbon dioxide emissions. If they have not heard, it is because of the din of global warming hysteria that relies on the logical fallacy of ‘argument from ignorance’ and predictions of computer models.”
Dr Oliver Frauenfeld: “Much more progress is necessary regarding our current understanding of climate and our abilities to model it.”
Dr Peter Dietze: “Using a flawed eddy diffusion model, the IPCC has grossly underestimated the future oceanic carbon dioxide uptake.”
Dr John Everett: “It is time for a reality check. The oceans and coastal zones have been far warmer and colder than is projected in the present scenarios of climate change. I have reviewed the IPCC and more recent scientific literature and believe that there is not a problem with increased acidification, even up to the unlikely levels in the most-used IPCC scenarios.”
Dr Eigil Friis-Christensen: “The IPCC refused to consider the sun’s effect on the Earth’s climate as a topic worthy of investigation. The IPCC conceived its task only as investigating potential human causes of climate change.”
Dr Lee Gerhard: “I never fully accepted or denied the anthropogenic global warming concept until the furore started after NASA’s James Hansen’s wild claims in the late 1980s. I went to the [scientific] literature to study the basis of the claim, starting with first principles. My studies then led me to believe that the claims were false.”
Dr Indur Goklany: “Climate change is unlikely to be the world’s most important environmental problem of the 21st century. There is no signal in the mortality data to indicate increases in the overall frequencies or severities of extreme weather events, despite large increases in the population at risk.”
Dr Vincent Gray: “The [IPCC] climate change statement is an orchestrated litany of lies.”
Dr Mike Hulme: “Claims such as ‘2500 of the world’s leading scientists have reached a consensus that human activities are having a significant influence on the climate’ are disingenuous … The actual number of scientists who backed that claim was only a few dozen.”
Dr Kiminori Itoh: “There are many factors which cause climate change. Considering only greenhouse gases is nonsense and harmful.”
Dr Yuri Izrael: “There is no proven link between human activity and global warming. I think the panic over global warming is totally unjustified. There is no serious threat to the climate.”
Dr Steven Japar: “Temperature measurements show that the climate model-predicted mid-troposphere hot zone is non-existent. This is more than sufficient to invalidate global climate models and projections made with them.”
Dr Georg Kaser: “This number [of receding glaciers reported by the IPCC] is not just a little bit wrong, it is far out by any order of magnitude … It is so wrong that it is not even worth discussing.”
Dr Aynsley Kellow: “I’m not holding my breath for criticism to be taken on board, which underscores a fault in the whole peer review process for the IPCC: there is no chance of a chapter [of the IPCC report] ever being rejected for publication, no matter how flawed it might be.”
Dr Madhav Khandekar: “I have carefully analysed adverse impacts of climate change as projected by the IPCC and have discounted these claims as exaggerated and lacking any supporting evidence.”
Dr Hans Labohm: “The alarmist passages in the IPCC Summary for Policymakers have been skewed through an elaborate and sophisticated process of spin-doctoring.”
Dr Andrew Lacis: “There is no scientific merit to be found in the Executive Summary. The presentation sounds like something put together by Greenpeace activists and their legal department.”
Dr Chris Landsea: “I cannot in good faith continue to contribute to a process that I view as both being motivated by pre-conceived agendas and being scientifically unsound.”
Dr Richard Lindzen: “The IPCC process is driven by politics rather than science. It uses summaries to misrepresent what scientists say and exploits public ignorance.”
Dr Harry Lins: “Surface temperature changes over the past century have been episodic and modest and there has been no net global warming for over a decade now. The case for alarm regarding climate change is grossly overstated.”
Dr Philip Lloyd: “I am doing a detailed assessment of the IPCC reports and the Summaries for Policy Makers, identifying the way in which the Summaries have distorted the science. I have found examples of a summary saying precisely the opposite of what the scientists said.”
Dr Martin Manning: “Some government delegates influencing the IPCC Summary for Policymakers misrepresent or contradict the lead authors.”
Dr Stephen McIntyre: “The many references in the popular media to a ‘consensus of thousands of scientists’ are both a great exaggeration and also misleading.”
Dr Patrick Michaels: “The rates of warming, on multiple time scales, have now invalidated the suite of IPCC climate models. No, the science is not settled.”
Dr Nils-Axel Morner: “If you go around the globe, you find no sea level rise anywhere.”
Dr Johannes Oerlemans: “The IPCC has become too political. Many scientists have not been able to resist the siren call of fame, research funding and meetings in exotic places that awaits them if they are willing to compromise scientific principles and integrity in support of the man-made global-warming doctrine.”
Dr Roger Pielke: “All of my comments were ignored without even a rebuttal. At that point, I concluded that the IPCC Reports were actually intended to be advocacy documents designed to produce particular policy actions, but not a true and honest assessment of the understanding of the climate system.”
Dr Paul Reiter: “As far as the science being ‘settled,’ I think that is an obscenity. The fact is the science is being distorted by people who are not scientists.”
Dr Murray Salby: “I have an involuntary gag reflex whenever someone says the science is settled. Anyone who thinks the science is settled on this topic is in fantasia.”
Dr Tom Segalstad: “The IPCC global warming model is not supported by the scientific data.”
Dr Fred Singer: “Isn’t it remarkable that the Policymakers Summary of the IPCC report avoids mentioning the satellite data altogether, or even the existence of satellites — probably because the data show a slight cooling over the last 18 years, in direct contradiction of the calculations from climate models?”
Dr Hajo Smit: “There is clear cut solar-climate coupling and a very strong natural variability of climate on all historical time scales. Currently I hardly believe anymore that there is any relevant relationship between human CO2 emissions and climate change.”
Dr Richard Tol: “The IPCC attracted more people with political rather than academic motives. In AR4, green activists held key positions in the IPCC and they succeeded in excluding or neutralising opposite voices.”
Dr Tom Tripp: “There is so much of a natural variability in weather it makes it difficult to come to a scientifically valid conclusion that global warming is man made.”
Dr Gerd-Rainer Weber: “Most of the extremist views about climate change have little or no scientific basis.”
Dr David Wojick: “The public is not well served by this constant drumbeat of alarms fed by computer models manipulated by advocates.”
Dr Miklos Zagoni: “I am positively convinced that the anthropogenic global warming theory is wrong.”
Dr Eduardo Zorita: “Editors, reviewers and authors of alternative studies, analysis, interpretations, even based on the same data we have at our disposal, have been bullied and subtly blackmailed.”
Gail, please stop whining. You listed opinions, not scientific errors. If you know of any actual errors in the report, please report them to the4 IPCC. They appreciate error reports. If you don’t know odf any errors, then please just stop your incessant whining.
So any errors that the IPCC chooses to ignore are just “whining.” That’s an interesting interpretation of the scientific method you have there.
OH, So now the SCIENTIFIC JUDGEMENT of EXPERTS in the field who WERE IPCC AUTHORS on the ERRORS made by the IPCC, is called whining.
Do you really think all those scientists sat back and did NOTHING except make off-handed comments? ESPECIALLY when it was their work that got changed?
Even the IPCC reviewers complained that their comments were completely ignored. (Lost link)
Some exasperated …climate scientists have been very critical of the IPCC. Some are suggesting the IPCC should be disbanded…
Thus the NIPCC, a group of some 50 or more scientists was born.
…………..
So yes they DID make comments to the IPCC, to journals, to the MSM and WERE IGNORED! So they formed a different group looked at the same peer-reviewed reports.
Critique of IPCC SPM AR5 (1)
And the response from the IPCC was ‘La, La, La—I Can’t Hear You’
James Annan, a scientist with the Global Change Projection Research Programme of the Japan Agency for Marine-Earth Science and Technology, and a leading researcher into constraints on estimates of climate sensitivity has been arguing for years that the IPCC’s stance is scientifically unjustified. Annan suggests that the IPCC is more tied to the results of “a small private opinion poll” than it is to the broader literature
In House testimony, Botkin dismantled the IPCC 2014 report. Daniel B. Botkin, a world-renowned ecologist, is Professor (Emeritus), Department of Ecology, Evolution and Marine Biology, UC Santa Barbara, and President of The Center for The Study of The Environment, which provides independent, science-based analyses of complex environmental issues.
WRITTEN TESTIMONY TO THE HOUSE SUBCOMMITTEE ON SCIENCE, SPACE, AND TECHNOLOGY. MAY 29, 2014
http://science.house.gov/sites/republicans.science.house.gov/files/documents/HHRG-113-SY-WState-DBotkin-20140529.pdf
Video
https://www.youtube.com/watch?v=GgWeYL_fynQ
Two scathing letters critical of the IPCC process were published on Friday April 25th; one from Dr. Robert Stavins, an IPCC chapter Co-Coordinating Lead Author, and a five year veteran of the process, plus another by Dr. Richard Tol, who asked his name to be removed from work he was contributing to because it was “too alarmist”.
So it is not only politics it is DIRTY POLITICS.
The IPCC, having spent almost two months working out how to respond to my complaint about a notoriously bogus graph in its Fourth Assessment Report, has found itself not guilty. In doing so, it is wilfully perpetuating a fraud, which will now be reported to the prosecuting authorities. — Is it time to prosecute the IPCC for fraud?
The IPCC explained:
I do not know of one single person being harmed by the warm weather, except maybe the makers of winter clothing.
In fact, everyone loves it and enjoys not freezing their butts off.
So, if twenty degrees above normal is not killing anyone, how is 1.5 degrees above normal going to do that?
leave it to the eco-KOOKS to use alarmist speculation about unseasonable weather. I make a prediction..by next year the eco-KOOKS will make some kind of alarmist prediction about cooling / warming / change / no change and they will proclaim that as “evidence”.
This post is about sea levels.
If You are not serious or scientific honest You change stick in the middle of a game.
Yes, the IPCC discussion of sea level is found in chapter 13 here: http://www.ipcc.ch/report/ar5/wg1/
Steven is deliberately ignoring the OPCC discussion of sea level, but he wants you to think he really isn’t ignoring it.
If you are not serious or scientific (sic) honest, you deliberately use the obsolete report rather than using the current report.
Martin, please try to be honest for just one time in your entire life, OK?
Are you simply a trolling climate liar, or are you actually stupid enough to believe the ridiculous crap you post?
Please be specific.
You want everyone to think you know what you are talking about, but you do not, and we all want to know why?
23 Aug 2011 — NASA Global sea levels DROPPED 5mm in 2010
September 16, 2011 — Sea Level Continues Decline
The two-year-long decline is continuing at a rate of 5mm per year
In August 2011, NASA announced that global sea level was dropping and was “a quarter of an inch lower than last summer.”
http://iceagenow.info/wp-content/uploads/2011/09/DecliningSeaLevel1.png
Envisat numbers here:
ftp://ftp.aviso.oceanobs.com/pub/oceano/AVISO/indicators/msl/MSL_Serie_EN_Global_IB_RWT_NoGIA_Adjust.txt
More on the SEA LEVEL HAS DROPPED:
Mid to late Holocene sea-level reconstruction of Southeast Vietnam using beachrock and beach-ridge deposits
Translation the sea level was up to 1.5 meters higher than today in a tectonically stable area ~5000 years ago to 2000 years ago. Tectonically stable area refers to areas devoid of deformation such as all processes which modify the external form of the crust. For example unidirectional vertical movements, plate tectonics and also the rise and fall of the solid earth surface, especially in coastal areas, caused by external factors such as climate change (gio-isotasy, hydro-isotasy)
TEN PEER-REVIEWED PAPERS PROVING SEA LEVEL IS NOT RISING
https://media2.stickersmalin.com/produit/100/stickers-devil-smile-R1-143760-2.png
What is your point, Gail? We know why sea level went lower during that time. It was floods, basically. Read about them here: https://en.wikipedia.org/wiki/Category:2011_floods
SO Marty the TROLL, is going to ignore the ten PEER-REVIEWED studies because he hasn’t got a quick answer from the William Connelly Ministry of Propaganda aka WIKI.
Oooh cf is going to be upset with you Marty; Quoting an non-peer reviewed source like Wiki.
OH, and the last I heard FLOODs caused by rain water go into rivers and head straight for the sea within days and weeks so TWO YEARS of sea level fall can not be explained by FLOODS.
So the Connelly’s explanation doesn’t stand up to elimentary logic. Only an increase in land based ice would cause land precipitation to decrease sea levels and the Connelly isn’t about to go there.
Marty!
Oh, Marty. You scamp.
Floods cause seas levels across the entire globe to fall?
Then what about the droughts?
Floods, as Gail pointed out, run to the sea within a few days to a few weeks at most.
but droughts can persist for years.
So, will the droughts warned of by CAGW scaremongers such as yourself lead to long term sea levels to begin to fall?
(And by the way, your puppet masters, the IPCC, did not mention any of this…are you claiming to know more than them?)
Or do floods and droughts cancel out and have no effect because they are always occurring somewhere (just look at every other year in your wiki page), and total precipitable moisture remain fairly constant across the globe due to total evaporation from the global sea surface being fairly constant?
Point-measurements of sea-level rise at a tide-gauge do not mean much in the context of global sea level rise.
Well how was it measured before satellite?
Well You do rely on temperatures measured from satellites more I guess!
Point-measurements of temperature at a Stevenson Screen do not mean much in the context of global temperature rise.
Can you point us to a peer reviewed study showing that tide gauges can’t be trusted? If you can, then you’ll have to concede that we simply don’t know how the sea level was changing before 1993, therefore we STILL can’t claim a rate increase over the last century. Either the data is valid, or it’s not.
Sea-level rise seems to be accelerating lately.
http://www.aviso.altimetry.fr/fileadmin/images/data/Products/indic/msl/MSL_Serie_MERGED_Global_IB_RWT_GIA_Adjust_2015.png
[SG : I’m always impressed by more fraudulent data from the same sources I am exposing]
If You look at the two bottom figures in this post-You will find acceleration and slowdowns.
50 Years mean is accurate.
Gauges are more relevant.
If you remove the large DROP in 2010, the 2015 rise is less significant than the 1998 rise. So your claim of an increase is directly predicated on a decrease. I see your understanding of the scientific method is as solid as Martin’s.
SG got a peer-reviewed reference for evidence of fraud? Making unsubstantiated claims does not expose anything..
It can easily be demonstrated that the historical data has been changed. See my other posts.
Further development of processing algorithms does not mean that historical data “has been changed”.
cfgjd says: December 21, 2015 at 5:29 pm
Further development of processing algorithms does not mean that historical data “has been changed”.
change CH?nj verb
1. make or become different.
The 2004 version of the 1992 – 2004 time series has been made different as shown in the 2015 version.
But he did substantiate them.
cfool seems to think that deliberately altering scientific data and using it to promote a cause, isn’t FRAUD.
Guess what cfool.. IT IS.
…and hopefully some day, these fraudsters will be held to account.
Do you want your name included, for aiding and abetting ?
If you analyse today’s data from CU’s Sea Level Research Group
http://sealevel.colorado.edu/files/2015_rel4/sl_ns_global.txt
You will find that the first 11 years from 1993 to 2004 come to about 3.5 mm/yr
and from 2004 to 2015 it comes to 3.2 mm/yr.
That’s not acceleration in anybody’s book
“Sea-level rise ADJUSTMENTS seems to be accelerating lately.”
There fixed it for you.
Bullshit. These communities work openly. What kind of evidence of fraud can you provide? None, I presume.
See my other posts, What had been 2.6 mm/yr is now 3.5 mm/yr.
The historical data has been rewritten.
Satellite altimetry is just a few decades old, it is clear that in 2015 the data and corrections are much better understood than even 10 years ago. The new numbers are more accurate and no evidence of any fraud has been presented.
cfgjd says:
December 21, 2015 at 5:17 pm
Satellite altimetry is just a few decades old, it is clear that in 2015 the data and corrections are much better understood than even 10 years ago. The new numbers are more accurate and no evidence of any fraud has been presented.
The data has been changed.
In 2004 the 1992-2004 data said 2.6 mm/yr
Today that same time series says 3.5 mm/yr
Steve Case AGAIN posted the adjustments to sea level.
And just like everything else the ‘adjustments’ favor the CAGW meme.
“Once is happenstance. Twice is coincidence. Three times is enemy action” — Ian Fleming
Ice Cores #1
Temperatures #2 as Steven Goddard and I and others have shown.
And as Steve Case showed Sea level makes number three….
And if you want #4. L.S. and his buds are flattening the historic solar record.
ALL the ‘adjustments’ to the data are made so they fall in line with the CAGW ASSumption.
If this was shown in a court of law where you owed the IRS a lot of money those adjustments would never stand up. However since it supports the peasants handing over lots of $$$ to the elite no one can get any traction on refuting it. Heck the ClimAstrologists refuse to debate skeptics, a very telling action on their part. And the MSM bans skeptic articles and even skeptic comments.
And #5, if you want the big fat elephant in the room FOLLOW THE MONEY!
WHO the heck do you think OWNS the printing presses and the governments? The peasants? Or the corporate and financial elite who fund campaigns, direct government, give grants to academia and own the media outright.
‘Solargate’ Didn’t Happen By Accident”
At this point, as far as I am concerned the next Ice Age can’t get here fast enough. The Human gene pool has demonstrated it really really needs another kick in the rear!
You for got this one:
Correcting Ocean Cooling
http://earthobservatory.nasa.gov/Features/OceanCooling/
Bullshit Gail, I’m willing to bet you have never even met an altimetry-engineer nor have you any idea how the processing has been developed, in an open fashion, in the scientific communities. The state-of-the-art in processing in 2015 is better than 2004. A real expert could tell you exactly what is the difference between 2004 and 2015 processing, in any case it’s all documented.
cfgjd says: December 21, 2015 at 6:38 pm
Bullshit Gail, I’m willing to bet you have never even met an altimetry-engineer nor have you any idea how the processing has been developed, in an open fashion, in the scientific communities. The state-of-the-art in processing in 2015 is better than 2004. A real expert could tell you exactly what is the difference between 2004 and 2015 processing, in any case it’s all documented.
If processing were improved you’d think that it would come closer to what the tide gauges say. But it doesn’t, the “improvement” goes the other way.
What do “climate scientists” have got to do with sea-level measurements? These are calibrated by teams of instrument engineers, oceanogaphers, physicists and other scientists. How wide is the purported conspiracy in STEM-fields? Hold on to your propellered tin-foil hats…
About the same as CO2 and global temperature
I don’t believe anyone is claiming a conspiracy in sea level measurements. There’s a sudden, pronounced, step change in the rate of change, corresponding precisely to a change in data collection methods. The claim being made is that the new data collection methods haven’t been validated against the old methods. Both show steady rates, but at different magnitudes. Regardless of which is correct, if either, it’s impossible to switch sets within the same chart, and not see that step. Feel free to try it at any year you choose. The tide gauges are still showing 1.7-1.8mm/yr, as they always have. Until that discrepancy can be rectified, it’s utterly meaningless to combine the data sets. They’re plainly measuring different things.
How wide is the conspiracy? Mostly admitted by the IPCC and related government studies.
How about data from Renowned oceanographic expert Nils-Axel Mörner
has studied sea level and its effects on coastal areas for some 45 years. Recently retired as director of the Paleogeophysics and Geodynamics Department at Stockholm University, Mörner is past president (1999-2003) of the INQUA Commission on Sea Level Changes and Coastal Evolution, and leader of the Maldives Sea Level Project.
There Is No Alarming Sea Level Rise! by Nils-Axel Mörner
the El Niño/La Niña-Southern Oscillation, a quasi-periodic climate pattern that occurs across the tropical Pacific Ocean every few years.) Therefore, a much more realistic approach is to treat that ENSO-signal as a separate event, superimposed on the long-term trend, as shown in Figure 6 (Mörner 2004). Figure 6 shows a variability (of ±10 mm) around a stable zero level (blue line) and a strong ENSO-event (yellow lines) in 1997. The trend thereafter is less clear (gray lines). This graph provides no indication of any rise over the time-period covered (Mörner 2004, 2007a, 2007c).
When the satellite altimetry group realized that the 1997 rise was an ENSO signal, and they extended the trend up to 2003, they seemed to have faced a problem: There was no sea level rise visible, and therefore a “reinterpretation” needed to be undertaken. Originally, it seemed that this extra, unspecified “correction” referred to the global isostatic adjustment (GIA) given as 2.4 mm/year (see, for example, Peltier 1998) or 1.8 mm/year (IPCC 2001). The zero isobase of GIA according to Peltier (1998) passed through Hong Kong, where one tide-gauge gives a relative sea level rise of 2.3 mm/year. This is exactly the value appearing in Figure 7. This tide-gauge record is contradicted by the four other records existing in Hong Kong, and obviously represents a site specific subsidence, a fact well known to local geologists.
Nevertheless, a new calibration factor has been introduced in the Figure 7 graph. At the Moscow global warming meeting in 2005, in answer to my criticisms about this “correction,” one of the persons in the British IPCC delegation said, “We had to do so, otherwise there would not be any trend.” To this I replied: “Did you hear what you were saying? This is just what I am accusing you of doing.”
http://www.21stcenturysciencetech.com/Articles_2011/Winter-2010/Morner.pdf
And then there is this: http://www.star.nesdis.noaa.gov/sod/lsa/SeaLevelRise/documents/NOAA_NESDIS_Sea_Level_Rise_Budget_Report_2012.pdf
Steve Goddard writes:
In 2004 the official rate of satellite sea level rise was only 2.8 mm/year.
Actually it was less than that. If you follow this link
https://web.archive.org/web/20040327115248/http://sealevel.colorado.edu/
and then follow the link to
mean sea level time series
and then select text under
[Inverted barometer applied][Seasonal signal removed][text]
you will get a columnar tabulation of data:
year msl_ib(mm) #version_2004_rel1.2
1992.928 -1.184
through
2003.842 26.260
If you analyse that it comes to 2.6 mm/yr
Plotted out and compared to today’s version it looks like this:
http://oi67.tinypic.com/ojdn6h.jpg
BTW there were about 24000 participants in AGU – what other skeptic contributions were there in addition to the one poster by WUWT?
Please state your specific lie.
General lies are just sort of a head scratcher.
Random information and questions are just random.
Couple of cautions.
Tide gauges have to be selected where land is stationary. These days, those can be found using differential GPS rather than by inferential geology.
Sat altimetry has considerable uncertainty. The latest bird, Jason 2, has locational repeatability spec of 3mm or less. Main reasons are waves (not measuring a flat surface) and varying troposphere humidity (slightly retarding the signal). Instrument drift spec is less than 1mm/year. The ups and downs of Jason -2 dataplot are almost certainly instrument drift.
Finally, from the last shown sat plot you have to subtract whatever the GIA adjustment is if one wants to compare to stationary tide gauges.
Altimetry and tide gauges agree at the tide-gauges, or at the free ocean points that are closest to the tide gauges. Due to the footprint of the altimeter one needs to go several km offshore I believe.
In other words, you’re claiming there’s a growing hump of water in the open ocean. That would be of academic interest only which means that nobody but academics care if there is. But what I do care about is reports in the popular press that use the 3.3 mm/yr that is now claimed as an excuse to pry billions out of the tax payers in places like California that effectively don’t have any sea level rise.
Its all the heat, hiding at the bottom of the ocean, it’s making the middle swell up like a cake.
Yes the heat is making the ocean swell, like during an El Nino.
There is no extra heat.. none for 18+ years.
There is NO sea level acceleration. NONE
There is NO CO2 SIGNAL in the sea level data, NONE WHAT SO EVER.
Sorry, I forgot the /sarc tag
Jason makes measurements of sea surface with two frequencies: 5.3 and 13.6 GHz, which works out to wavelengths of 22 and 57 mm. Assuming standard Rayleigh limits of 1/4 wavelength and you ought to have a 5mm error bar right off the bat. Throw in all the other variables, such as ocean waves, tidal effects, gravity anomalies, barometric effects, orbital uncertainties and humidity effects on signal propagation, and they still claim measurements to a tenth of a millimeter per year?
Some one correct me if I am looking at this wrong — but it certainly does not look reasonable to me!
The spec is repeatability to less than 3mm. That means +/- 3. I just went and reread that portion of the Jason 2 documentation archived for essay Pseudoprecision. You are on very sound technical grounds with your comment. The ridiculously foolish papers ‘explaining’ the Jason ‘deceleration’ never bothered to check that there was no signal to explain. Those warmunists simply made fools of themselves.
Please explain why altimeter engineers would be “warmunists” any more than climate skeptics? Are all engineers now also in the conspiracy? That would explain the VW emissions scandal scam too…
In my view the big problem with the satellites is that the measurements are taken sequentially over the 2 hour period of an orbit. To cover the globe with a single measurement takes 9.9 days and the measured area does not include anywhere within the Arctic or Antarctic circles. Water moves around much quicker than this due to tides and weather.
How do they account for the water that may move in and out of the measured zone? How do they apply barometric corrections contemporaneously with the measurement?
The Engineers would never claim accuracy to 1/50th of what is measurable.
http://wcrp.ipsl.jussieu.fr/Workshops/SeaLevel/Posters/2_14_Doran.pdf..
quote
“The reasonable agreement indicates that assuming the sea level rise rate of 1.8 mm/yr is not that far off from the true rate.”
http://www.gps.gov/governance/advisory/meetings/2011-06/bar-sever.pdf
quote
“Impact of TRF on GMSL Record from Tide Gauges: competing approaches for TRF
realization yield estimates for sea-level rise ranging from 1.2 to 1.6 mm/yr”
And more to read…
http://wattsupwiththat.com/2012/10/30/finally-jpl-intends-to-get-a-grasp-on-accurate-sea-level-and-ice-measurements/
quote
“New proposal from NASA JPL admits to “spurious” errors in current satellite based sea level and ice altimetry, calls for new space platform to fix the problem.”
Not to mention the use of models to ‘adjust the real world data….AGAIN
New Paper On Sea Level Rise Adjusts The Data To Match The Models
Concensus? WHAT Concensus?
……………
The AGU studies are mainly funded by the NSF (has control of US government grants) and NOAA’s Climate Program Office.
So again it is FOLLOW THE MONEY and we are all well aware that Obama’s government is not gabout to fund skeptic research.
Why would you fund a pseudoscientific cult which only managed to produce ONE POSTER for the AGU 2015 fall meeting? Seriously was that THE ONLY skeptic output in this year’s AGU???
Unfortunately, free taxpayers ca$h is unavailable to skeptics. If it was, there would lots of bizarre papers – a bit like the rest of the AGU output.
http://link.springer.com/article/10.1007%2Fs00190-010-0412-4
“Abstract
We examined the sensitivity of estimates of global sea-level rise obtained from GPS-corrected long term tide gauge records to uncertainties in the International Terrestrial Reference Frame (ITRF) realization. A useful transfer function was established, linking potential errors in the reference frame datum (origin and scale) to resulting errors in the estimate of global sea level rise. Contrary to scale errors that are propagated by a factor of 100%, the impact of errors in the origin depends on the network geometry. The geometry of the network analyzed here resulted in an error propagation factor of 50% for the Z component of the origin, mainly due to the asymmetry in the distribution of the stations between hemispheres. This factor decreased from 50% to less than 10% as the geometry of the network improved using realistic potential stations that did not yet meet the selection criteria (e.g., record length, data availability). Conversely, we explored new constraints on the reference frame by considering forward calculations involving tide gauge records. A reference frame could be found in which the scatter of the regional sea-level rates was limited. The resulting reference frame drifted by 1.36 ± 0.22 mm/year from the ITRF2000 origin in the Z component and by ?0.44 ± 0.22 mm/year from the ITRF2005 origin. A bound on the rate of global sea level rise of 1.2 to 1.6 mm/year was derived for the past century, depending on the origin of the adopted reference frame. The upper bound is slightly lower than previous estimates of 1.8 mm/year discussed in the IPCC fourth report.”
I’ll repeat that last bit in caps
“A BOUND ON THE RATE OF GLOBAL SEA LEVEL RISE OF 1.2 TO 1.6 MM/YEAR WAS DERIVED FOR THE PAST CENTURY, DEPENDING ON THE ORIGIN OF THE ADOPTED REFERENCE FRAME. THE UPPER BOUND IS SLIGHTLY LOWER THAN PREVIOUS ESTIMATES OF 1.8 MM/YEAR DISCUSSED IN THE IPCC FOURTH REPORT.”
Again. I invite the sea level worriers to go to
http://tidesandcurrents.noaa.gov/sltrends/sltrends.html
and find one single tide record that shows any acceleration.
Put up.. if you have the capability.. which NONE of you do.
This link
http://www.aviso.altimetry.fr/fileadmin/documents/OSTST/2011/oral/02_Thursday/Splinter%203%20SCI/04%20Nerem%20ostst_2011_nerem.pdf
go all the way to the last page says acceleration is a negative -0.06 mm/yr².
That’s a few years old now, but the negative sign on acceleration remains.
Note re sea level at Battery NY
https://i2.wp.com/realclimatescience.com/wp-content/uploads/2015/12/8518750-1-1024×390.png
Surveys have shown that Battery is subsiding at approximately 2mm/year, this gives a mean sea level rate of about 1-1.5mm/year.
And again, we see ABSOLUTELY NO ACCELERATION in the tide data.. in fact, the last 5 years looks like its decreasing.
http://s19.postimg.org/dmwje8xbn/battery_NY_SL.jpg
There is something seriously wrong with the satellite data.
Unfortunately, while the political and financial bias towards creating increased sea level rise exists, they are unlikely to find the cause of the discrepancy.
PS, further hunting I found the subsidence around 1.6mm/year..
So again, REAL sea level rise of around 1-1.5mm/year, NOT accelerating.
This is the bottom line.
We live on land, and only people at the coast are affected by sea level.
So the only thing that matters is what the sea level is where the ocean meets the land.
And this info is recorded by tide gages which have been in the same places for long periods of time.
Any of these liars who want to scare fools and children with their witless nonsense should be ignored studiously.
Right up until they start to be prosecuted and/or horsewhipped in public.
Personally, I am fine with bringing back public shaming and corporal punishment for people who purposefully lie in order to extract public funds or to create fear.
I’ve lived in the Sydney Newcastle area all my life.. and there has been no discernible sea level change.
With a measured change around 2-3cm….. with a tide range of around 2m, who would notice anyway
The rocks are still bare at low tide, full tide reaches no higher than it used to when I was a nipper.
This stupid panic about a tiny rise in sea levels, really is quite hilarious.
Until the SUV was invented…. Isostatic changes never occurred because glacers never melted… the isostatic correction is such BS.
I don’t think the satellite-data shows much acceleration either, possibly even none.
The only way any acceleration can be created is by grafting the satellite data onto the tide data…
This is either scientific and mathematical ineptitude and ignorance…..
…. or intentional fraud.
You choose which. 😉
The higher they can get the numbers, the higher is their salary and the longer are their Grants. This is not Science, this is Rent-Seeking. Alarmists are no longer interested in science as it has served its purpose.
So how come skeptics cannot prove tampering of something is happening? Accusations only, not much substance.
You ignore the substance, dozens of quotes from scientists and papers above you.
I can only come up with two explanations why cfxyz keeps posting this nonsense. He could be a rent-seeker himself but he doesn’t sound smart enough even for that. I think he’s a patsy.
Lonely and masochistic, is my guess.. and this is the best he can manage. 😉
We have.
This has to be the FUNNIEST thing seen this year !!
http://www.express.co.uk/news/uk/628524/Climate-change-shock-Burning-fossil-fuels-COOLs-planet-says-NASA
And.. where is that El Nino going ???
http://notrickszone.com/2015/12/21/the-super-collapsing-el-nino-ncep-cfsv2-n-hemisphere-temps-plummet-1c-in-a-single-week/comment-page-1/#comment-1067055
AndyG,
If that is for real and the El Nino has fizzled it is going to be an interesting 2016.
The warmists ignore the fact that an El Nino is a sign of ocean heat beating feet out the door and headed for space. Since it is the sun that heats the ocean and cycle 24 is a dud, there is not as much energy to heat the ocean.
NASA
Solar Spectral Irradiance (SSI) Measurements.
Multiple instruments degradation trends make the observations in the following paper ‘ball park’
Recent variability of the solar spectral irradiance and its impact on climate modelling
Some of that UV and EUV does make it to the earth’s surface and heat the oceans.
http://lasp.colorado.edu/media/projects/SORCE/images/news_images/SORCEchart5.png
red – SIM observed top of Atmosphere
gray – Modtran model top of Atmosphere
Green – earth surface
Blue – 10 meters below ocean surface.
http://www.john-daly.com/sverdrup.gif
So decreases in the shorter wavebands are going to have an impact on ocean heating particularly at depth.
That paper Recent variability of the solar spectral irradiance and its impact on climate modelling has some other interesting points. Since it is 33 pages long I will cut and paste parts of the paper. It has the usual kowtows to the CAGW Priestly Gatekeepers but it collaborates several of the points we have been trying to make.
The first point is that the IPCC and the ClimAstrologists in general have ignored anything but the CO2 effect on the climate. The conclusion of the paper makes it clear the sun has been ignored.
WTF! The IPCC and Hansen and everyone else has been screaming ‘The science is settled!’ and they haven’t even bothered to look at the effects of the sun on the climate???
http://www.webweaver.nu/clipart/img/people/men/rotlmao.gif
Not only that taxpayers are on the hook for trillions of dollars for ‘Global warming’ and yet they can’t site, calibrate and maintain the temperature measuring devices nor can they do decent long term measurements on the factor most likely to be the REAL control knob the variable sun.
Now into the nitty gritty of the paper. Do not forget the SORCE/SIM data is for the last part of cycle 23 and the 2008-2009 Deep Solar Minimum NASA talks about.
If you read between the lines the following supports HenryP and REN and I in our emphasis on ozone, QBO and zonal vs meridional jets.
And this is the use in the climate models. Notice that some of the models do not even have the effect of the sun on ozone.
This is the responses. Remember this is MODELS!
This tidbit is from a link on the banner here at Real Climate:
Climate Change: The IPCC Scientific Assessment (1990)
https://www.ipcc.ch/ipccreports/far/wg_I/ipcc_far_wg_I_chapter_09.pdf
9.3.3 Accelerations in Sea Level Rise
Is there evidence of any “accelerations” (or departures from long-term
linear trends) in the rate of sea level rise? From examinations of both
composite regional and global curves and individual tide gauge records,
there is no convincing evidence of an acceleration in global sea level
rise during the twentieth century For longer periods, however, there is
weak evidence for an acceleration over the last 2-3 centuries
What about the differences in global temperatures across the five different reports. It’s not just sea level data changes that are occurring across the different reports, historical global temperature data changes to better suit the IP CC narrative have occurred across the reports also. I’m not sure why but I guess they have a good reason to change it without explaining why because of course they are acting in the best interest of all mankind! Right?