
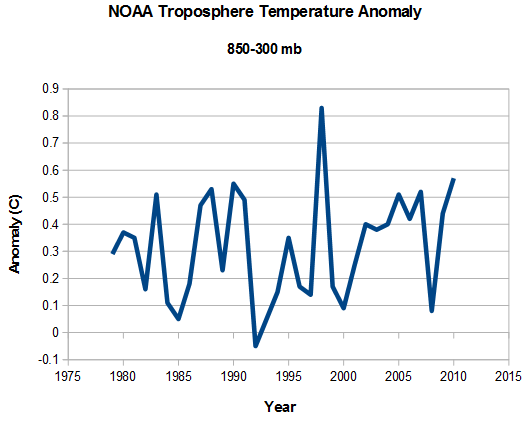
In their “hottest year ever” press briefing, NOAA included this graph, which stated that they have a 58 year long radiosonde temperature record. But they only showed the last 37 years in the graph.
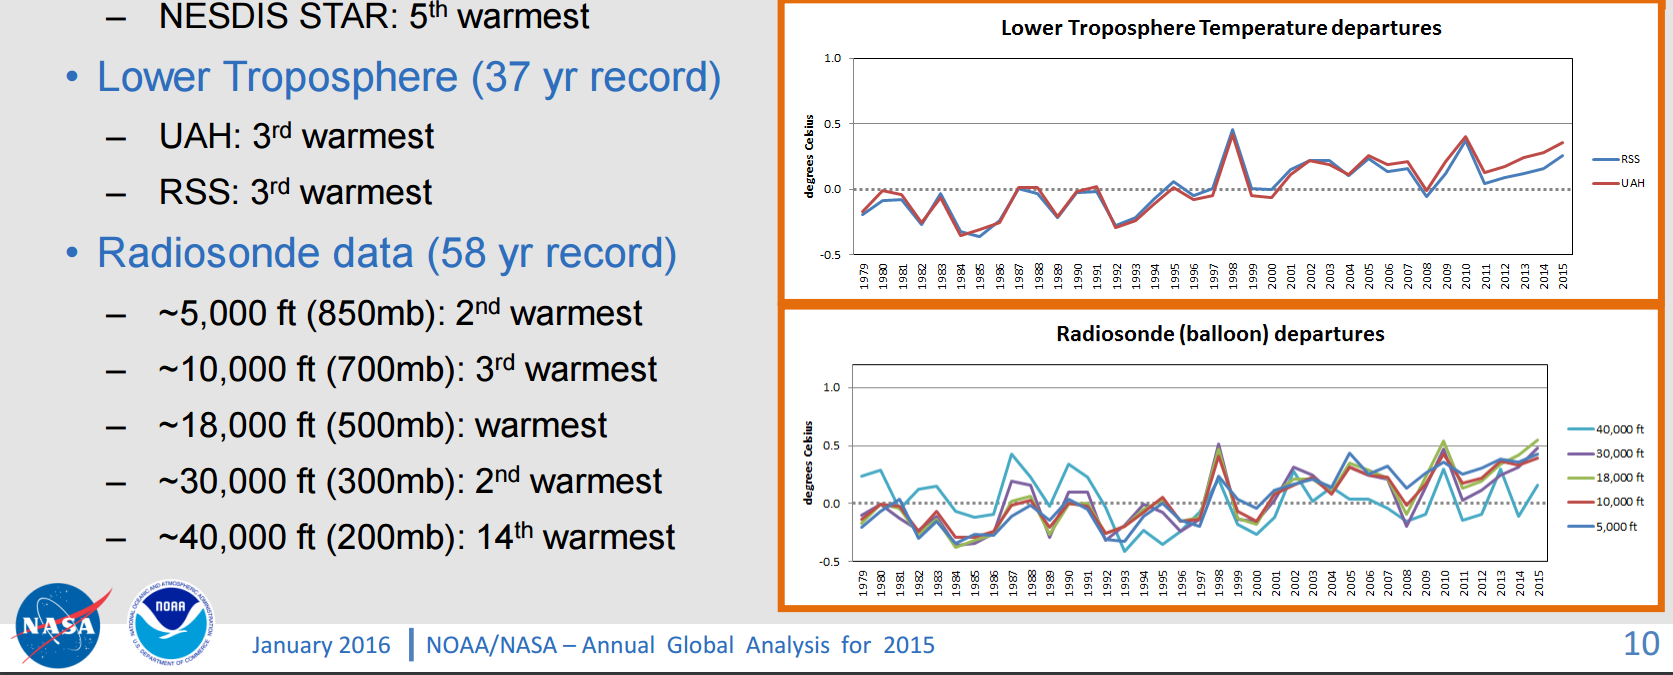
NESDIS Strategic Communications
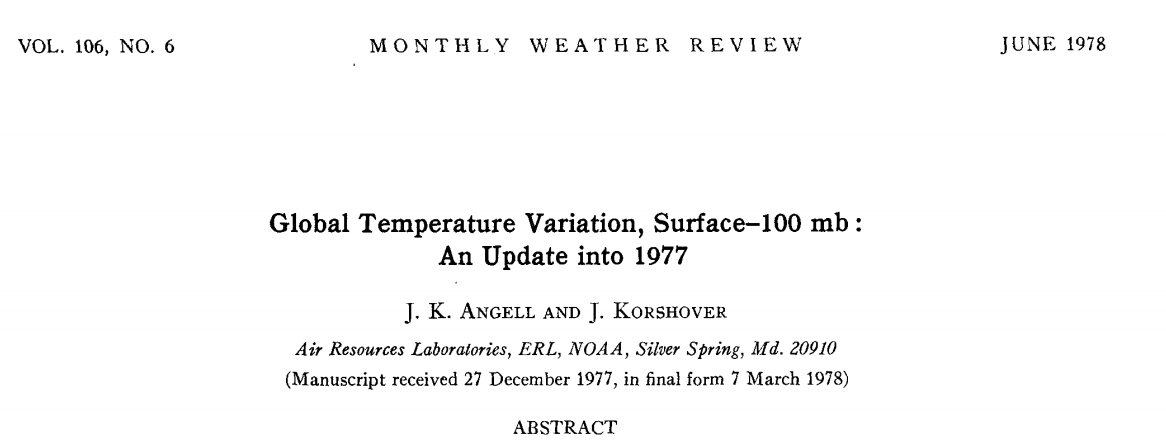
Here is why they are hiding the rest of the data. The earlier data showed as much pre-1979 cooling as the post-1979 warming.
1520-0493(1978)106<0755:GTVSMA>2.0.CO;2
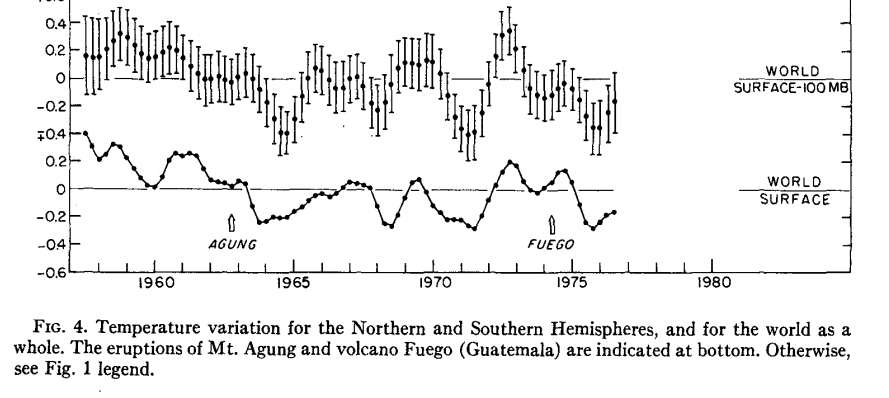
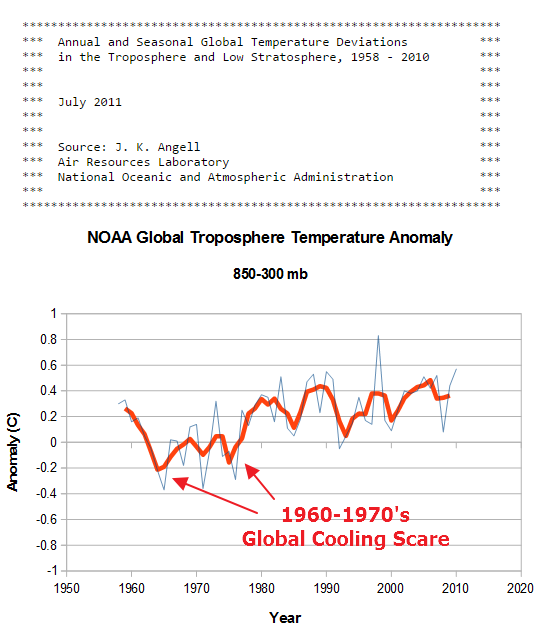
I combined the two graphs at the same scale below, and put a horizontal red reference line in, which shows that the earth’s atmosphere has not warmed at all since the late 1950’s
The omission of this data from the NOAA report, is just their latest attempt to defraud the public. NOAA’s best data shows no warming for 60 years. But it gets worse. The graph in the NOAA report shows about 0.5C warming from 1979 to 2010, but their original published data shows little warming during that period.
cdiac.esd.ornl.gov/ftp/trends/temp/angell/global.dat
Due to Urban Heat Island Effects, the NOAA surface data shows nearly one degree warming from 1979 to 2010, but their original radiosonde data showed little warming during that time. Global warming theory is based on troposphere warming, which is why the radiosonde data should be used by modelers – instead of the UHI contaminated surface data.
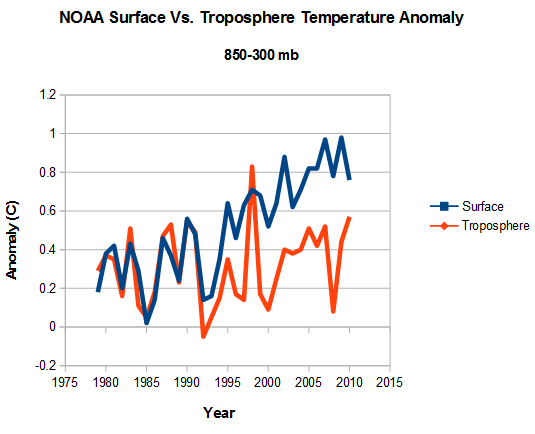
NOAA’s original published radiosonde data showed little net troposphere warming from 1958 to 2010, when the data set ended.
The next graph shows how NOAA has altered their 850-300 mb temperature data since 2011. Another hockey stick of data tampering.
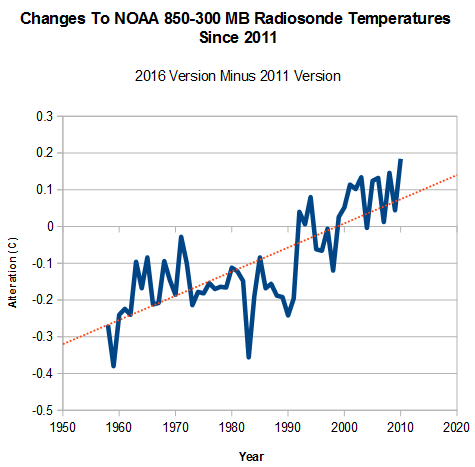

Too bad it doesn’t go back to the 1930’s.
ditto-Morgan
ditto-jlc
I have had my fill of politics already, and it has only just begun.
That is not to say, politics related to AGW.
My only comment is that I know of no politician, media person, entertainer or non-scientist who has a clue about the science.
—And, when I have some discourse with a scientist whose expertise falls outside of
physics and/or earth science, they do not even know the language I am using.
However, they view themselves as experts
Now, we may be getting some ENSO effects, including warm air at different atmospheric levels (pressures), alarmists are jumping aboard the satellite and perhaps weather balloon train. Roy Spencer is above all a very honest person. Refreshing!
However, because the ENSO is generally caused by a lack of oceanic over turn in the South Pacific, it could be predicted that after the ocean has given up its heat, there might follow La Nina conditions. The greater the ENSO, the greater the La Nina.
For now, except for the flooding, the ENSO is very beneficial. I wonder what Katherine H. will say about. The greater her spin, the less credible her scientific credentials.
How far back has NWS/NOAA been releasing Radiosonde balloons? Did they employ a different technique to test temps at altitude earlier?
good job. this is an important clarification.
How is the combined graph’s red reference line meaningful on a “mean temp” graph?
The mean is zero, the point of reference line.
Thanks for link to NOAA’s original published radiosonde data from 1958 to 2010.
There is no net troposphere warming figure, of course. Nothing is hidden.
It gives C temperature deviations from the 20-year average, 1958-1977.
That 20 yr period had 10 years offset for Surface (lowering other 10 years gains)
and 9 years offset for each for 100mb and 850-300mb.
The subsequent 33 years had only 11yrs offset in all 3 lower tropospheres combined:
Surface temp had 0 offset years.
Surface 100mb had 10 offset years,
and 850-350mb had 1 offset year.
That’s a 3 decade trend.
You should also check the rest of the solar system. During thr claimed period of climate chande the winds of Venus increased 33%, Jupiter lost a stripe and gained another spot as well as its north pole put on a light show never seen before. Also saturn errupted with a huge heat driven storm and its poles alao put on a never before seen light show. Along with Mars warming up it is clear it is not man made.
This is one the most important postings here ever. They are frantically trying to adjust the a RSS data to go with the fraud. Now they will have to adjust 8 radiosonde baloon datasets+ roy spencer’s AMSU satellite data LOL LOL. It amazes me how the radiosonde data has been omitted from mention by skeptics throughout this AGW drama
“It amazes me how the radiosonde data has been omitted from mention by skeptics throughout this AGW drama”
Probably a good thing.. It means it remains reasonably intact because they haven’t needed to “adjust” it … for now.
A great illustration of ‘cherry picking’ starting times of a data series. Yes Morgan Wright, would that make 88 years of cooling climate?
82=2016-1934
The most significant part of the radiosonde data is that UAH agrees with it, while after the new Mears v4, RSS does not. Shows RSS malfeasance. Should have cross checked the way UAH does after each change. Or did then decided not publish hoping no one else would check (John Christy did). Either way, malfeasance.
Ha ha ha ha ha ha ha ha ha ha ha ha ha ha ha!
First chuckle of the day
Belly laugh actually (-:
Basically according to available knowledge the 58 years is a bit more than half the Gleissberg cycle, hence, to find no warming or cooling actually makes perfect sense….
I’m SURE the radiosonde’s data I released in 1979-80 needs to be adjusted….I obviously couldn’t set the instrument back then…sarc….
Being up in the Canadian Arctic during the coldest year on record , 1979, I am sure you know what cold is.
Again, confirms what I have been saying for years, that the post 1979 warming was just a return to pre-1940 normals. There was a modern “Little Ice Age” of abnormal cold in the 1960’s and 1970’s, that alarmist hypocrites want to expunge from the record.
Thanks for the headsup, I had not noticed the old truncated timeline routine.
Radiosonde data has been mentioned by skeptics, myself included. It is usually passed off by alarmists as inadequate coverage to be of any use
My response has been “but you have no problem making assumptions given inadequate coverage in south America, and at the 2 poles”
Which typically elicits the “you’re not a climate scientist” deflection.
Whether the radiosonde coverage is adequate is a matter of opinion as the coverage is global in both hemispheres. Euar Mearns posted a map for one ofmthe sonde data sets at Energy Matters.
But what is certain is that it is more than adequate to cross check the satellite coverage in those 80+ places. And then feel comfortable that the near complete satellite coverage gives a reliable picture since 1979.
As usual RIstvan contributes important knowledge and opinion.
Two different methodologies finding very similar data tends to confirm both. Direct and indirect measurement of temperature matching is powerful.
AGW says the added “heat” comes from gases, not the surface. @ meters (or less) above the surface is severely polluted by true surface absorption and release. Surface effects have no bearing on GHG hypothesis and the “theories” derived from it.
The current satellite data gives a very reasonable comparison with the ONLY evenly spaced, untampered, minimal locally affected surface data in the world.
http://s19.postimg.org/8lgilst2r/USA_January.png
ps… I’m waiting to see what RRS V4 TLS does for “Cont USA”.
Will it remain unchanged, while the rest of the world gets a +ve trend increase?
or will it diverge from the USCRN surface data? 😉
ANOTHER TRUNCATION:
The first alarms of ocean acidification were raised in a 2004 paper and repeated in 2010 Congressional testimony. It covered a period starting in 1988.
In 2013 NOAA reissued its World Ocean Database. This shows that ocean pH levels coincide with the Pacific Decadal oscillation. And that it is about the same as it was 100 years ago.
Those who released the misleading short term chart are taxpayer and foundation funded. One even received a $100,000 prize after his testimony.
Reblogged this on 4timesayear's Blog and commented:
Yup…like they do for most of the graphs having to do with climate change.
Tony, next time you’re out for a bike ride I’d check under the seat if I were you. The Green Blob is already gunning for you at every turn, but releasing this sort of killer-stat’ could be very bad for your long-term health prospects. A superb revelation. They’ll hate you for it.
The Green Mob, call it what it really is, will use ridicule and character assassination to discredit the opposition. If Mrs. Clinton gets elected, I’m sure he will be on her Enemies List if he’s not there already.
Having said that I do recall the Clinton Body Count hoopla which got over 6,000,000 hits on the Google search I just did.
Besides all that, just look at the title of the link Tony put up:
Global Temperature Variation, Surface-100mb: An Update in 1977.
http://journals.ametsoc.org/doi/pdf/10.1175/1520-0493(1978)106%3C0755%3AGTVSMA%3E2.0.CO%3B2
It says Surface to 100 mb
The graphic from
NOAA/NASA Annual Global Analysis for 2015
http://www.ncdc.noaa.gov/sotc/briefings/201601.pdf
Doesn’t include the surface. Surely if Angell & Korshover found the surface temperature values in the radiosonde data, NOAA/NASA could too and probably did. They just didn’t include it. They list the warmest ranking for 5,000, 10,000, 18,000, 30,000 and 40,000 feet but not the Surface. One has to wonder why that is.
Tony writes in conclusion:
Global warming theory is based on troposphere warming, which is why the radiosonde data should be used by modelers – instead of the UHI contaminated surface data.
Really, the modelers don’t use radiosonde data?
A couple of the above graphs got a showing here at Suspicious Observers:
[youtube https://www.youtube.com/watch?v=tlfuFV04GTc&w=640&h=360%5D
What is the big deal about a few tenths of a degree C variation over decades when the diurnal and seasonal variations at any given station are as high as 50 C? Those averages sometimes g up a few tenths, sometimes go down, sometimes stay constant. After El Ninos they go up, after large volcanic eruptions they go down. What does it all prove? Nothing. Certainly nothing about CO2 in the atmosphere or the effect of human activity.
Actually, according to my measurements on minima, which are supposed to go up [probably in a chaotic fashion] due to more CO2, I found they are going down…
https://i0.wp.com/oi62.tinypic.com/33kd6k2.jpg
What is the margin of measurement error in these numbers? If it’s a few tenths of a degree then there is no measureable change in temperature for the period.
I’m no climate buff, but it seems obvious why the radiosonde data is limited to 37 years. In the presentation, http://www.ncdc.noaa.gov/sotc/briefings/201601.pdf, radiosonde data is compared to satellite data on page 10. I’m pretty sure the satellite data doesn’t go back to 1950. So much for that conspiracy.
https://www.skepticalscience.com/satellite-measurements-warming-troposphere.htm
Reblogged this on Climate Collections.
Pingback: „Global Warming“ Reality Check April 2016: Die globalen Temperaturen gehen weiter zurück – wobleibtdieglobaleerwaermung