
Disrupting the Borg is expensive and time consuming!

Google Search
-
Recent Posts
- One Atomic Bomb Per Hour
- New Video : Analyzing Oil And Gas
- Is Antarctica Melting?
- High Speed Analysis And Visualization
- El Nino To The Rescue?
- Fake News Update
- Growth Of Antarctic Sea Ice
- 65 Years Of Progress!
- El Nino To The Rescue?
- Worst March Drought On Record
- ChartGL Process Control Demo
- The Biggest Money Laundering Scam
- Drought In The Headwaters Of Lake Powell
- Unrealistic Expectations Of Water Availability
- Did Bill Gates Do This?
- Worst March Drought On Record In The US
- The Real Hockey Stick Graph
- Analyzing The Western Water Crisis
- Gaslighting 1924
- “Why Do You Resist?”
- Climate Attribution Model
- Fact Checking NASA
- Fact Checking Grok
- Fact Checking The New York Times
- New Visitech Features
Recent Comments
- Bob G on One Atomic Bomb Per Hour
- Bob G on One Atomic Bomb Per Hour
- Jack the Insider on One Atomic Bomb Per Hour
- arn on One Atomic Bomb Per Hour
- Bob G on One Atomic Bomb Per Hour
- Bob G on One Atomic Bomb Per Hour
- Bob G on One Atomic Bomb Per Hour
- Hank Phillips on One Atomic Bomb Per Hour
- Hank Phillips on One Atomic Bomb Per Hour
- Bob G on One Atomic Bomb Per Hour
Reblogged this on Gds44's Blog.
Yes – it looks like that “cruddy, rotten” ice that posed as “ice” around the Arctic circle a couple of years ago.
Ice + 385 ppm CO2 in the air produces “crud” ice. It goes away real fast and polar bears can’t walk on it for shit.
And the increased CO2 leads to polar bear amnesia rendering them helpless to swim.
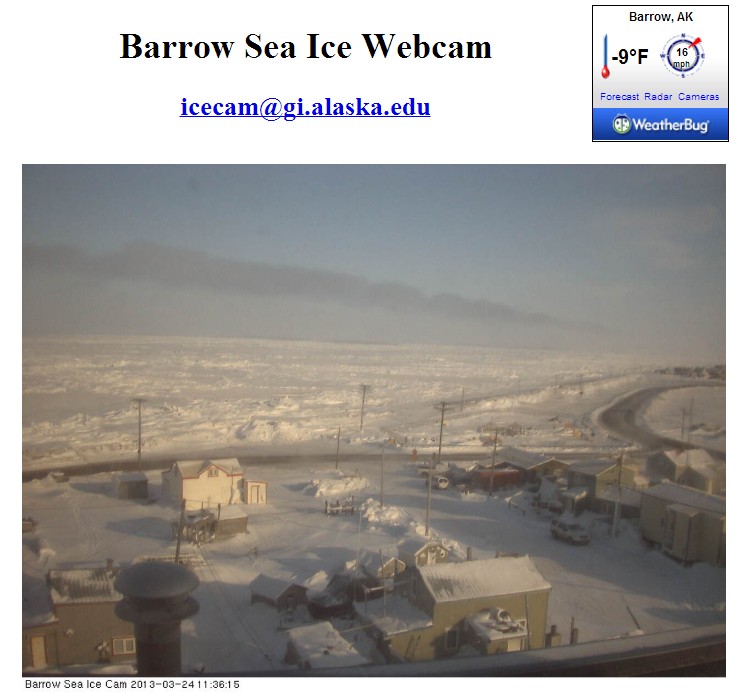
High temperature for the day.
March 24, 2013 weather report for
BARROW, ALASKA, USA
Weather report as of 54 minutes ago (21:53 UTC):
The wind was blowing at a speed of 7.2 meters per second (16.1 miles per hour) from Northeast in Barrow, Alaska. The temperature was -22 degrees Celsius (-8 degrees Fahrenheit).
Actually, the ice around Barrow is exceptionally thin. A huge wind-driven polynya opened up there in the first half of March, and has only just skimmed over. A week ago there was substantial open water visible from the webcam.
http://feeder.gina.alaska.edu/webcam-uaf-barrow-seaice-images/2013_03_17_15_42
That proves it. The ice is melting at -22C. The planet is doomed. The current image shows no open water.
It’s pretty evident that they have been driving on it with snowmobiles or other. I guess they have more faith in the integrity of it than Mr Ellis has.
Peter,
Impressive picture and no doubt that huge expanse of open water was still measured as containing sea ice. According to the US Navy, the Arctic this past Winter had an exceptional amount of open water . Most likely it was caused by the unusually thin and fragile ice.
ROFLMAO. It is covered with ice today. Look at the picture above. How long do you think water will stay unfrozen at -22C?
You have got to be joking. You alarmists seem to be lacking some fundamental intelligence gene.
Snorting Kool-Aid powder. Leaves people more stupefied than smoking hashish.
Steve,
The Arctic is a much bigger place than the view you get from that webcam. In another spot, a few miles away, you may be able to see ocean until the horizon. Are you now taking issue with what the US Navy has said?
What are you babbling about? Wind opens up cracks in the ice all the time. It has nothing to do with CO2 or global warming.
The Navy shows that the ice there is half a metre thick
I read no such thing, only about Arctic sea ice returning to pre-2007 levels, and Russian ice breakers having trouble in ice north of Arkhangelsk.
This wasn’t some Greenpeace blog you got this info from was it – promoting Bio-fuel Navy?
Global warm-monger in denial.
Steve,
This is what I am babbling about: The following words lie directly directly below the Naval image you just posted: http://robertscribbler.wordpress.com/2013/03/20/open-water-visible-from-barrow-alaska-in-march/
“The above image shows a large region of thin ice opening up north of Barrow. But, as we can see from the Barrow sea ice cam, at least some of that region isn’t ice at all. It’s open water. If the satellite is mis-reading water as ice, then sea ice area, extent and volume measurements are somewhat lower and the melt season is taking hold to a degree not previously anticipated. This Barrow data is just one instance of a large open water area being visible on the ground where satellites are showing ice.:
And a little further down on the same page are these words:
“New satellite image, this one also identified by Jim Hunt, shows visible shot of open water near Barrow. In the image, you can see a large pocket of open water and adjacent areas of, very broken, sea ice. As seen in the Navy shot, it appears this melt is not yet showing up in the area or thickness models. Nonetheless, as the camera shot from Barrow shows, a portion of this area is clearly open water.”
Followed by this image: http://robertscribbler.files.wordpress.com/2013/03/jimhuntbeaufort-130319-1335.png?w=600&h=545
And here some other graphics which show extensive fracturing throughout the Arctic:
“http://neven1.typepad.com/.a/6a0133f03a1e37970b017ee951744f970d-800wi
And this: http://neven1.typepad.com/.a/6a0133f03a1e37970b017ee95104a5970d-800wi
And this: http://neven1.typepad.com/.a/6a0133f03a1e37970b017c35e99828970b-800wi
Clearly there is more to the story than what you post.
The wind blew open a crack in the ice. At -22C it quickly refroze. A normal Arctic winter day.
Steve,
Another quote from the same source as your Navy graph: “open water at Barrow adds to a long list of indicators showing that ice melt has begun in the Arctic and that this particular season may well be proceeding with a vengeance.
Ice melt at -22C?????? ROFLMAO
@TOO: “ice melt has begun in the Arctic …”
The ice on my pool cover has barely begun to melt, and I live at about 44 degrees North latitude!
The wind blew open a crack in the ice.
That, or a wave under the ice. That must happen all the time.
I see that another TOO dumb warmist is here with his worries about some open water as if that proves it is DOOM time around the corner!
There have been periods of time earlier in the interglacial with less ice cover than now and even some times with NO ice cover at all in the summer.
Please stop your childish bullcrap.
Guys,
I just posted you a half-dozen satellite photos showing extensive fracturing and open ocean over much of the Arctic. I have previously posted a graph showing that 2013 ice has never been thinner at this time and the Navy has said they have never seen so much open ocean for this time of year. And as your counterpoint, you offer up someone’s pool and a Navy graph of Steve’s with these words below it: “As seen in the Navy shot, it appears this melt is not yet showing up in the area or thickness models.” And; “open water at Barrow adds to a long list of indicators showing that ice melt has begun in the Arctic and that this particular season may well be proceeding with a vengeance.”
Clearly there is much more to the story than a single temperature reading of -22C or a single Barrow Island photo which looked drastically different only a few days earlier.
LOO, what is the origin of the reports that ice returned to pre-2007 levels?
Did NSIDC make all this shit up? Why would they do that?
Brian,
Are you talking about ice extent or ice volume? Volume is really the only measurement worth considering. For example, 2012, as Steve will tell you in his 100+ posts, returned to 2007 levels, but because the ice was so thin we ended up with a record melt. All indications are that this year the ice is even thinner than last and the melting is already under way. So, if I were you I would buckle up.
Paul Beckwith at Neven has posted:
“For the record; I do not think that any sea ice will survive this summer. An event unprecedented in human history is today, this very moment, transpiring in the Arctic Ocean. The cracks in the sea ice that I reported on my Sierra Club Canada blog and elsewhere over the last several days have spread and at this moment the entire sea ice sheet (or about 99% of it) covering the Arctic Ocean is on the move. Clockwise. The ice is thin, and slushy, and breaking apart. This is abrupt climate change in real-time. Humans have benefited greatly from a stable climate for the last 11,000 years or roughly 400 generations. Not any more….”
Unprecendented in Human History!!! Human History started in 1979 AD of course.
Of course there was no water at the north pole for nuclear subs to surface in the 1940’s and 1950’s and 60’s. Those photos must have been faked by the US Navy.
If this is truly “unprecedented”, then Antarctica’s record sea ice extent for summer must also be unprecedented, as was its record winter extent.
Ice volume has no impact on the Earth’s radiative transfer balance. You have it exactly backwards.
Steve,
This is an astounding statement by you: “Ice volume has no impact on the Earth’s radiative transfer balance. You have it exactly backwards.”
Ice volume determines how soon the ice sheet retracts and by how much during the sunny months. It has a tremendous impact on how much extra energy enters the Earth’s climate system.
The only things that affect radiative transfer are albedo, area and location. There are lots of things which affect freezing and melt, but as usual you are conflating the issues.
AndyOz,
Read up on the Skate — the first ship to merge from below the North Pole. A seaman on board kept a diary and he states that it took them numerous attempts before the opportunity presented itself and that they could only stay 22 minutes because the pollyanna was closing. Then read up on the the history of ice thickness in the Arctic by naval sonar soundings. The US Navy provides much of the data used to calculate the 80% drop in ice volume since 1979.
You are headed down a rat hole.
Yes Steve,
I, the NSIDC, PIOMAS, the US Navy and every other organization that studies the Arctic have got it wrong — thickness and volume don’t matter.
Only you know best. Sorry to have doubted you.
Radiative transfer calculations of the Earth’s surface do not have a factor for thickness or volume. NSIDC and PIOMAS don’t do climate modeling. You are talking out your ass.
Steve,
“NSIDC and PIOMAS don’t do climate modeling.”
Who said they did? They were mentioned because they study Arctic ice thickness, volume and extent. Their work is used by others to model climate.
T.O.O. The sea ice extent for September last year was pretty low, 3.4 10^6 sq km vs a norm of 6 to 7. This spring the sea ice extent is at or near normal 15.1. Unless the winter has been exceptionally cold, that would indicate to me that the ice is thinner and the sea ice extent this year could be below last year.
But in reality who cares, if the north is warming, great. It will be good for the people there. Just because it’s warmer doesn’t mean it our fault. (Why is the Antarctic colder?, Is that our fault?) It doesn’t mean it’s the end of the world. We don’t need snake oil salesmen posing as scientists telling we have to pay trillions to them to stop this. The amount of CO2 man produces every year is miniscule compared to the effect the sun has on the planet. But then if they all agreed that it was the sun the chicken little gravy train would come to an end.
RobertScribbler … Scribbling for economic, social and environmental justice
Nuff said …. pfffftttt..
So fricken’ what? ALL of the ice could disappear tomorrow and it doesn’t mean squat. Is it going to raise sea levels perhaps? Does your melting ice cubes overflow your drink? … dipshit…
Here’s something for you to consider: 90% of all the world’s ice is contained on the continent of Antarctica. Antarctic ice has been growing by about 1% annually for the last 10 years. Furthermore, Antarctic sea ice made an all-time record in 2012 for the greatest and earliest overall sea coverage. With Antarctic ice growing by 1%, Arctic and Greenland ice would have to decline by 10% per year just to keep the Earth’s overall total ice from increasing. And since we know that Greenland and Arctic ice isn’t shrinking by 10% per annum (not even close), then despite claims of Climate Change and Global Warming, world ice is growing and has been for about ten years with no end in sight. What say ye, warmists?
Squid2112, Bdaye, FrancisChalk,
As you can see from the photos of fractured ice, the very thin ice is braking apart and allowing radiation to be absorbed very early in the melt season. Why ice volume is important is that it means that it will melt sooner and more completely. That means more solar radiation will be absorbed into the open ocean and, thus, into the Earth’s climate system — a huge amount of extra watt energy.
You are wrong about the extent returning to normal — the NSIDC has just announced that the March 15, 2013 maximum ice extent was the 6th lowest since satellite imagery (1979) plus ice volume is only 20% of what it was in 1979.
And you are also wrong about the Antarctic continent’s fringe sea ice which is growing at only 1% per decade (not 1% annually) as opposed to the Arctic ocean which is losing 3 times that per decade (and accelerating). Antarctic land ice is decreasing (volume) and Antarctic sea ice disappears almost completely each southern summer (excluding Waddell Bay) which is a very different scenario to Arctic ice. The complete disappearance of Antarctic sea ice would not be an unusual event to Earth’s energy balance, but the same is not true if the event happened in the northern hemisphere.
Finally, there are many who believe that the permanent Arctic sea ice blocks many of Greenland’s glaciers from slipping into the ocean. If Arctic ice did disappear, there is an increased chance that the sea levels could rise further.
In short, ice volume is a critical measure of ice health as you will undoubtedly witness in the next 6 months.
You have no idea what you are talking about. Most of the wind blown crack opened up in 4-5 metre thick multi-year ice.
Steve,
Thin ice breaks more easily than thick ice. The very thin (low volume) ice is the most likely reason for all those extraordinary photos and for the Navy stating that they have never seen so much open Arctic ocean at this time of year.
But, as I have said time and again, the coming summer will reveal who knows what they are talking about and who has been talking out of their “ice”.
The crack opened up in the thickest ice in the Arctic, along the north coast of Canada.
Steve,
Why don’t we put this conversation on hold until late July or so?
For T.O.O. Ok, I’m glad you referenced the NSIDC data. So go to the NSIDC website and look at two charts, both dated 25 Mar 2013: The “Antarctic Sea Ice Extent, 15% or greater” Chart shows that Antarctic sea ice has been above the NSIDC 1979-2000 baseline average for over two years with 2012-2013 Antarctic sea ice currently further above the baseline than 2011-2012, which was above the baseline for the entire one year recording period. 2012-2013 has also been above the baseline so far this recording period and it continues to move further above. The “Southern Hemisphere Sea Ice Area” abnormality value is a +.907, i.e. sea ice levels are above the average. By contrast the “Arctic Sea Ice Extent, (area of ocean with at least 15% sea ice)” Chart does show both 2011-2012 and 2012-2013 to be below the 1979-2000 baseline, but with a “Northern Hemisphere Sea Ice Area” abnormality value of -.547. Thus, Arctic sea ice is declining and Antarctic sea ice is increasing. Again, the NSIDC data was released yesterday, 25 Mar 2013.
As far as the continental Antarctic ice goes. NASA presented data from the ICESat measurements at a conference in Portland on 14 Aug 2012. The report was presented by NASA’s Jay Zwally, a huge supported of the theory of manmade global warming. Here is a quote from the abstract of the report: “During 2003 to 2008, the mass gain of the Antarctic ice sheet from snow accumulation exceeded the mass loss from ice discharge by 49 Gt/yr (2.5% of input), as derived from ICESat laser measurements of elevation change.” The title of the report was, “Mass Balance of the Antarctic Ice Sheet 1992-2008 from ERS and ICESat: Gains exceed losses.” And as I pointed out, 90% of the entire world’s ice is contained on the continent of Antarctica, which is all but permanently covered in ice while being almost one and a half times the size of the United States. But, no polar bears, so no one knows anything about it. So, if ice is growing down south, it’s highly likely it’s growing worldwide, which is completely at odds with all Climate Change (Global Warming) models and contrary to everything the so-called Climate Change “experts” have been telling us.
Francis,
“The trend for ice extent growth during Antarctic winters is about 16,000 square kilometers per year (6,200 square miles) or roughly an area the size of Connecticut. In comparison, the decline in Arctic summer sea ice extent is an area about the size of Indiana (91,600 square kilometers per year, or about 35,400 square miles).
The Antarctic September extent trend for 1979 to 2012 is just above the statistical significance level (0.9% per decade, plus or minus 0.6%). The new Antarctic sea ice September value is slightly greater than typical year-to-year variations, and is roughly equal to a 25 mile (40 kilometer) northward shift in the location of the ice edge relative to the 1979 to 2000 average.”
http://nsidc.org/arcticseaicenews/2012/09/arctic-sea-ice-extent-settles-at-record-seasonal-minimum/
“Through 2012, the linear rate of decline for September Arctic ice extent over the satellite record is now 13.0% per decade, relative to the 1979 to 2000 average. The six lowest September ice extents over the satellite record have all occurred in the last six years.”
http://nsidc.org/arcticseaicenews/2012/10/poles-apart-a-record-breaking-summer-and-winter/
This following link is to is excellent graph which indicates trends for both poles over 34 years (1979 to 2012)
http://nsidc.org/cryosphere/sotc/images/arc_antarc_1979_2012.png
This link has 3 more excellent graphs plus a summary of the trends in both poles since 1979: poleshttp://www.yaleclimatemediaforum.org/2012/10/slightly-increased-2012-antarctic-sea-ice-levels-no-match-for-arctic-declines/
Regarding your assertion of ice volume gains in Antarctica over a 5-year period, I assume it came from this paper:
Satellite observations of Antarctic sea ice thickness and volume
N. T. Kurtz1,2,*, T. Markus2
“.The uncertainties in the calculated thickness and volume trends are large compared to the observed basin-scale trends. This masks the determination of a long-term trend or cyclical variability in the sea ice cover. It is found that lengthening of the observation time series along with better determination of the interannual variability of sea ice and snow densities will allow for a more statistically significant determination of long-term sea ice thickness and volume trends in the Southern Ocean.”
Sorry Francis,
My comments (direct quotes from science organizations) are no longer welcomed. My last response was thorough and accurate, but apparently not in line with views of this blog owner.
RE: Peter Ellis – “A huge wind-driven polynya opened up there in the first half of March, and has only just skimmed over”
Hmm…no data for this year prior to 3/17/2013. How convenient for you that your assertion can’t be validated.
http://feeder.gina.alaska.edu/webcam-uaf-barrow-seaice-images?date=2013-02
Starting at page 208, browse to page 209, 210…
http://feeder.gina.alaska.edu/webcam-uaf-barrow-seaice-images?page=208
All that snow reminded of the year I spent in Galena, AK – on the Yukon River.
“…As the focus of a vigorous betting tradition, the exact time and date of breakup [of the Yukon River] has been recorded annually since 1896. These breakup times note the moment when the ice moves the tripod on the Yukon River at Dawson…”
http://www.yukonriverbreakup.com/statistics.html
Statistics to 2011. To that, you can add May 7 2012, 4.21 PM and May 1 2013, 9.44 AM.
Someone should check the trend…
Someone mention Slushy??!
I have strawberry flavouring and it’s still warm enough down under for flavoured ice.
😀
Of course, “ice free” doesn’t actually mean “ice free” and “warming” doesn’t actually mean “warming”. It can mean any combination of weather lasting anywhere from one hour to 1 month. I suppose if the Arctic becomes “ice free” and we all fail to expire in a plume of “blue steam”, maybe they will STFU for a least a while.
gofer,
Or, perhaps, someone would stop posting about it.
To all you jack-wagons making wild claims based upon one webcam image: look at the satellite imagery for the big picture. It shows *huge* amounts of open water west of Barrow (PABR, so you don’t have to look it up): http://go.wisc.edu/n2zm89 Just so you know, the sea ice moves — a lot — and there have been *huge* open leads in the sea ice west of Barrow this winter. Here’s a high-resolution satellite animation that shows you what I mean: http://go.wisc.edu/cl48m9 I know: it probably hurts to see real data — but sometimes you just have to look at it in order to make educated statements on the Internets…
Nobody is making any wild claims. Stop hyperventilating. It is -22C in Barrow. Wind blows the ice around, as it has always done.
What wavelength from the sensor.
We have 14 good ones covering the past 11 days that show you are full of shit!
Scott,
Welcome.
Steve,
Hyperventilating?
Yes, hyperventilating … my god man … so fricken what? This is NOTHING new or unprecedented. Sheeeesh .. get a clue.
Yikes, you cats are losing it.
Sea ice in the arctic is way more than the 1845-51 and 1921-26 periods.
What the hell gives, did history begin in 1979?
Chewer,
No but accurate graphs did. And sea ice is an extremely poor measure of total ice as this winter is so clearly illustrating.
How so?
http://neven1.typepad.com/.a/6a0133f03a1e37970b017d42222a63970c-pi
We drilled 408 holes in the past 11 weeks and if you think there’s open water to the bottom (not pooled sections), you are delusional.
Chewer,
The bigger picture:
http://neven1.typepad.com/.a/6a0133f03a1e37970b017ee951744f970d-800wi
http://neven1.typepad.com/.a/6a0133f03a1e37970b017ee95104a5970d-800wi
http://neven1.typepad.com/.a/6a0133f03a1e37970b017c35e99828970b-800wi
TOO:
Wrong on all counts! We still do not have “Accurate” ice measurements for the polar regions. They may be relatively more accurate that what was available before, however the latest satellite imagery and algorithms are even more accurate than those used in 1979. The Land Masking has changed over the years, becoming “More Accurate”.
We are discussing long term weather patterns that some even think may possibly reflect some weird climate situation, when it shows normal weather patterns that have been experienced in that region for millions of years. In the past few thousand years there has been less ice and more ice than recent years. That means recent years, since 1979, is in no way outside natural boundaries and is little more than discussing weather events in that region.
If you think that >30% equaling 100% is in any way “Accurate”, you should study some more.
Scott Bachmeier, do you acknowledge that Arctic sea ice has doubled since the Holocene Climatic Optimum @7,000 years ago? Is it your position that the ocean-atmosphere system dangerously destabilized at that point and has been out of control since? Thank you in advance.
TOO, what is your definition of Ice Free Arctic? Was that reached in the past 100 years? If so, when and was it a world wide catastrophe?
This was your reply to my question a few days ago, does it sound like direct answer to a simple question?
Brad,
Apparently this question is important to you. Please define what you mean by “ice free”. If you are thinking that ice free means the size of Russia, then the answer is yes, But if you think ice free means the size of Rhode Island, then the answer is no. As well, I believe there will be new ice forming in the Arctic from late September to late March every year until way past my years on Earth.
Are we clear?
My answer to you is, no, we are not clear. Please focus and answer the question. What is your definition of Ice Free Arctic? Was that reached in the past 100 years? If so, when and was it a world wide catastrophe?
At -22C which radiates more energy to space, open sea water or ice covered water? Sea ice insulates the water below it from the cold air above. The thinner the sea ice the more cooling takes place. The sea ice off Barrow has been under the influence of the wind reducing it’s thickness to around 0.5 meters. This same wind has driven sea ice towards Russia, increasing ice thickness to over 4 meters. Compared to lake ice, sea ice is very hard to form. With air temps at -22C it can take forever for sea ice to form. The main factor in sea ice formation at sub freezing temperatures is the wind. (White caps throwing minute particles of sea water through the frigid air, causing them to freeze before they hit the water again.
Right. ROFL
I’ll have to remind myself all that ice in Deadliest Catch is just styrofoam or Cotton Candy
The whole methodology for measuring sea ice area, extent would fail a grade 5 test. The wind blows the ice all over the place. If the % in a grid area drops below 15%, ackording to the methodology it has melted. If the wind piles 0.5 meter thick ice into 4 meter piles the total area drops and it reads as ice melts. 5 meter thick ice gets pushed by the wind spreading itself out and you have an expanding ice area. The only thing that these numbers for sea ice tell us is how effective the wind is at blowing, that which floats, around, and how gullible we all are.
Kent:
You nailed the value of current polar ice research! Zilch, Nada! I agree it would fail a 5th grade test!
It is similar to two old farmers, with STML, sitting on a porch talking about weather. 😉
Maybe it is just MCI!
http://www.alz.org/dementia/mild-cognitive-impairment-mci.asp
TADA! … exactly! … and none of it makes a rats ass bit of difference to anything!
Steve, hate to say you’re exaggerating the temps. Current temp in Barrow is -10F. Average highs for this week show multiple days above freezing:
https://www.google.com/#hl=en&sclient=psy-ab&q=current+conditions+barrow+alaska&oq=current+conditions+barrow+alaska&gs_l=hp.3..0i22i30l3.602.6303.0.6690.32.25.0.3.3.1.442.5869.0j13j5j5j2.25.0…0.0…1c.1.7.psy-ab.GIZ1Qvgsflk&pbx=1&bav=on.2,or.r_cp.r_qf.&bvm=bv.44158598,d.dmQ&fp=1d8e6c0537415744&biw=1366&bih=667
On a couple of days, the lows reach around -20 F.
So, cherry picking again. Not really a surprise.
Moron alert! The last day when Barrow was above freezing was October 27, 2012. Average temperature this week was -22C. Highest temperature this week was -19C
http://www.wunderground.com/history/airport/PABR/2013/3/25/WeeklyHistory.html
Where do you loud mouthed know nothings come from? The scary thing is that you probably vote and elect people like Obama.
Robert is one of those Reverend Moon-style “climate progressives” for whom “freedom” is a total waste and who doesn’t think you should have it either.
Think of all the time and money wasted on the “Roberts” of the world!
Check out the link to Robert’s profile if you want a laugh.
I’m a progressive novelist, non-fiction writer and emerging threats expert. I’ve served 8 years in the combat arms, spent 3 years as a police officer, and spent 3 years as Editor, Emerging Threats for Jane’s Information Group. I’ve spoken at over 250 events for schools nationwide and am currently working to both complete my third speculative fiction novel “The Nightmares of Winter” and my second non-fic — an emerging threats/ sustainability book entitled “Growth Shock: Tragedy and Hope at the Limits of a Finite World.”
My robertscribbler blog is dedicated to supporting causes and spreading information and analysis that advance environmental, social and economic justice. Please feel free to contact me if you believe your cause would benefit from my written advocacy or if you need expert trends analysis in one of these key areas.
Note to Robert:
Expert advice is sought on how to combat cult-stupefied “climate progressives” from ruining perfectly good societies for no other reason than cult-inspired paranoia
Hey, I declare this ‘be nice to moron day’. Give robert a break. He was probably remembering something from one of his progressive novels. Or more likely he doesn’t even know the difference between C & F in temperatures. Like I said Steve, you really draw the idiot CAGW zealots here.
Robert and Paul Ehrlich are good friends. And have the same therapist.
Justice! .. Justice! … we want Justice!
economic Justice!
social Justice!
environmental Justice!
We want Justice!
Give me a break… fricken liberal dumbass
The Arctic is always breaking up because it IS thin and currents and wind DO push it around. The ice at surface freezes but the water is not cold enough to keep it frozen. The Arctic thin ice occurs because the water, not the temperature of the air, is the determinant of ice thickness. Polar explorers have known this from day one: there has “never” been a solid, unfractured, stable floating polar ice cap (at least since the 1750s. I’d be looking at the SST coming through the Bering Strait, not the air temperatures: look at when the modern Arctic ice started to really drop, only about 1997, despite the warming from the 1960s. The ice is disappearing bottom up, not top down.
Doug Proctor,
The NSIDC said the fracturing is likely a sign of the prevalence of young and thin sea ice, which can be disturbed more easily by weather patterns and ocean currents, and also melts more easily when exposed to warm air and ocean temperatures during the melt season. As Arctic sea ice extent has plummeted since 1979, down to a record low in September 2012, first-year ice has become much more common across the Arctic, as thick, multiyear ice has declined.
“The large area of fractured ice is located in predominantly first-year ice, which is thinner and easier to fracture than thick, multiyear ice,” the NSIDC said on its website.
NSIDC says all kinds of things. Here is one clumsy attempt I busted them on last year
http://www.real-science.com/nsidc-timeline
Steve,
It is not only the NSIDC that is saying the ice is exceptionally thin and there are plenty of recent photos from all over the Arctic showing extensive fracturing. Is wind the sole reason for the fracturing? I don’t think so.
No doubt, the Arctic itself, will let us know the truth in a few months.
It’s the wind.
Steve,
Good luck.
At any rate the wind patterns and strengths were not responsible for the fracturing and neither were the temperatures above or below the ice surface. That leaves the obvious, which is seismic activity.
Take a look at Gurlap sensors located anywhere/everywhere around the arctic basin and make a decision for yourselves.
BTW, the Danes and Germans have realized that the chemical content, pressures, wind heights (with Jetstream interruptions), and tropopause compression with changing orientations give a nice indication of the incoming photons through the VA belts and magnetosphere, and in particular how our climate may be influenced beyond the one dimensional C02 hypothesis.
The science is settled, you say?
Guess where the money is moving!!
Also, there has never been a detected seismic event within 266 miles of either pole!
Why, you may ask…
Because there are no xyz sensors, might I say!
Chewer,
Does this photon thingo have anything to do with “cloud seeding” that was in the news last year? Wouldn’t seismic activity be picked up from sensors elsewhere? How is it that an Indonesian earthquake is first “heard” by the L.A. monitoring center thousands of miles away and then secondly, its strength is also validated by the same center? It was my understanding that monitoring centers from around the world triangulate an event to pinpoint its epicenter — wrong?
Look the changeling is back!
Cloud seeding indeed!
Find one earthquake on any map at either pole!
Triangulation works for .8Mm when you have sensors within a reasonable orthogonal distance. There are none…
Steve, Is there a way for commenters to embed images in our comments? There are a few things I’d like to show T.O.O. about sea ice before 1979.
OK, all you hyper-ventilating PhDs on here who can’t stand the sight of actual data (in the form of real satellite imagery), shield your eyes if you (in a moment of open-minded weakness) accidentally click with your left(wing) mouse button on this URL: http://earthobservatory.nasa.gov/IOTD/view.php?id=80752&src=share
Ice fractures under mechanical stress, like wind. That has nothing to do with melt. Temperatures in the Beaufort Sea have been far below freezing for months.
I imagine they have been: it’s winter. However, I encourage you to read the last paragraph of the NASA article. It helps to make the Barrow Sea Ice Webcam image at the top of this blog post all the more irrelevant.
You have no idea what you are talking about. Barrow is surrounded by thick ice.
http://seaice.alaska.edu/gi/observatories/barrow_webcam
A polynya opened up a few weeks ago, drifted to the west and is now almost shut.
too funny….if there was no ice…they would be screaming
…now that there’s ice…..it’s dirty cracked ice!
ROTFLMAO
Thin first year ice in an area that melts EVERY year….Captain Obvious strikes again