
I attended kindergarten and first grade in Cleveland Heights, Ohio. In this post I show how NOAA is tampering with Ohio’s thermometer data to turn long-term cooling into warming.
NOAA thermometer data shows that Ohio daily maximum temperatures have dropped considerably since the 19th century, with the five warmest years occurring prior to 1955.
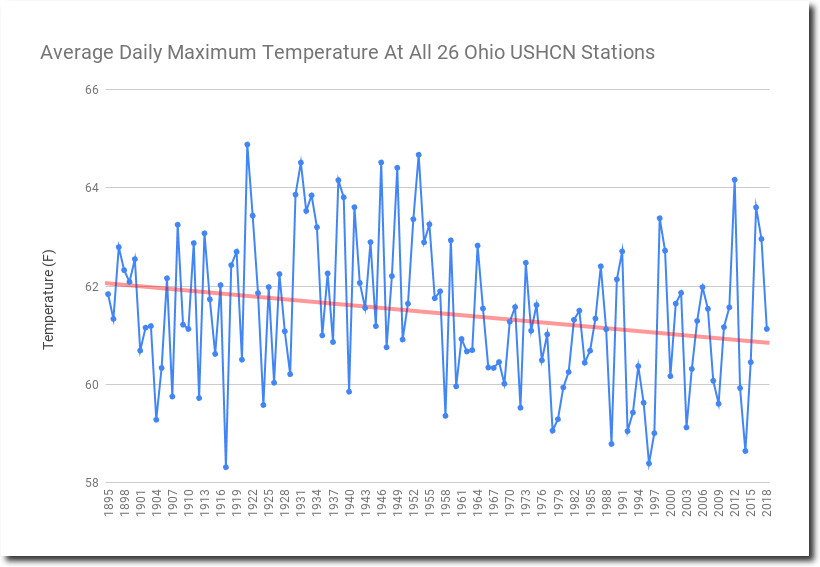
Data : ftp://ftp.ncdc.noaa.gov/pub/data/ghcn/daily/ghcnd_hcn.tar.gz
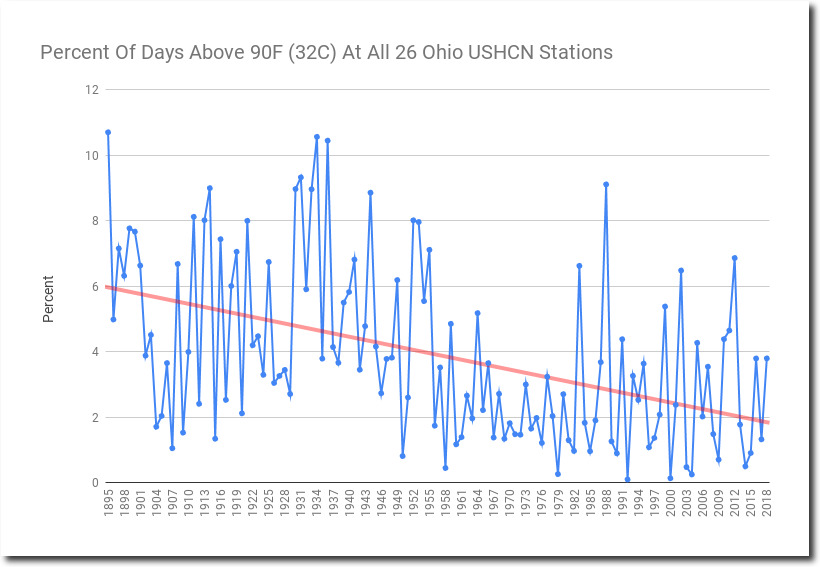
The frequency of hot days in Ohio has also dropped sharply. Ninety degree days were fairly common in Ohio prior to 1955, but they rarely happen any more.
However, this is not what NOAA reports to the public. They alter the data to make it appear Ohio is warming instead of cooling.

Data : ftp://ftp.ncdc.noaa.gov/pub/data/ushcn/v2.5/ushcn.tmax.latest.FLs.52j.tar.gz
The adjustments being done cool temperatures prior to 1988 (below 350 PPM CO2) and warm post-1988 temperatures (above 350 PPM.)
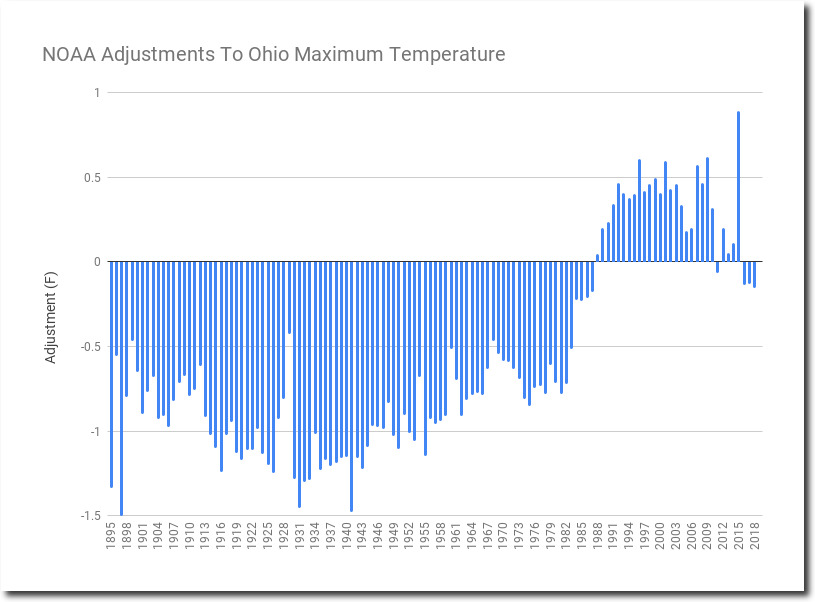
NOAA creates a fake warming trend in Ohio by altering the data to match their CO2 warming theory. This is the ultimate junk science and fraudulent behavior scientists can engage in.

Ohio is not unique in the regard. NOAA engages in the same fraudulent behavior for the entire country. Americans need to learn how they are being cheated and lied to about climate.
