It is now 35.8 °F in the sunny South (mid North Carolina) a normal low is 50 °F with midday temps ~75 °F and sometimes going into the 90s
Ten years ago in May the temps reached 98 °F by May 21st and 25th, less than a month from now. Last year we never saw temperatures above 91 °F except for one day at 95 °F and that is with all the data fudging to change 5 days of 90 °F and above to fifteen days.
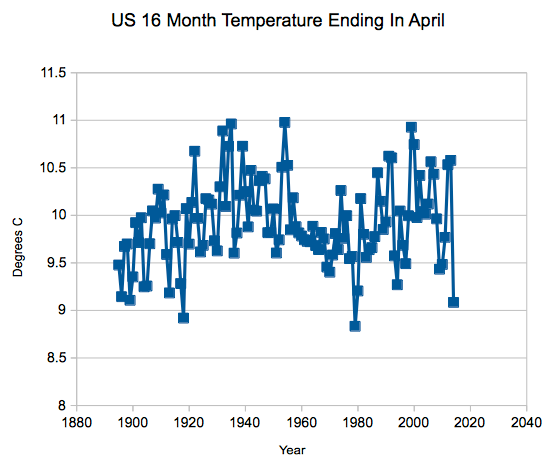
Nice graphic!
It also shows that about 1880 to early 1940’s the temperatures were warming, from mid 1940’s till about the late 1970’s (or early 1980) temperatures are falling, mid 1980’s until late 1990(or early 2000) temperatures are rising, and finally from the early 2000 onwards it’s been level.
Not sure whether that mean anything in climate terms but it certainly shows where the CAGW alarmist cherry-pickers like going.


I was not around in the 20s. But I sure was back in the late 70s, early 80s! Brrrrrr!
BRRRRrrr is correct.
It is now 35.8 °F in the sunny South (mid North Carolina) a normal low is 50 °F with midday temps ~75 °F and sometimes going into the 90s
Ten years ago in May the temps reached 98 °F by May 21st and 25th, less than a month from now. Last year we never saw temperatures above 91 °F except for one day at 95 °F and that is with all the data fudging to change 5 days of 90 °F and above to fifteen days.
Interesting how with the exception of 1979 and 1980 on that chart, that era was not extremely cold, but it was missing warm temperatures.
Nice graphic!
It also shows that about 1880 to early 1940’s the temperatures were warming, from mid 1940’s till about the late 1970’s (or early 1980) temperatures are falling, mid 1980’s until late 1990(or early 2000) temperatures are rising, and finally from the early 2000 onwards it’s been level.
Not sure whether that mean anything in climate terms but it certainly shows where the CAGW alarmist cherry-pickers like going.
It shows the continental temperatures follow the oceans.
The Original Temperatures Project
Why yes!
Well spotted.
Are these temperatures before of after they were “corrected” by NOAA?