
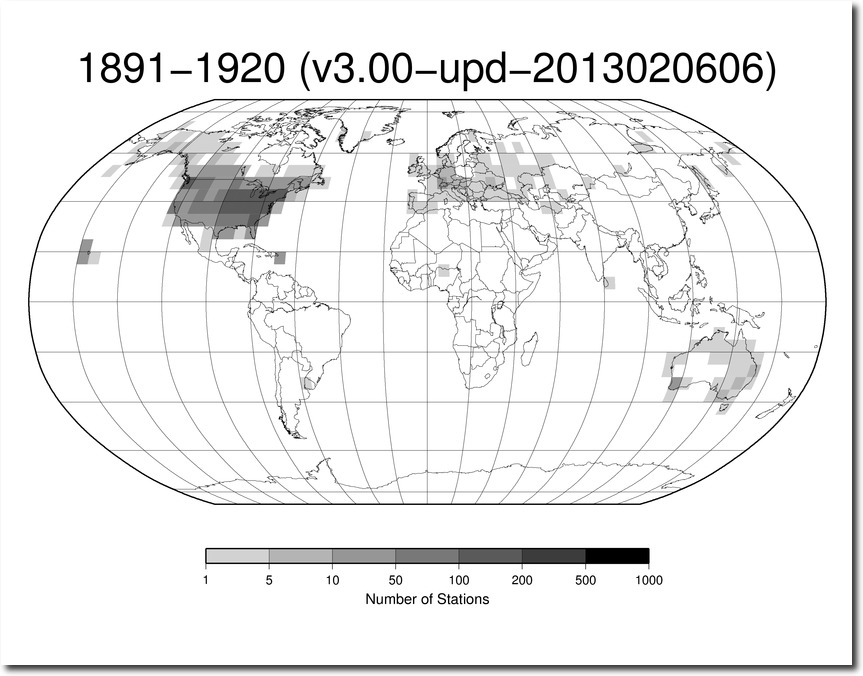
The US temperature record is very important, because it is the only large area on the planet with a high quality long term daily temperature record.
Index of /pub/data/ghcn/daily/figures/
Thirty years ago, NOAA reported that the US was not warming.
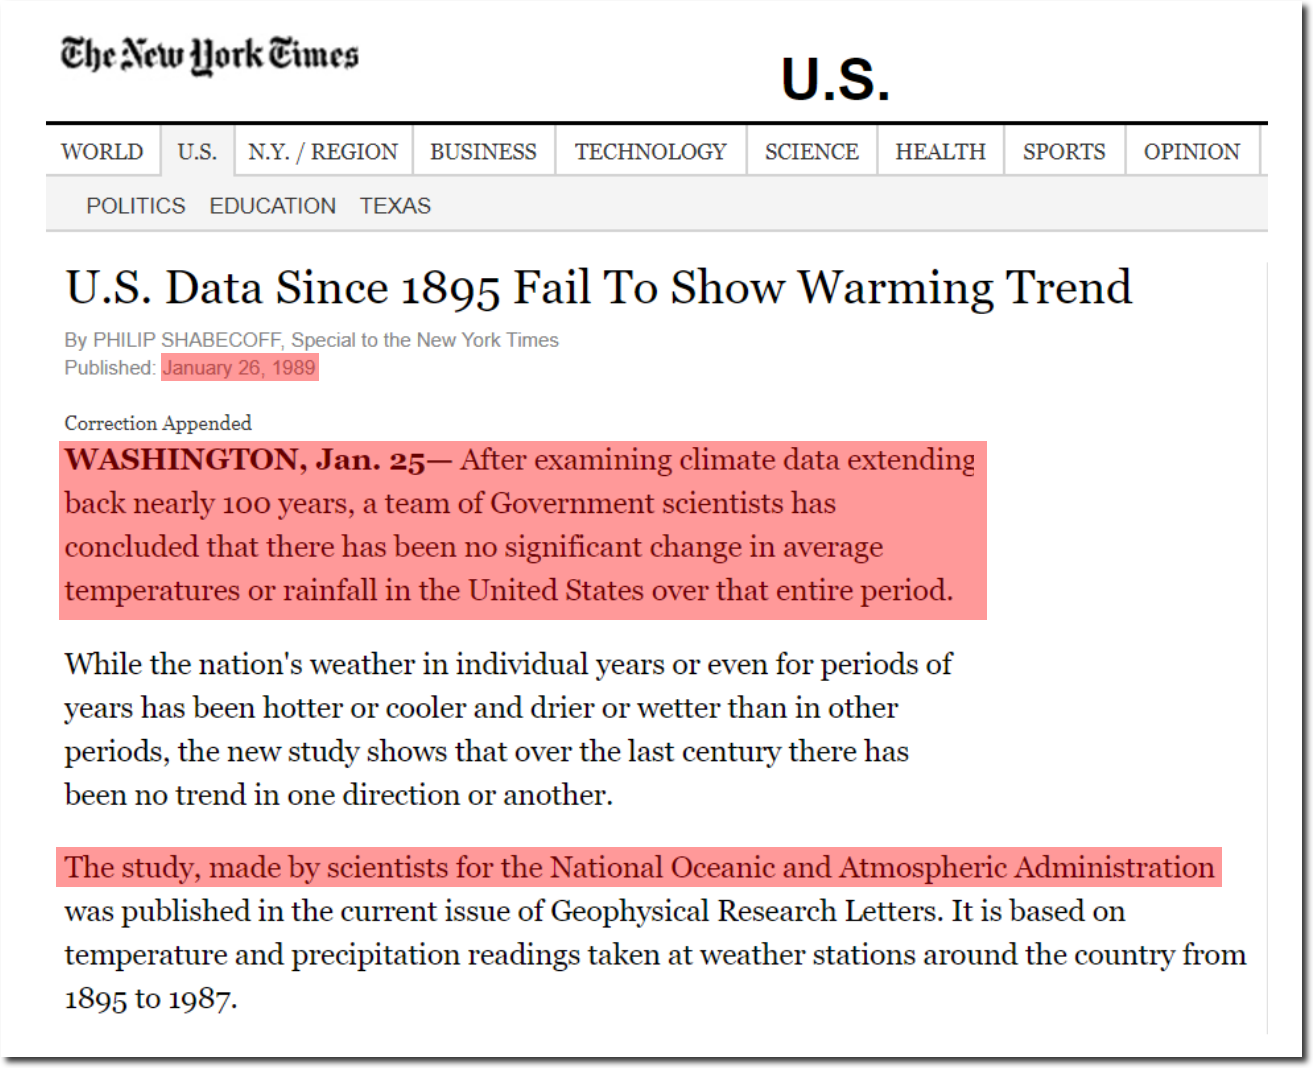
U.S. Data Since 1895 Fail To Show Warming Trend – NYTimes.com
Twenty years ago, NASA’s James Hansen was upset that the US was cooling – even as CO2 increased.
in the U.S. there has been little temperature change in the past 50 years, the time of rapidly increasing greenhouse gases — in fact, there was a slight cooling throughout much of the country
 NASA GISS: Science Briefs: Whither U.S. Climate?
This cooling was disturbing to global warming theorists at both NASA and NOAA. CO2 warming theory was failing, so they did the obvious thing – altered the data and turned cooling into warming.
Via data tampering, NOAA now shows nearly continuous warming in the US since 1895.

Climate at a Glance | National Centers for Environmental Information (NCEI)
The red line below shows the data which NOAA now releases to the public, and the blue line shows their actual thermometer data – which closely resembles the 1999 NASA graph.
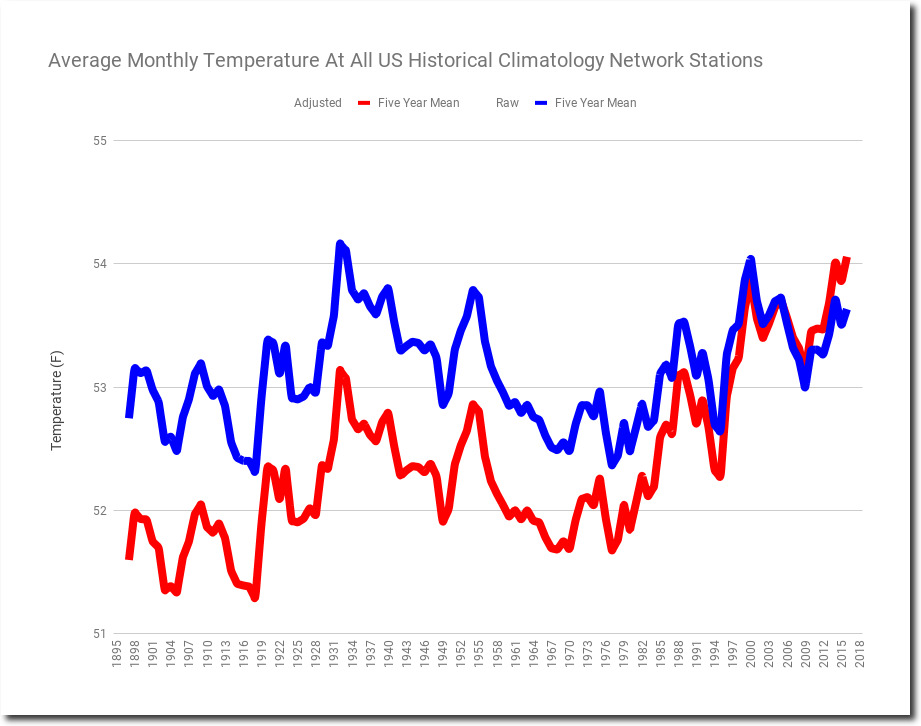
The adjustments form a perfect hockey stick.
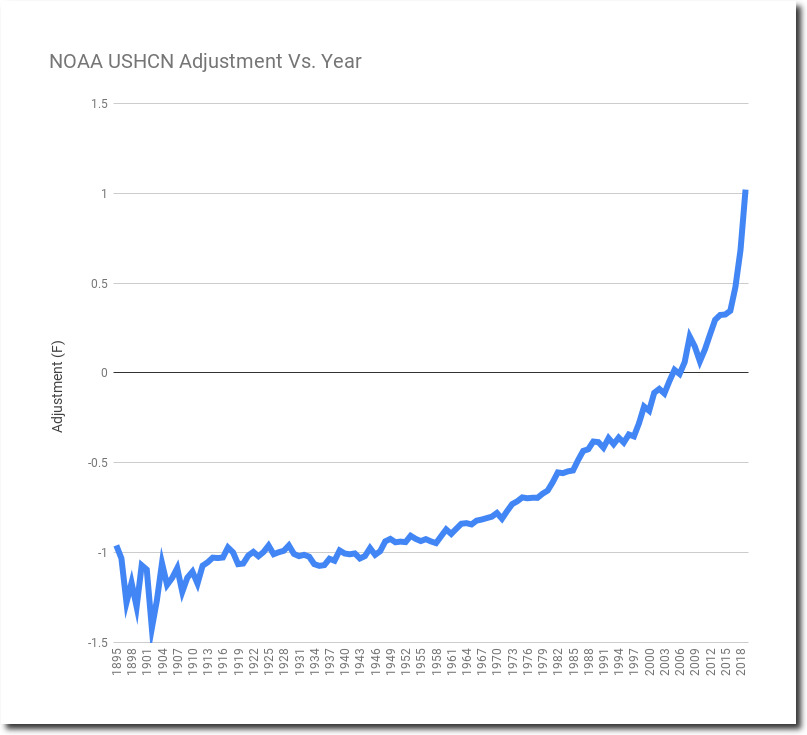
And the adjustments precisely match the increase in CO2. A smoking gun of confirmation bias and/or fraud.
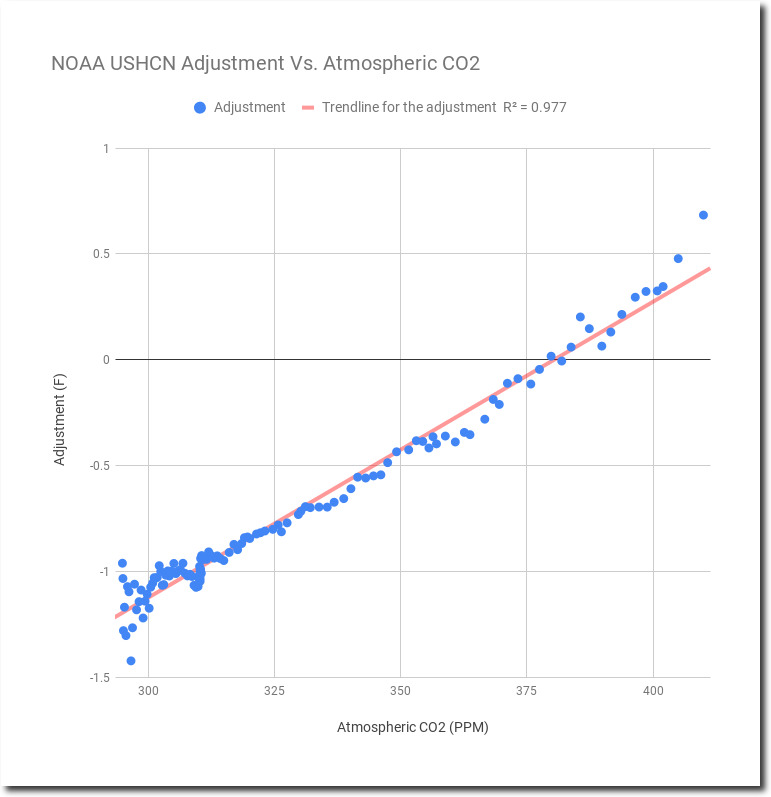
The majority of the recent tampering is due to fake data. More than 40% of the current US adjusted data is generated by computer models rather than thermometers.

NOAA shows a large increase in afternoon temperatures since the 1930s..
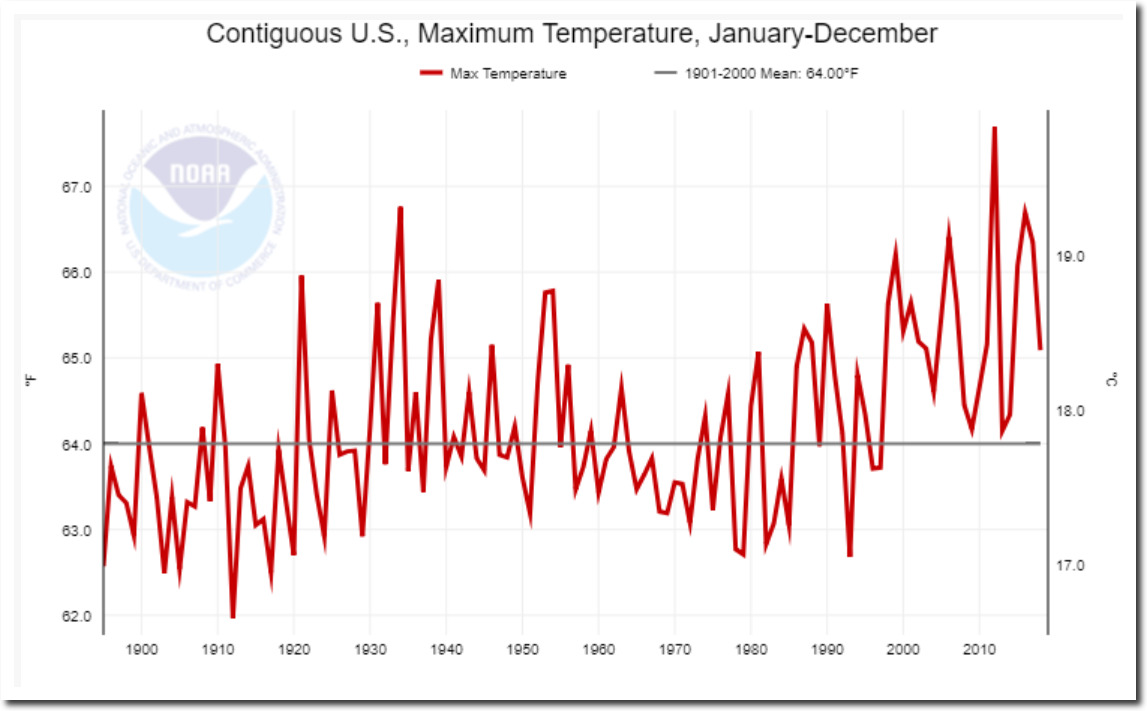
Climate at a Glance | National Centers for Environmental Information (NCEI)
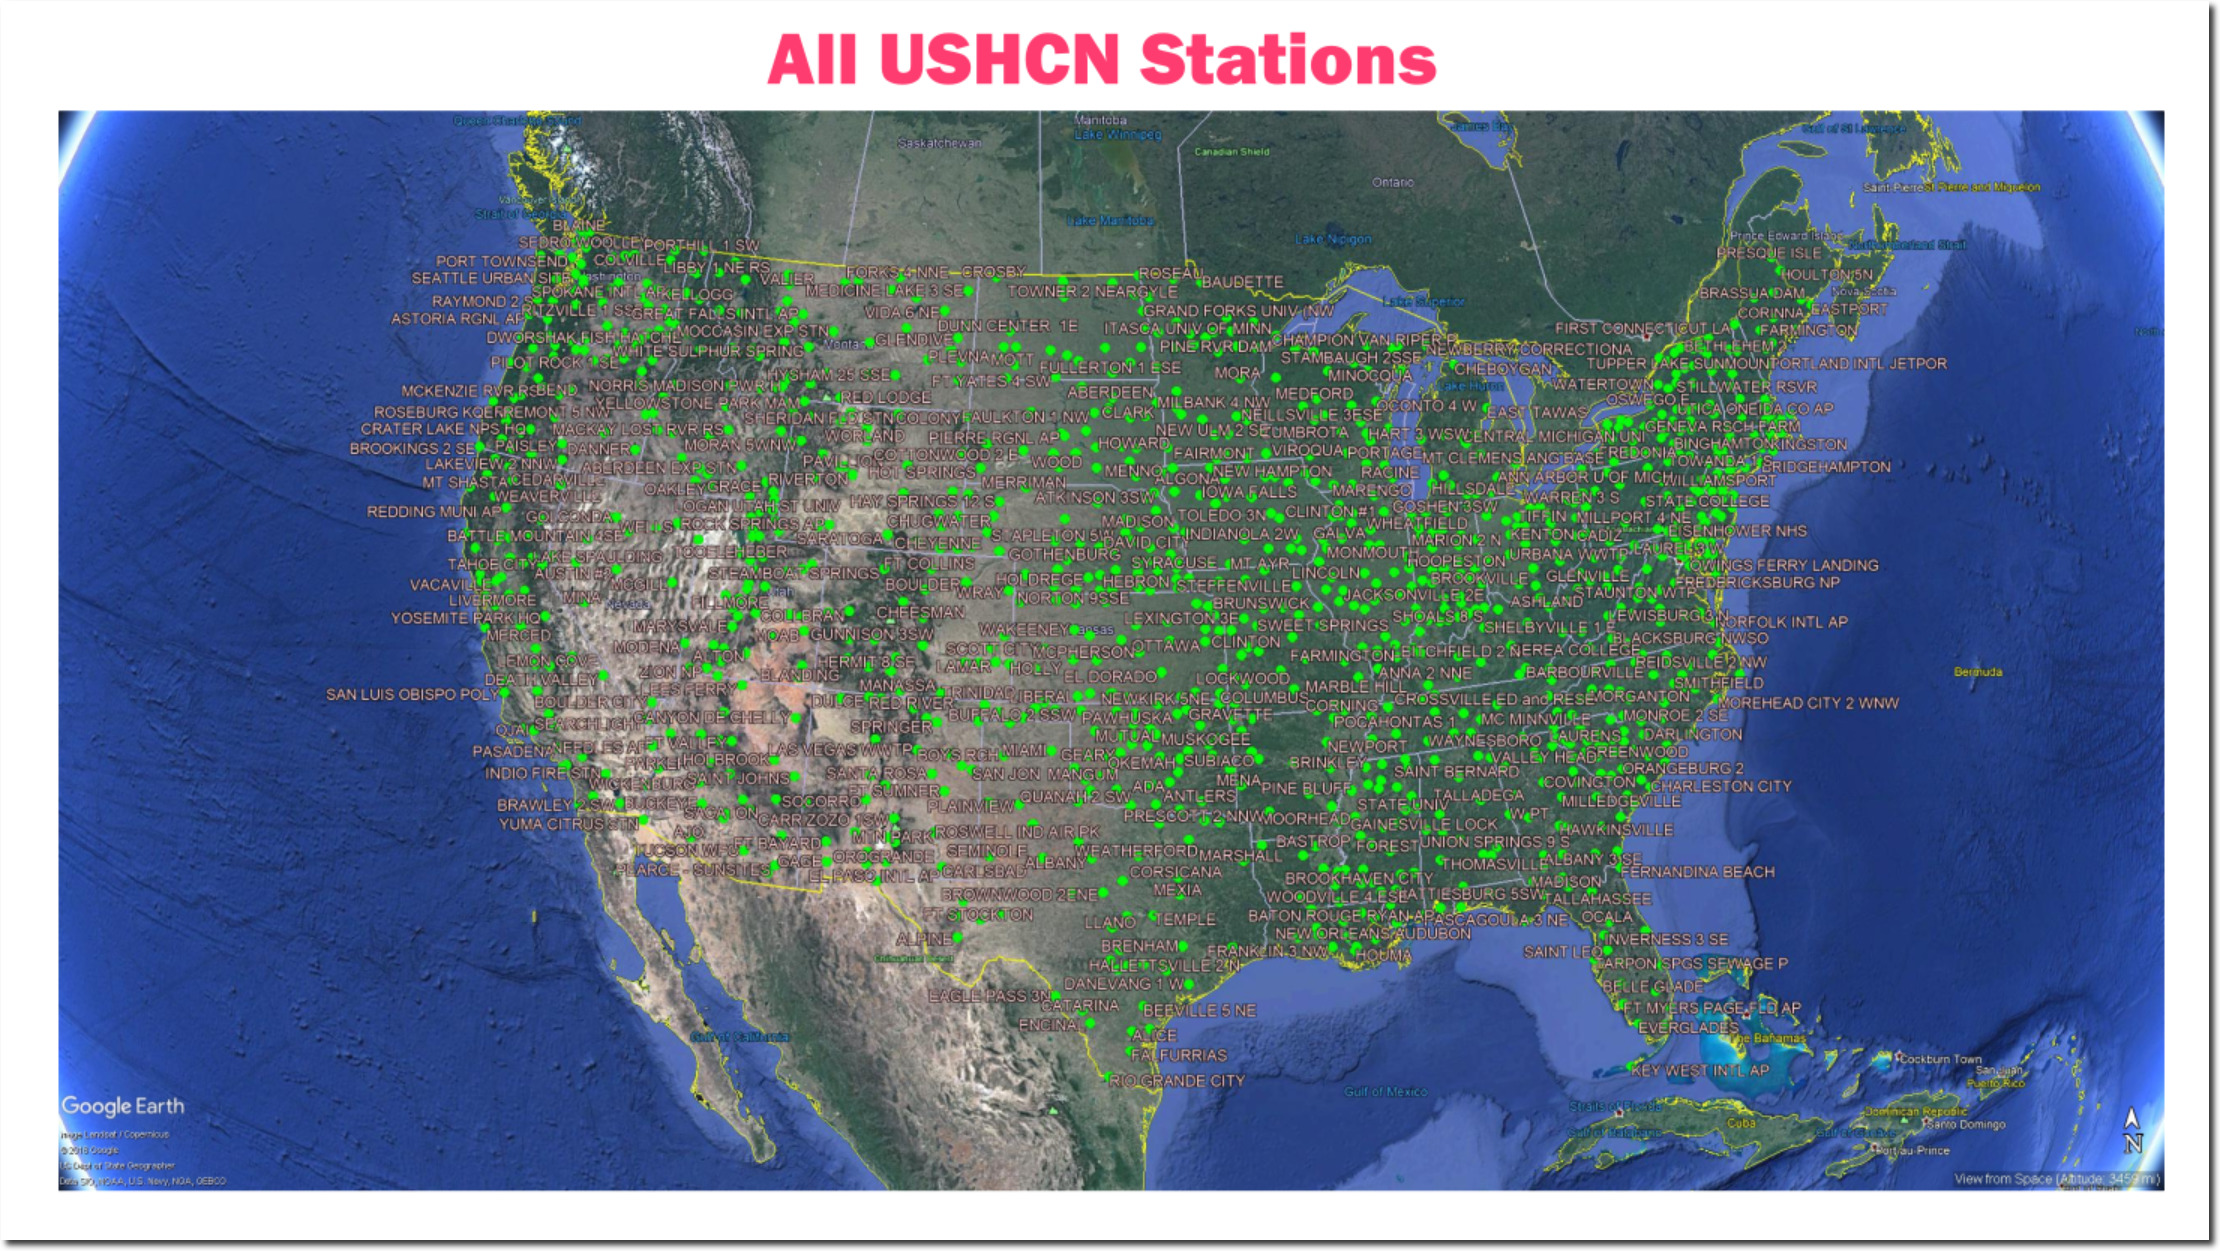
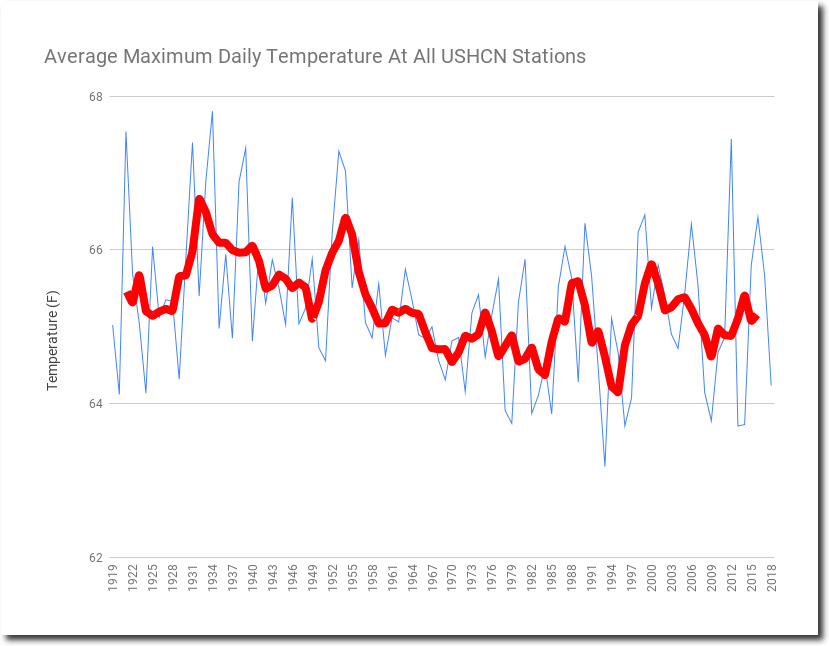
By contrast, the thermometer data from the 1,218 NOAA US Historical Climatology Stations (USHCN) show a decrease in afternoon temepratures.
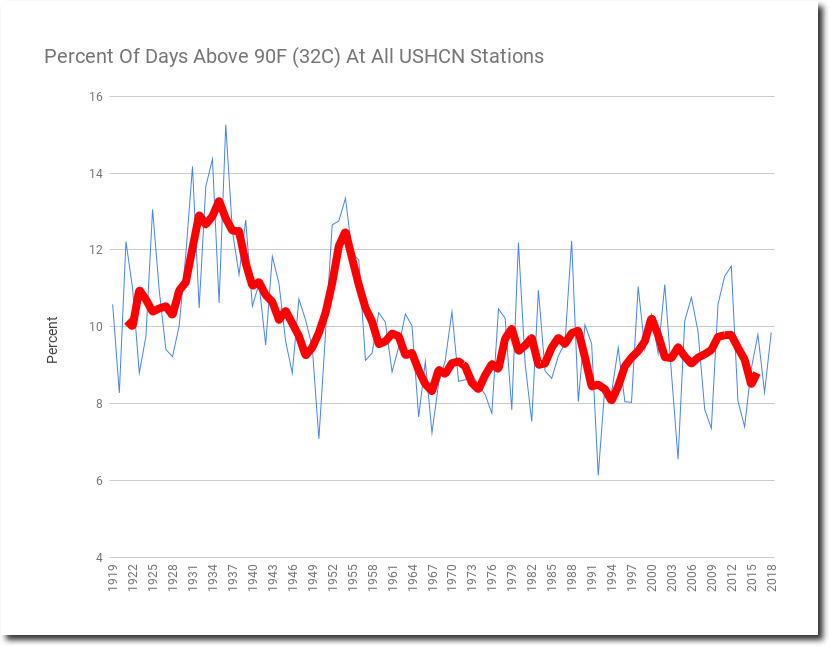
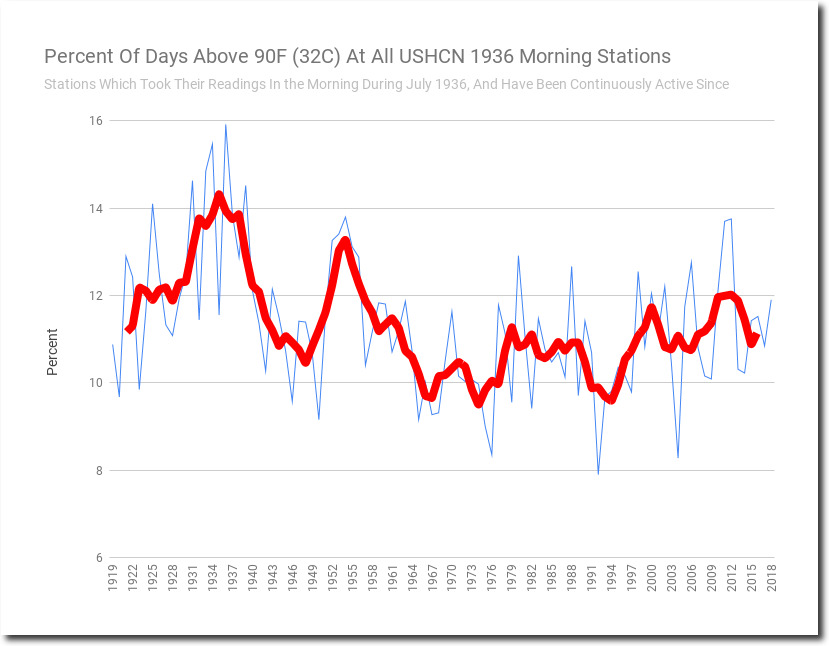
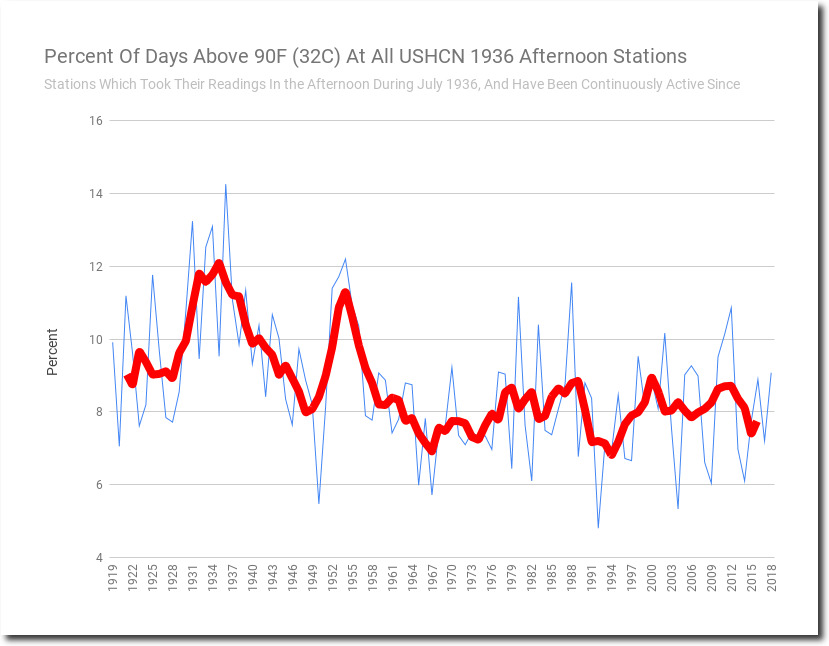
The percent of hot days has plummeted.
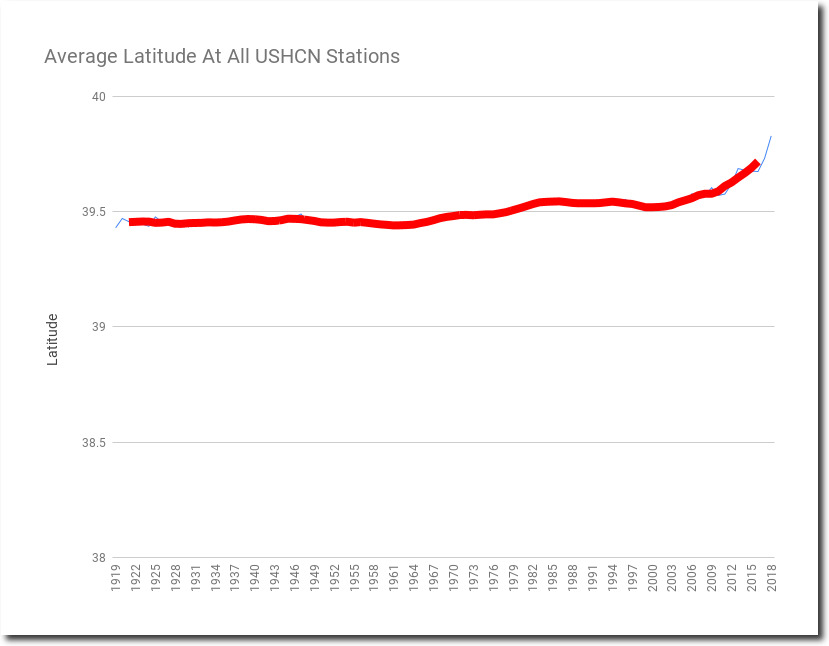
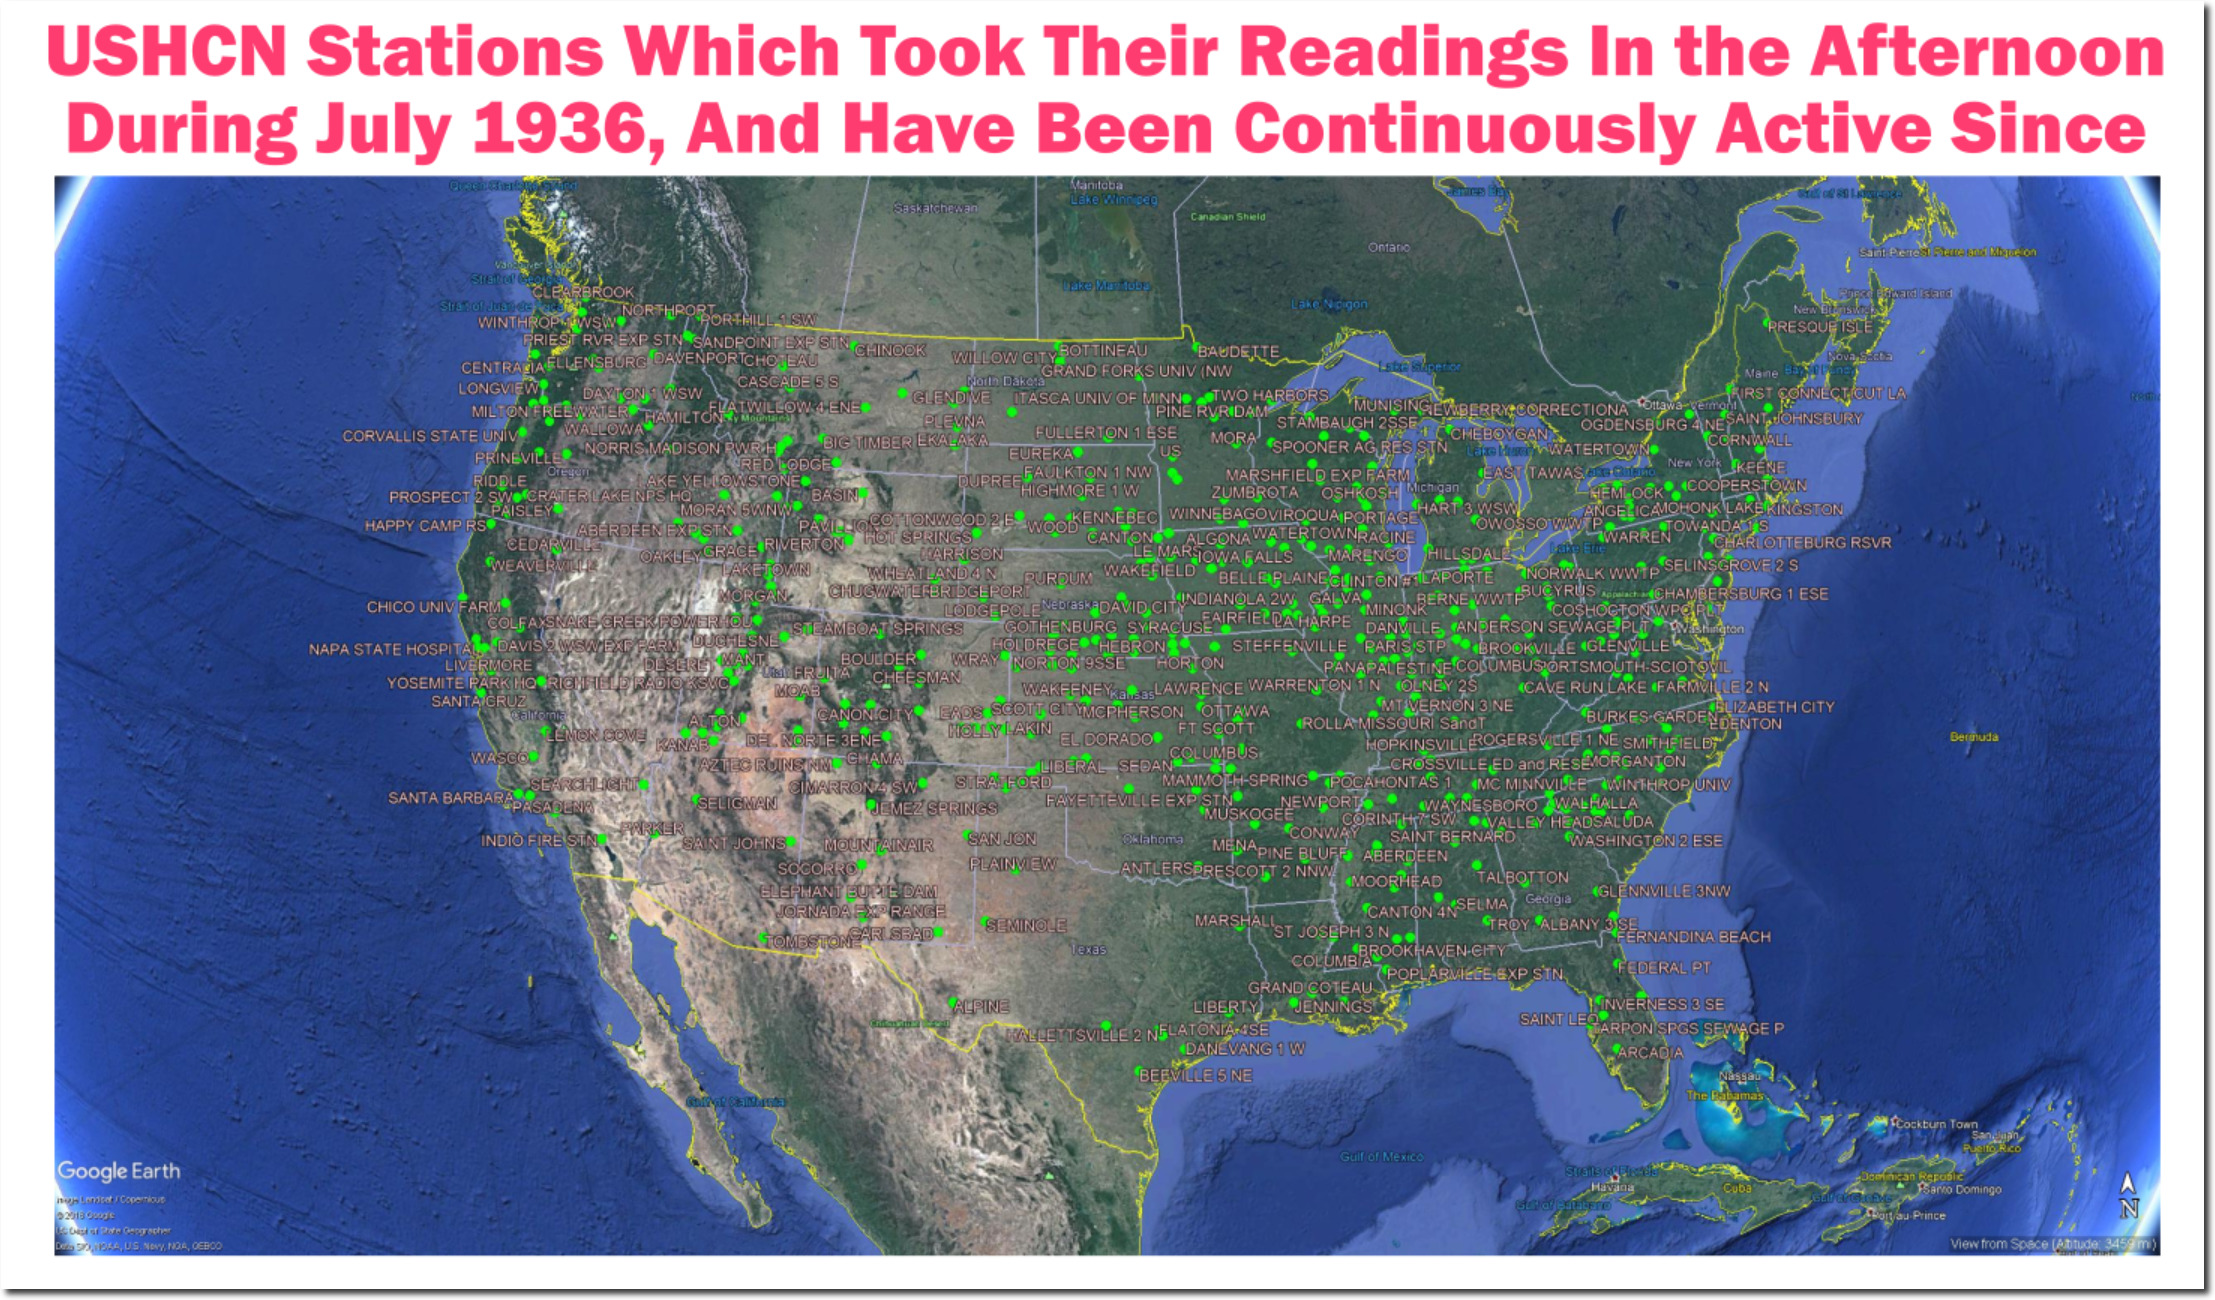
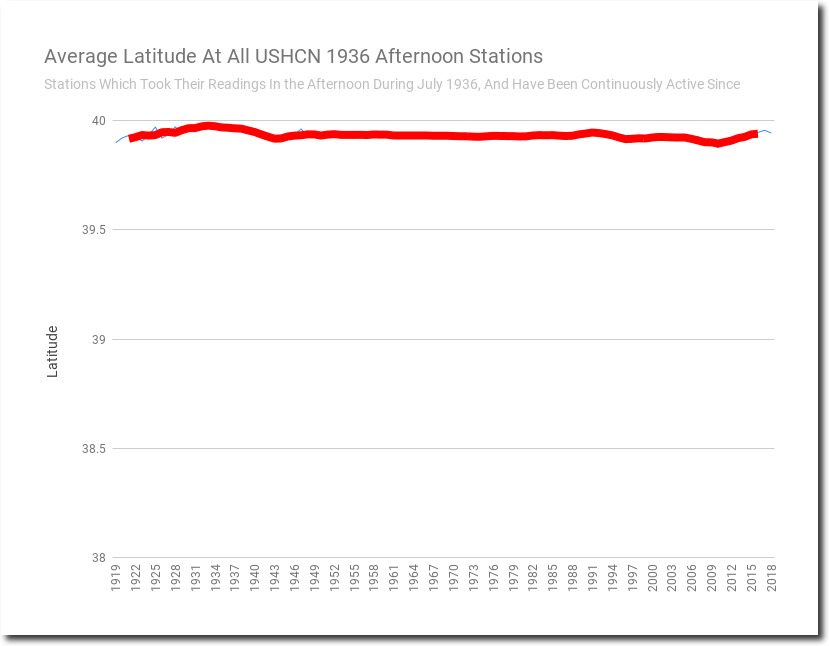
The two most often cited excuses for the data tampering, are a change in average latitude (changing station composition) – and a change in the time when the min/max thermometers were reset (Time of Observation Bias.) The argument behind TOBS adjustments is that most people in the 1930s reset their thermometers during the afternoon, causing double counting of hot days, making the 1930s data too hot.
It is simple enough to eliminate these effects by using a consistent set of long term stations which all reset their thermometers at the same time during the 1930s. This eliminates any need to correct the data.
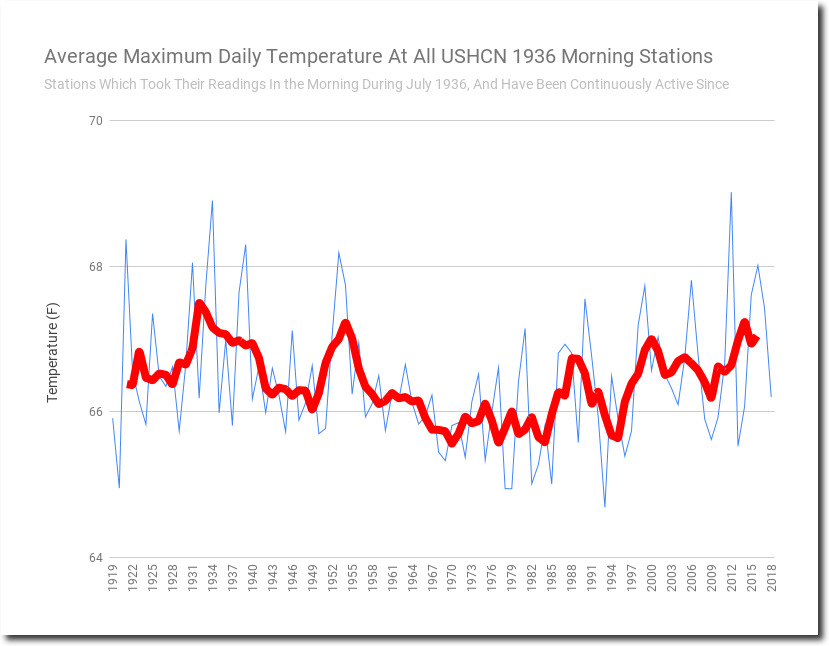
Morning stations show approximately the same trend as the set of all stations.


Afternoon stations show approximately the same trend as the set of all stations.

What this analysis shows is that the adjustments are unsupportable. TOBS and changing station composition effects are much smaller than the adjustments being made. The US is not warming, and the adjustments which make it appear to be warming are fraudulent.
Even worse is that the data is being altered with the vast majority of the public unaware. If NOAA has concerns about data quality, the correct way to handle it would be to put error bars on the graph – not alter the data to match their theory.
