
The flagrant liars at the University of Colorado and NASA claim that sea level is rising 3.3 mm/year
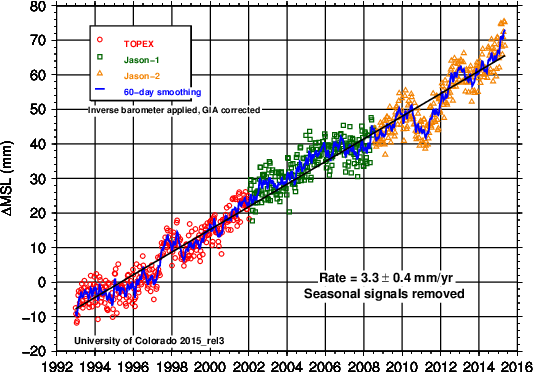
NOAA says it is just over half that much.
absolute global sea level rise is believed to be 1.7-1.8 millimeters/year
NASA claims that earth is on track for three feet of sea level rise by the year 2100, even though their own data shows twelve inches and the NOAA data shows seven inches.
Reality is that both are wildly exaggerated, with the actual numbers being closer to one or two inches.
h/t Pierre Goselin

Sea level rise globally is 1.44 mm per year. The satellites are extremely unreliable and the tide gauges on any continent show glacial rebound, up, down, or sideways. The piers are sinking and the mud is shifting, and the Obama government lies about everything. How about using a giant solid rock in the middle of the Pacific, thousands of miles from disruptions, and ignore all other wrong useless data?:
http://tidesandcurrents.noaa.gov/sltrends/sltrends_station.shtml?stnid=1612340
Australia is pretty much a “giant rock in the Pacific” and Sydney sitting on 200 million year old sandstone is pretty stable. And Sydney (Fort Denison) SL rise is 0.65 mm/yr since mid 1800’s according to NOAA.
I downloaded the two files (U.S. and global) from NOAA’s page, and combined them into a single Excel spreadsheet. For ease of sorting, I changed the U.S. station ID numbers by adding an “A-” prefix. I also added “average” and “median” lines at the end of the spreadsheet. The average of 375 NOAA-analyzed stations is 1.28 mm/yr, and the median is 1.71 mm/yr:
http://www.sealevel.info/NOAA_AllStationsLinearSeaLevelTrends_2015-08.xls or
http://www.sealevel.info/NOAA_AllStationsLinearSeaLevelTrends_2015-08.htm
Some of the difference between the calculated average and NOAA’s figure of 1.7-1.8 mm/yr MSL rise may be due to the addition of model-derived GIA adjustments to the measured rates when calculating the average, to attempt to account for Post-Glacial Rebound (PGR). My guess is that they’re using Prof. Richard Peltier’s figures.
Prof. Peltier also estimates that meltwater load from the melting of the great ice sheets (~10k years ago) is causing the ocean floors to sink by enough to cause a 0.3 mm/yr fall in sea-level, absent other factors. That number (0.3 mm/yr) is usually added to calculated “global average” sea-level rise rates, inflating the reported average, even though the resulting sum is not truly sea-level, and is not useful for projecting sea-level for coastal planning. (It’s an attempt to calculate what the rate of sea-level rise would be, were it not for the hypothesized sinking of the ocean floor.)
Unfortunately, many of the tide station records in NOAA’s expanded list of 375 are too short to be appropriate for measuring sea-level trends. The literature indicates that at least 50-60 years of data are needed to establish a robust sea-level trend from a tide station record. But the shortest record in NOAA’s list is Apra Harbor, Guam, with just 21 years of data. (The text at the top of NOAA’s page says, “Trends with the widest confidence intervals are based on only 30-40 years of data,” but that is incorrect. I suspect they wrote it before they added the gauges with very short records.)
So I also made a version of this spreadsheet in which stations with records shorter than 50 years are omitted.
Considering only tide stations with records of at least 50 years, the average and median rates of MSL rise (of the 225 remaining stations) are 0.90 mm/yr and 1.41 mm/yr, respectively:
http://sealevel.info/NOAA_AllStationsLinearSeaLevelTrends_2015-08_50yr.xls or
http://sealevel.info/NOAA_AllStationsLinearSeaLevelTrends_2015-08_50yr.htm
(I also tried limiting it to stations with records of at least 60 years, with very similar results: average 0.77 mm/yr, and median 1.37 mm/yr.)
The average (0.90 mm/yr) is probably unrealistically low, due to the disproportionate number of stations in northern Europe which see low or negative rates of measured sea-level rise due to PGR. The fact that the average is less than the median also suggests that there are a disproportionate number of low-end outliers.
I also tried another approach, in which I excluded the most extreme latitudes. I started with just the “50+ year” stations, and included only stations within a latitude range of ±45° (i.e., I excluded stations above 45° north or below 45° south). The resulting average and median for 137 stations were 2.22 mm/y and 2.02 mm/yr, respectively:
http://www.sealevel.info/NOAA_AllStationsLinearSeaLevelTrends_2015-08_50yr_lowLat.xls or
http://www.sealevel.info/NOAA_AllStationsLinearSeaLevelTrends_2015-08_50yr_lowLat.htm
That approach largely solves the problem of low-side bias introduced by stations which are affected by PGR (which lowers the calculated average), but it doesn’t solve the problem of high-side bias introduced by stations affected by subsidence (which raises the calculated average). So the average (2.22 mm/yr) is probably unrealistically high. The fact that the average is greater than the median also suggests that there are a disproportionate number of high-end outliers.
So I tried another approach, this time explicitly eliminating “outliers.” I started with just the “50+ year” stations, but excluded the 40 stations with the lowest rate of sea-level rise (including most of those experiencing falling sea-level), and the 30 stations with the highest rate of sea-level rise (including most of those experiencing severe land subsidence, like Galveston, which is built on sinking fill dirt). The resulting average and median rates of sea-level rise (calculated from 155 stations) are both 1.48 mm/yr:
http://www.sealevel.info/NOAA_AllStationsLinearSeaLevelTrends_2015-08_50yr_less_high30_and_low40.xls or
http://www.sealevel.info/NOAA_AllStationsLinearSeaLevelTrends_2015-08_50yr_less_high30_and_low40.htm
That figure, 1.48 mm/yr, is my current best estimate of globally averaged coastal sea-level rise. At first glance, excluding more low outliers than high outliers might seem to bias the result to the high end. But I think it is justifiable, because of the disproportionate number of northern European and North American stations at locations where the land is rising due to PGR. The fact that the median and average are equal suggests that there aren’t disproportionate numbers of either high or low outliers. (I also tried excluding the low and high 35 stations, and the result was an average MSL rise of 1.36 mm/yr, and median 1.41 mm/yr, which suggests that it includes more low outliers than high outliers.)
Note that if you add Peltier’s 0.3 mm/yr GIA to the calculated 1.48 mm/yr global average rate of MSL rise, the sum is within NOAA’s 1.7-1.8 mm/yr range.
Don’t pay any attention to the #AGWstooges babbling
https://www.pinterest.com/pin/561964859731238786/
The local paper in Virginia Beach, Virginia editorialized on the need to do “something” this past Sunday using the 3 feet prediction. Once the battlefield is prepared by disinformation I’m expecting a massive push for government flood mitigation projects.
There are big banks and big developers here who need big projects to keep going. Our other big, stupid project is a light rail system. That is still facing some stiff resistance 300 million for 3 miles of track. I don’t think there is any limit to how much money could be spent on holding back the rising seas.
If you remove all the “Corrections” from thr CU data, the current rate is about 1.9 mm per year.
But have they corrected for the 18.6-yearly Luna Nodal cycle?
The Dutch seems to have found it.
Local Relative Sea Level
To determine the relevance of the nodal cycle at the Dutch coast, a spectral analysis was carried out on the yearly means of six main tidal gauges for the period 1890–2008. The data were corrected for atmospheric pressure variation using an inverse barometer correction. The spectral density shows a clear peak at the 18.6 -year period (Figure 1). The multiple linear regression yields a sea-level rise (b1) of 0.19 +/- 0.015 cm y-1 (95%), an amplitude (A) of 1.2 +/- 0.92 cm, and a phase (w) of -1.16 (with 1970 as 0), resulting in a peak in February 2005 (Figure 2). No significant acceleration (inclusion of b2) was found.
CONCLUSIONS
Coastal management requires estimates of the rate of sealevel rise. The trends found locally for the Dutch coast are the same as have been found in the past 50 years (Deltacommissie, 1960; Dillingh et al., 1993). Even though including the nodal cycle made it more likely that the high-level scenarios would become apparent in the observations, no acceleration in the rate of sea-level rise was found. The higher, recent rise (van den Hurk et al., 2007) coincides with the up phase of the nodal cycle. For the period 2005 through 2011, the Dutch mean sea-level is expected to drop because the lunar cycle is in the down phase. This shows the importance of including the 18.6-year cycle in regional sea-level estimates. Not doing so on a regional or local scale for decadal length projections leads to inaccuracies.
http://www.bioone.org/doi/pdf/10.2112/JCOASTRES-D-11-00169.1
Linear trend lines on sinusoidal curves are very time dependent.
Same old recycled scare stories. You would think they would get tired of crying wolf when there are no wolves in sight.