
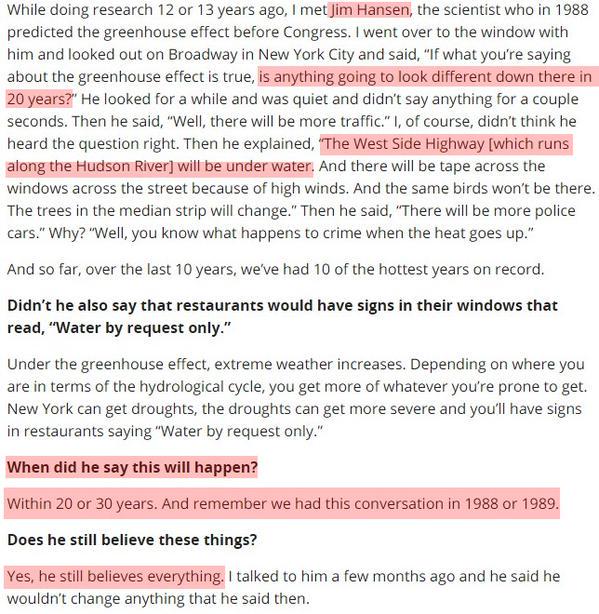
In 1983, NASA’s James Hansen showed 9 cm (3.5 inches) of sea level rise from 1880 to 1980, or 0.9 mm/year.

NASA now shows twice that much sea level rise from 1880 to 1980 – 1.8 mm/year
The graph below overlays the two at the same scale, normalized to 1880. Impressive data tampering from NASA’s band of climate criminals.
But it is much worse than it seems. NASA now ignores tide gauge data because it shows sea level rise slowing since the 1950’s, and instead uses massively tampered satellite data to claim a sea level rise rate of 3.22 mm/year.
But even at their wildly fraudulent 3.22 mm/year, it will still take thousands of years to drown Manhattan, which Hansen predicted would happen between 2008 and 2018.
The level of fraud and incompetence at NASA is so massive, that they want to jail anyone who criticizes them.

Have you noticed how ALL the ‘weather news’ is about 90% California? Even Arizona has had monsoon rains now and even dangerous floods. The entire focus is on California…it is burning up! It is dry! Hot! Movie stars are fainting in the super heat of LA!!! We are all doomed.
Just a small typo: “James Hansen showed 9 cm (3.5 inches) of sea level rise from 1880 to 1980, or 9mm/year.” I think that should be 0.9mm. Same thing a bit further down: “NASA now shows twice that much sea level rise from 1880 to 1980 – 18mm/year”. That should be 1.8mm.
Tony, I am constantly amazed by your ability to show so plainly that the official statistics are wrong. I am also constantly amazed that so many people cannot see the facts when you present them so plainly.
I’m amazed that I live directly on the ocean…and our water level has not changed since this house was built over 75 years ago
From an older comment by tomwys1
Gail, we live on a rock…I’m pretty sure it’s not subsiding….dock is cut into solid rock…it’s at exactly the same water level
thanks for that link from Tom…you’re the best!
Reblogged this on Climatism and commented:
Truly Orwellian.
Here’s what Colorado University’s Sea Level Research Group has done to the data
http://oi59.tinypic.com/24e8482.jpg
When first published in 2004 the rate was 2.6 mm/yr
Today that same time line out to 2004 is 3.5 mm/yr.
Thanks Tony that is a great find.
And by the way, the CU Sea Level Research Group’s latest release 3 is up to 3.3 mm/yr so expect NASA to bump that “Satellite Data 1993 – Present” chart to CU’s latest.
I’m expecting CU to come out with Release 4 in time for Paris in December. It will be interesting to see if they can squeeze 3.4 out of their satellites.
O want to inspire young people to “science”:
“Cool clock, Ahmed. Want to bring it to the White House? We should inspire more kids like you to like science. It’s what makes America great.”
Too bad this “science” is also a fraud:
http://www.thegatewaypundit.com/2015/09/hoax-exposed-muslim-student-ahmed-mohameds-briefcase-clock-is-1970s-digital-alarm-clock/
AND he was making a prototype suitcase bomb minus the TNT. It is quite obvious. I googled ‘suitcase bombs’ and all the actual ones mainly from the FBI and EU cops looked exactly like his ‘experiment’.
He was probably checking to see if he could actually get it into the school. Now idiot Progressives are donating lots of money to the kid.
All the parents at that school should tell the town, he goes or we go and back it up. Start another school and refuse to pay the school tax.
Until parents get some backbone their kids are going to be at risk.
On the other had his activist Daddy might supply him with a real one for the Obummer invite….
And long term the Sea levels are still FALLING as glaciers re-establish in the Arctic and Norway.
This is a critical study because it is the one that yanks the WIKI sea level chart (adjusted of course) from a falling sea level to a slowly rising sea level. (The area is tectonically stable and unglaciated so there is no need for any adjustments.)
https://upload.wikimedia.org/wikipedia/commons/1/1e/Holocene_Sea_Level.png
Santa Catarina is the dark red cross above the pack on the right. Remove it and sea level is actually falling for the last 2,000 years.
The Quaternary Geological History of the Santa Catarina Southeastern Region (Brazil) 1999
The first part discusses drilling in several locations and analyzing samples. They mention dating prior to that was guesses. “…. A drilling campaign done in the domain permitted the sampling of material for 14C datings, and the obtained data confirmed some previously assumed ages. The sequence of events, that originated the Holocene deposits, has been also reconstructed through drilling and 14C dating of the collected peat and shell samples…”
In the body of the text is this:
“…a relative sea-level change curve for the last 7 ky in the area Florianópolis-Jaguaruna (Fig. 7) is outlined…”
http://www.scielo.br/img/fbpe/aabc/v72n2/0025img17.gif
This study shows a sea level highstand ~ 4 meters above the present level about ~5000 years ago. With sea level oscillating since then. Not only has the sea levels dropped since the Holocene Optimum the evidence shows that “warmer paleotemperatures were favourable for great proliferation of mollusks in the area” (Santa Catarina Brazil is at latitude 27.2500°S. )
Two more studies showing falling sea level.
Mid to late Holocene sea-level reconstruction of Southeast Vietnam using beachrock and beach-ridge deposits
Translation the sea level was up to 1.5 meters higher than today in a tectonically stable area ~5000 years ago to 2000 years ago.
Late Quaternary highstand deposits of the southern Arabian Gulf: a record of sea-level and climate change
This study shows a sea level highstand ~1 to 2 meters above the present level about ~5500 years ago.
How Inconvenient.
snicker
IIRC there a few British forts/ports built during the MWP that are now high and dry. Unfortunately I need to get better at saving links to such things, since my memory for details isn’t what it used to be
Snowleopard, here is your link
http://aoi.com.au/bcw/Sealevel/index.htm
Thanks Gail,
It’s always nice to have a bit more ammo. 🙂
I’ve read of archaeological digs along the then Gulf of Mexico shore, 4-6 K years ago, 50 miles inland from the present shoreline.
If everyone in this country knew what we knew, there would be blood in the streets. But most people are too preoccupied about their fantasy football teams and the latest idiot sitcom to know anything or give a damn.
Andy,
I am afraid you are correct. Until they are really hurting people don’t pay attention to what the corrupt politicians are up to. With the MSM as a cover the politicians literally get away with murder.