
In 1976, Indiana University produced this graph of Indiana temperatures, showing three degrees cooling from 1935 to 1970

This didn’t suit NOAA’s agenda, so they reduced all pre-1955 temperatures and made it only two degrees cooling instead of three. NCDC simply made the hot 1930’s disappear.
Climate at a Glance | National Centers for Environmental Information (NCEI)
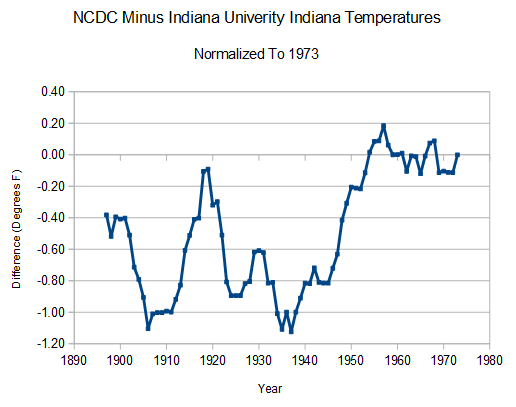
The next graph shows the two at the same scale, normalized to the 1955-1970 period.

This graph shows the magnitude of NOAA’s data tampering.
So what is NCDC is trying to hide in the pre-1955 period?
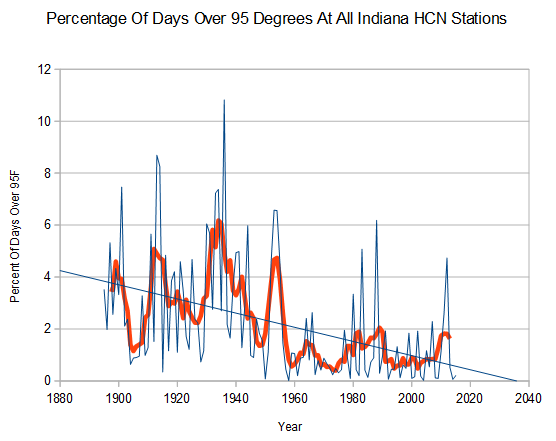
Indiana was very hot prior to 1955. Ninety-five degree days occurred four times as often in Indiana a century ago, as they do now.
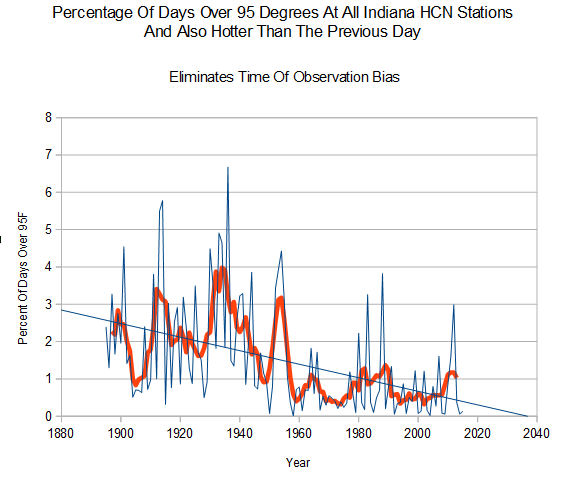
Climate fraudsters will claim that the graph above is skewed due to Time Of Observation Bias (TOBS) double counting, so I created the next graph to eliminate that argument. It shows only 95 degree days which were also hotter than the previous day. This greatly reduces any possibility of double counting. It shows that the alarmist TOBS argument is bankrupt.
Indiana’s hot past wrecks their climate scam, so the fraudsters at NOAA simply altered the data.
It doesn’t matter how beautiful your theory is, it doesn’t matter how smart you are. If it doesn’t agree with experiment, it’s wrong.
- Richard P. Feynman

Steven, you can’t support an accusation of fraud by showing that data has been adjusted. Data adjustments are a normal part of climate science. You can’t even support a claim that an adjustment is wrong by showing the adjustment.
[SG: The 95 degree data shows unequivocally that the 1930s were much hotter, and that the adjustments are fraudulent. I am always hoping that you will attempt to use your brain.]
And you cannot prove that the adjustments are justified. Come on.
Produce evidence show the reason for all the adjustments.. all the data.. all the adjustments.
Otherwise SG can say what he likes.. prove him wrong.. you KNOW you can’t.
All the evidence points to MASSIVE unjustified data manipulation toward the aim of CREATING a NON-EXISTENT warming trend for political and monetary gain.
All the climate glitterati know of the accusation of FRAUD that SG can make at will.
Not one of them is game enough to bring their game. I wonder why that would be. 😉
Andy, the scientific justification for each adjustment is available from the institution maintaining the data, as well as the adjusted and unadjusted data. Each adjustment is a matter of public record, so you can find them yourself, if you are truly interested in understanding how the work is done. So the proofs that you want me to produce for you have been done and they are available to you. I don’t have to repost them here. What can’t be justified is Steven’s accusation of fraud, for which he has not now, nor ever, as far as I can tell, supported with any evidence. Showing that data have been adjusted is not evidence of anything except the data have been adjusted.
The provide the methodology and reasoning for each adjustment.. YOU CAN’T
Take Reykjavik for example.. The Iceland guys say their data is good, yet GISS makes MASSIVE UNJUSTIFIED ADJUSTMENTS to get rid of the 1940 peak that is equal to 1998
There is ABSOLUTELY NO SCIENTIFIC REASON for the adjustment. It is FRAUD
Same applies for many other places around the world.
The only reliable data is the satellite data , and it shows NO WARMING FOR 18+ YEARS.
This is something you cannot blather away.
And saying that the methodology is in scientific literature is meaningless.
Climate peer review is such a mess as to be an absolute nonsense.
Public record?
Really?
Can you share those “public record” justifications?
Because NASA/NOAA/GISS will not.
We’ve FOIAed those justifications. They demanded $262,000 to search for the justifications.
If you’ve got the justifications, please do share.
Thanks.
“… the scientific justification for each adjustment is” being torn to shreds by REAL scientists.
Paul Homewood talk to Trausti Jónsson, a senior climatologist at the Icelandic Met Office, who wrote Paul Homewood in 2012, ““The GHCN “corrections” are grossly in error in the case of Reykjavik”. GISS made Reykjavik’s warm 1940 period disappear by reducing the real temperatures by up to nearly 2 degrees. Jónsson wrote that he was unaware that NOAA made corrections to Iceland’s historical data, did not agree with them, and refused to modify Iceland’s own historical temperature records.
Zeke Hausfather stated @ Judith Curry’s
“Back in the 1940s virtually all the stations used liquid-in-glass thermometers, which read about 0.6 degrees warmer in max temperatures (and about 0.2 degrees colder in min temperatures) than the new MMTS instruments introduced in the 1980s. This means that actual max temperatures (as measured by MMTS instruments) would have been ~0.6 degrees colder, and contribute part of the reason for adjusting past temps downwards.” This was based on one very limited study that I already covered a couple months ago.
Klaus Hager carried out a study comparing MMTS and Glass thermometers side by side for a period of 8.5 years and found that the MMTS gave a mean difference that was 0.93C warmer. Klaus Hager is a 44-year veteran German meteorologist and wrote a peer-reviewed paper on his findings. http://wkserv.met.fu-berlin.de/Beilagen/2013/Autom%20WSt_Hager.pdf
Another peer-reviewed study Sensor and Electronic Biases/Errors in Air Temperature Measurements in Common Weather Station Networks by Lin et. al. concluded:
In the peer reviewed study “Air Temperature Comparison between the MMTS and the USCRN Temperature Systems” Hubbard et. al. concluded:
Now Dr. Bill Johnston a retired scientist has found the same problem with Australian MMTS temperature records and a lot more…
On the quality of Australia’s temperature data by Dr. Bill (WH) Johnston.
(Former NSW Department of Natural Resources Senior Research Scientist.)
Finally the problems with the MMTS is graphically represented by the incident at at Heathrow Airport.
CONCLUSION: NOAA’S ADJUSTMENTS ARE NOT JUSTIFIED!
AndyG55 says: “Produce evidence show the reason for all the adjustments.. all the data.. all the adjustments.”
Martin responds: “Andy, the scientific justification for each adjustment is available from the institution maintaining the data, as well as the adjusted and unadjusted data. Each adjustment is a matter of public record, so you can find them yourself, if you are truly interested in understanding how the work is done. So the proofs that you want me to produce for you have been done and they are available to you. I don’t have to repost them here.”
Martin, it would be simpler and more accurate to just respond, “Nya, nya, nya! I won’t show you!”
And trust me — sceptics have searched long and hard.
Martin Smith, you can not refute an argument consisting of hundreds of different posts making disparate analogies of the surface record vs the satellite record, by isolating one post, but hey lets talk about this one post. Please explain what scientific theory supports these adjustments which are far greater then the questionable TOBS adjustments, and are not cogent to those adjustments anyway.
David, the satellite record and the surface record are not directly comparable. This explains why. It also proves that Steven’s claim about the satellite data and the surface data diverging is wrong:
http://www.skepticalscience.com/uah-lowballing-global-warming.html
[SG : Global warming theory is based on troposphere temperatures, which means that satellites and balloons are the only legitimate way to measure it. John Cook is lying, as always]
http://www.woodfortrees.org/graph/rss/from:2001/mean:12/plot/rss/from:2001/trend/plot/gistemp/from:2001/mean:12/offset:-0.30/plot/gistemp/from:2001/trend/offset:-0.30
SkS propaganda and lies again..
NOBODY will even bother looking at it.
You are a FOOL, Martin the Gore-bot.
You have NO SCIENCE to back up anything you say.. SkS is NOT science.
I thought you said you were leaving
He can’t leave. Spaming is how he earns his living &/or Jollies.
Martin-
Tony clearly demonstrated either fraud or incompetence in this post. A very substantial portion of the adjustments are based on correcting presumed TOBS induced errors. The two 95 degree day graphs above show far more correlation than the CO2-O18 graphs derived from ice cores. Tony has demonstrated that, at least in Indiana, TOBS errors are negligible. Adjustments based on disproven errors are either fraudulent, or inept.
First comment on Steve’s blog again, Marty?
Does that get you a bonus from Troll Central, you sad, pathetic little stalker?
Get a life FFS!
It’s all just a coincidence that every adjustment to the data serves to make the past cooler.
Nothing to see here. Move along.
That’s false, Bob. Proof by counterexample. See point 4: http://www.skepticalscience.com/what-you-need-to-know-about-karl-2015.html
Again.. because you seem not to comprehend as usual.
Links to SkS are not science.. they are twisted propaganda.. and you fall for it because you have the brains of a two year old.
You make an ABSOLUTE FOOL of yourself with your continued citing of their links.
That’s a load of horse manure and you know it. Warmists have struggeled with explaining the pause for years. Now we are supposed to believe this ONE study and ignore reality. Not buying it.
“Again.. because you seem not to comprehend as usual.”
It doesn’t matter.
He doesn’t get paid to comprehend, he gets paid to disrupt the blog.
And as usual WUWT keeps flogging GISS, HADCRUT, NCDC, NOAA data as if it was credible!!
Crazy, isn’t it.
Josh’s stuff is always good , though 🙂
https://wattsupwiththat.files.wordpress.com/2015/11/huff_mann_scr.jpg?w=720
Anthony Watts at WUWT has Zeke Hausfeather, Steven Mosher and others whispering in his ear.
Zeke is a flat out CAGW PROPAGANDIST!
as shown here: http://www.yaleclimateconnections.org/2008/02/common-climate-misconceptions-the-water-vapor-feedback-2/
(Steven better take a screenshot and archive it before MS runs back to CAGW central and makes sure it is disappeared.)
His crud on Judith Curry’s site (Curry is another CAGW PROPAGANDIST) shows him dancing around the ‘adjustment’ subject with the best of them.
https://www.youtube.com/watch?v=zTUoDy2IhCE
(original was removed from internet, DARN!)
https://www.youtube.com/watch?v=PHkT3RJJBCA
Apparently alarmists never actually look at the data when they are discussing their religion…
http://clivebest.com/blog/wp-content/uploads/2013/03/GlobalRelativeHumidity300_700mb.jpg
Variations in the total column water vapour in the atmosphere July 1983 to June 2009.
http://www.climate4you.com/images/TotalColumnWaterVapourDifferentAltitudesObservationsSince1983.gif
Specific atmospheric humidity (g/kg) at three different altitudes in the lower part of the atmosphereJanuary 1948 to November 2015
http://www.climate4you.com/images/NOAA%20ESRL%20AtmospericSpecificHumidity%20GlobalMonthlyTempSince1948%20With37monthRunningAverage.gif
You can then toss in Dr Evans CO2/water feedback: Solving the Mystery of the Missing “Hotspot”.
Abstract
Stratospheric water vapor concentrations decreased by about 10% after the year 2000. Here we show that this acted to slow the rate of increase in global surface temperature over 2000–2009 by about 25% compared to that which would have occurred due only to carbon dioxide and other greenhouse gases. More limited data suggest that stratospheric water vapor probably increased between 1980 and 2000, which would have enhanced the decadal rate of surface warming during the 1990s by about 30% as compared to estimates neglecting this change. These findings show that stratospheric water vapor is an important driver of decadal global surface climate change.
https://www.sciencemag.org/content/327/5970/1219.abstract
Thank you, Thank you, Thank you!!!!
That sucker gets bookmarked!
>>>>>>>>>>>>>>>>>>>
This study pretty much kills Zeke Hausfather’s crap article.
http://www.yaleclimateconnections.org/2008/02/common-climate-misconceptions-the-water-vapor-feedback-2/
And the whole tipping point nonsense.
My pleasure, Gail!
I note that it was probably one of the shortest lasting posts WUWT ever did though! It was downgraded after 1 hour. Re Bob Tisdales Giss data ect
http://journals.ametsoc.org/doi/abs/10.1175/1520-0477%281980%29061%3C1356%3APCCAAP%3E2.0.CO%3B2
Evidence has been presented and discussed to show a cooling trend over the Northern Hemisphere since around 1940, amounting to over 0.5°C, due primarily to cooling at mid- and high latitudes. Some regions of the middle latitudes have actually warmed while others, such as the central and eastern United States, have experienced sharp cooling. A representative station for this latter region is Lafayette, Ind., which has recorded a drop of 2.2°C in its mean annual temperature from 1940 through 1978. The cooling trend for the Northern Hemisphere has been associated with an increase of both the latitudinal gradient of temperature and the lapse rate, as predicted by climate models with decreased solar input and feedback mechanisms.