DMI continues to show the Arctic melting.
Ocean and Ice Services | Danmarks Meteorologiske Institut
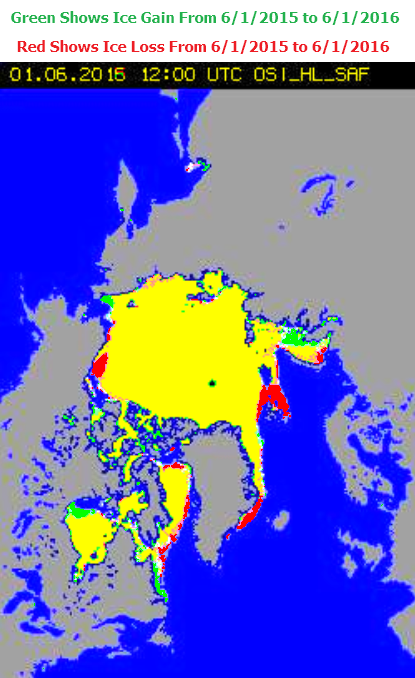
Their maps show that there has been very little melt over the past three days.
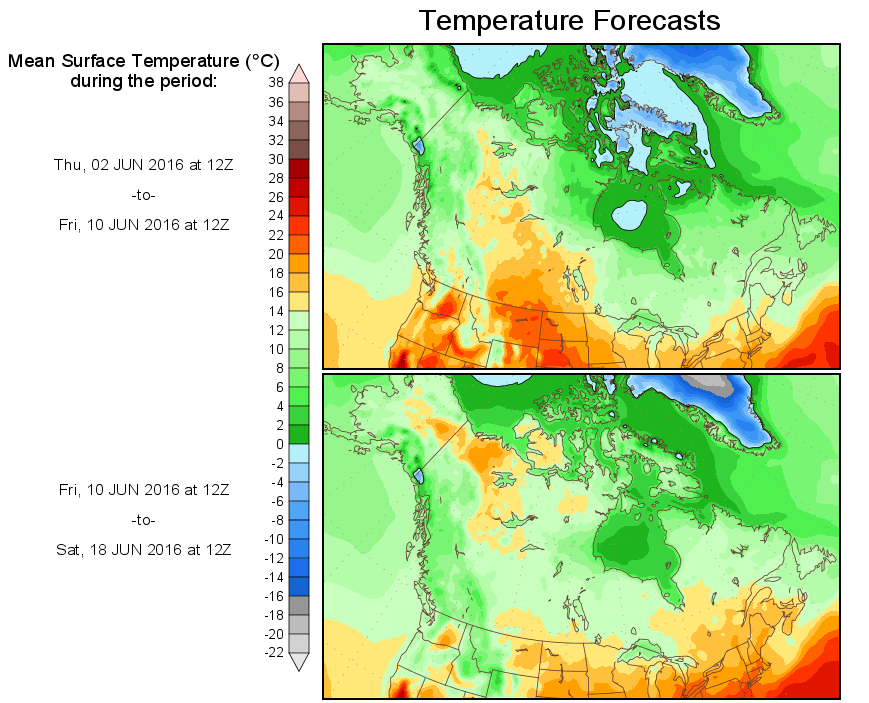
This is not very surprising, because temperatures have been cold over the Arctic Basin, and are not forecast to warm up much during the next two weeks.
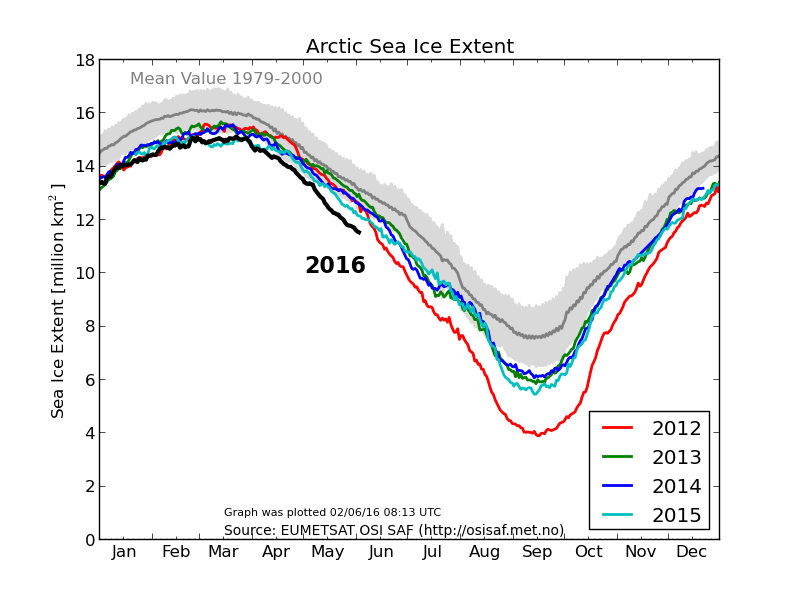
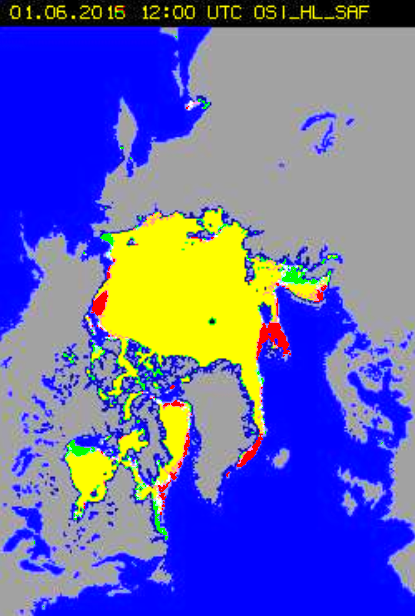
DMi maps also show that there is more ice this year than last year, in direct contradiction to their graphs.
Greenland is struggling to melt this year, also
No grapes this season ;-)
Andy forgot the caption for the graph on the right:
“The graph to the right of the maps shows the percentage of the area of the Greenland ice sheet that has melted every day this season on the blue curve. This can be compared with the dark grey curve that is the average melt area over the period of 1990-2013. The light grey band shows the differences from year to year as the range of each day through this period leaving out the most extreme high and low values each day.”
More useful was the graph above this showing how the Greenland icecap is always at its thickest at the start of June.
http://www.dmi.dk/en/groenland/maalinger/greenland-ice-sheet-surface-mass-budget/
Thanks for drawing that to my attention.
Notice how the blue line in the top pic is right at the top of the grey area… struggling to melt
and in the bottom pic shows no sign of starting to curve downwards… struggling to melt
Thanks for confirming my comment above. :-)
Amazing considering the battering the Arctic has taken from energy released by the El Nino ocean cooling event this year, wouldn’t you say.
——
“this period leaving out the most extreme high and low values each day”
So the latter half of May will be left out of subsequent graphs, is that what you are saying?
Here is what the DMI is saying:
“The light grey band shows the differences from year to year as the range of each day through this period leaving out the most extreme high and low values each day.” They also said “For each calendar day, however, the lowest and highest values of the 24 years have been left out.”
No day will be left out, just the highest and lowest year’s data for that day.
Tony will you be posting new DMI images until September? This is the seventh post since May 24 claiming the Arctic ice isn’t melting, but somehow between May 1 and June 1 the Arctic lost 1.9 million km2 of ice.
For some strange reason I have been pondering that very question too Craig!
In actual fact Tony isn’t posting “DMI images”, he’s posting “Heller hallucinations”. Here’s an alternative visualisation of the actual Arctic facts, in this case from JAXA via the University of Hamburg:
I didn’t say that and normally ban people who misrepresent my position.
The words you used were “very little melt”
In the scheme of things, this is a TOTALLY CORRECT statement.
However you did say “DMI maps also show that there is more ice this year than last year”
In his 5/29/15 post “Trouble Looming For Arctic Alarmists” Tony posted a weather forecast for the Beaufort Sea. Compare last year’s temperature and ice cover to this year.
https://stevengoddard.wordpress.com/2015/05/29/trouble-looming-for-arctic-alarmists/
Here’s Sunday’s temperature forecast for the Arctic. Unlike Tony’s, this one doesn’t exclude most of the Arctic!
http://cci-reanalyzer.org/wxmaps/#ARC-LEA
So Jimbo, STILL trying to push the Arctic sea ice SCARE..
PLEASE say you will stick around over the next few years as Arctic sea ice, unfortunately, expands.
The egg on your face will be so hilarious to watch.
But you won’t, will you.. you will slime back under your rock, like the coward you are.
The long game is VERY MUCH against you, and you KNOW it, don’t you. ;-)
AndyG55:
“The long game is VERY MUCH against you, and you KNOW it, don’t you.”
Mirror, mirror, on the wall…
So, another empty post with zero content..
Doing well, Friar, an improvement on your usual.
All this ice melting and the Russians are building the most powerful ice breakers ever.
Back in 1937 the Hudson bay company managed to send two ships though the North West Passage from either end and exchange cargo- no ice breaker needed.
More ice melting than last year at least! Meanwhile this year Crystal Cruises are planning to send “the very first luxury ship to transit the fabled Northwest Passage” in August, albeit accompanied by “an escort vessel with ice breaking capabilities”:
The Northwest Passage in 2016
“the very first luxury ship to transit the fabled Northwest Passage” in August, albeit accompanied by “an escort vessel with ice breaking capabilities”:
JIm they did the passage in 1937 without ice breakers you point?
Jim , today they have satellite , radar, underwater sonar, special lights to show up ice-
1937 trip- none of the above!!
Richard – The Nascopie “was fitted with an ice breaker bow and her plates were of five-eighths-inch steel. She carried Marconi apparatus located beside the wheelhouse on the upper deck.”
https://en.wikipedia.org/wiki/SS_Nascopie
Amongst other points:
1) There is no causal relationship that I am aware of between the construction of Russian icebreakers and the decline in Arctic sea ice extent this year compared to last.
2) The Crystal Serenity is a 68,870 gross tons luxury cruise ship, not a 1,870 gross tons ice hardened cargo vessel.
A “keen sense of the credibility of sources” you have not.
———-
Criteria to Evaluate the Credibility of WWW Resources
Colorado – For some strange reason your link doesn’t mention either the Crystal Serenity or the Nascopie.
Jim, I am unable to decide if you are dense or very clever and just pretending to be dense.
Everybody else understands I am talking about the information in your link.
And in 1903, without the aid of any nuclear powered ice-breakers, a guy and his crew sailed a wooden ship through the NW Passage.
It will be funny/ hilarious to watch that big cruise ship (with its accompanying ice breakers) that is scamming money from true-believers, as it tries to get through any time in the next few decades.
Turney has nothing on their stupidity.
Hey Jimbo, Craig…. please, please say that you have booked your cabins . :-)
Or maybe even YOU aren’t quite that STUPID , yet. ?
AndyG55:
“And in 1903, without the aid of any nuclear powered ice-breakers, a guy and his crew sailed a wooden ship through the NW Passage.”
I believe I once corrected you or somebody else on this site on this but…
Amundsen took three years to do what could be done now in several weeks with the same type of ship.
Its called “investigating and mapping”, bozo. !!!
They now have satellite images etc etc to guide them through. Amundsen had to find his own way, while he mapped out the coasts.
You truly have NOTHING to contribute, do you, Friar Blow-wind.
I know that “DMI continues to show the Arctic melting” because the current Arctic melting is not “imaginary”.
Tony’s 2015/16 delta maps, on the other hand, contain numerous “imaginary” green pixels. His blatant error has been explained to him numerous times in a variety of different ways, yet still he persists.
Can you see the egg on his face? Hilarious isn’t it?
The egg is ONLY EVER on your face, because you are too cowardly to admit to the real history of Arctic sea ice.
You egg your own face each time you IGNORE THE TRUTH. You must have a massive omelette by now.. or maybe just enough scrambled eggs to feed the whole of the Exeter Uni climate catastrophist crew.
You KNOW that the current levels are nothing but a recover from the LIA…
…but are still trying to push these tiny, trivial, insignificant changes as if they mean something.
Poor Jimbo, ALWAYS too cowardly to admit the truth.
I KNOW that the current levels are lower than at the same time last year.
Why do you and Tony continue to IGNORE THE TRUTH?
Because you are too cowardly to admit it?
Still running and hiding from the truth.
It is what you do..
It is WHO YOU ARE..
a COWARDLY LIAR.
And everybody here KNOWS that.
Here’s a simple question for you Andy.
Is there “more [Arctic sea] ice this year than last year” or not?
“Is there “more [Arctic sea] ice this year than last year” or not?”
The most accurate answer is “who knows?”. The public pronouncements of the official reports are been shown to be unreliable over and over.
If, in fact, it could be shown that the Arctic sea ice is less today than it was last year, would that be weather or climate? If less sea ice in the Arctic supports the idea of CAGW, does more sea ice in the Antarctic support CAGC?
I claimed to know Jason, and it wasn’t on the basis of “the public pronouncements of the official reports” or the public pronouncements of Tony Heller and AndyG!
Your final paragraph is irrelevant to the question, as is AndyG’s infinite supply of ad homs and ancient history.
Still hiding from the truth behind trivial almost unmeasureable difference.
COWARD.
See below, for the job I have set for you and CraigT concerning this graph.
Hey Jason!
Don’t you know Jim claims to know?
And suppose he doesn’t know he’ll google it and then he’ll know!
MASSIVE BENEFITS for Arctic with increase aCO2
https://wattsupwiththat.com/2016/06/03/another-benefit-of-climate-change-the-arctic-is-greening/
The current Arctic sea ice level is somewhere between the near ZERO levels of the most of the first 3/4 of the Holocene, and the massively high levels of the LIA.
Is there ANYONE that disagrees with this ??????
A lot of climatologists would disagree, calling that an exaggeration. There’s evidence that 6000 years ago (mid-Holocene) Northern Baffin Bay was covered in ice for 6 months of the year.
http://www.geo.umass.edu/faculty/jbg/Pubs/Polyak%20etal%20seaice%20QSR10%20inpress.pdf
Yep, in the lower graph you can clearly see the “Neoglaciation” period starting about 3-4k years ago.
Shows up in GISP as well. The coldest period of this “Neoglaciation” was the LIA.
Thanks for confirming everything I said. :-)
GRIP/GISP give a pretty good representation of past Arctic conditions, wouldn’t you say.
Craig, the issue is about SUMMER ice,which has at times earlier in the Holocene been absent and other times just a very small ice pack much less than today’s summers in the Arctic.
Suns, you have BUCKLEY’S CHANCE of ever getting any of these Arctic sea ice Worriers to admit THIS SIMPLE TRUTH that so utterly destroys their baseless PANIC.
add at end…
and SCAREMONGERING.
Their very lives depend on the DENIAL of the truth.
Here is one statement from Dr. Meier on this:
“Can the Arctic really become sea ice-free during summer?
It has been suggested that the Arctic really can’t lose all its sea ice during summer because there isn’t enough energy to melt all of the ice in the short summer. There are a couple of reasons why this thinking is faulty.
First, we know the Arctic can potentially lose all its sea ice during summer because it has done so in the past. Examination of several proxy records (e.g., sediment cores) of sea ice indicate ice-free or near ice-free summer conditions for at least some time during the period of 15,000 to 5,000 years ago (Polyak et al., 2010) when Arctic temperatures were not much warmer than today.
https://wattsupwiththat.com/2010/07/14/nsidcs-dr-walt-meier-part-2/
The LIA did increase sea ice a bit but not to “massively high levels.”
http://www.geo.umass.edu/faculty/jbg/Pubs/Polyak%20etal%20seaice%20QSR10%20inpress.pdf
Of course Craig you have to “believe” we actually “know” what the ice looked like in 1200. The studies you show are best guess studies. Lets stick with the satellite era which began at the beginning of a warm phase of the AMO. A common sense approach would be to wait for the AMO to flip into a cold phase.
The LIA did increase sea ice a bit but not to “massively high levels.”
===
Could that be because it’s pretty much maxed out right now?
Actually Latitude, the current period is probably the first time its been “NEAR NORMAL” (for the Holocene) since the start of the LIA.
That’s the way I see it…
There’s warm currects coming up both sides, so there’s not a lot a room
Jim fails to notice that most of the Arctic basin is filled every winter,except the region between Greenland and Norway, which was largely filled in during the LIA time frame.
He also has so far ignored the Greenland Ice core temperature data showing large swings during the Holocene while CO2 hardly changes at all.
http://c3headlines.typepad.com/.a/6a010536b58035970c01287656565a970c-800wi
Link background here:
http://www.c3headlines.com/2009/12/are-modern-temperatures-unprecedented-us-govt-greenland-ice-core-research-finds-theyre-not-even-clos.html
Ice on Iceland coast…
nuff said..
That 20 weeks a year around the 1800’s
Are you saying that isn’t “massively more” than now?
yet a tiny, almost immeasurable decrease, maybe, from last year….. is somehow significant.
WOW. !!!
He is being irrational.
Irrational…
the hallmark of the AGW alarmista.
or the Arctic sea ice panicker.
He could tell us, rationally, what the proper area and volume of sea ice should be.
And while we are at it, we should also establish the ideal extent of land ice, the correct air temperature, the optimal number of cyclones and hurricanes, the appropriate frequency of heat waves and arctic spells, etc.
And not just some figures out of thin air. Scientifically justified numbers so we can settle it once and for all.
And if he doesn’t get to it, mogur should give it the good old college try.
“He could tell us, rationally, what the proper area and volume of sea ice should be.”
Yep, Come on CraigT or Jimbo the clown, or Mogor..
What SHOULD the current level of Arctic sea ice be.????
What SHOULD the current global temperature be?
Make reference to the whole of the current interglacial.
Will you actually have a try ?
Or will you twist and turn and then slither away like always!
What about Iceland’s climate farther back?
“After 7000 BP and before 4500 BP Solheimajokull [glacier] extended up tp 5 km beyond its present limits. Major advances also culminated before 3100 BP, and between 1400-1200 BP.”
Glaciers and Environmental Change
Johannes Oerlemans
Is it your argument that the glaciers advanced and retreated through various cycles for thousands of years?
Certainly the Swiss ones do..
as do glaciers in the Mt Baker area.
(Image turned on its side so people can see the similarity)
The very fact that human artefacts, tree stumps etc are regularly found as glaciers retreat, as well as often evidence of multiple terminal moraines, shows that there must be some sort of periodicity.
Again..
NOTHING UNUSUAL or UNTOWARD is happening with climate, glaciers, Arctic sea ice , drought, floods, coral bleaching, hurricanes etc etc etc
Yes, Andy, but how does he fit it into the “extreme and unprecedented” narrative?
CW..
Basically by IGNORING anything before 1979 or the LIA…
you know…. like Jimbo does.
After years on this site and others trying to study this I am concluding that as most times the truth is in the middle…but once humans take sides they have an almost impossible hurdle to accept anything but what they have been led to believe or have been preaching…
there is no dout that there has been some man made global warming….thats common sense…but..a very small amount in the larger scheme of things….
And once we have so concluded, do we believe that this “very small amount” of “man made global warming” can be measured and identified amidst the noise?
If so, how?
If not, how did we conclude it exists? and how come there is no doubt?
I am truly puzzled by the conclusion and by the claimed certainty.
“there has been some man made global warming….thats common sense”
There is definitely some local urban warming that has fed through majorly to the calculated so-called “global” surface temperatures…
and most probably some local changes due to land use, clearing, reforestation, reduction of real air pollution etc etc
But I doubt very much that has ANY affect on the real global temperature.
The list I have posted elsewhere basically proves that to be the case…
… in that there is absolute NO CO2 warming signal in the whole of the satellite data.
craig t; looks like a trend starting in 1880 or so. Would that be a result of CO2?
A job for CraigT or Jimbo, since they are ONLY interested in the posy 1979 period.
Below is a graph of occurrence of Arctic sea ice on the coast of Iceland..
Your job, is to complete the final bar from 1980-2000.
I suspect you will find that it is the first period since the start of the LIA that the Arctic Sea Ice level has got back to “NORMAL”
You can see the dip from 1920-1960, (when someone managed to cross the NW passage unaided) getting back towards normal, then the PEAK from 1960-1980.
Arctic sea ice has never really RECOVERED from the LIA , has it.
UNTIL NOW
At the risk of repeating myself Andy.
Is there “more [Arctic sea] ice this year than last year” or not?
Depends on how its measured, maybe a very small insignificant amount. That’s how trivial and irrelevant the question is.
Now, are you going to keep running and hiding from the FACT that Arctic sea ice is still anomalously HIGH compared to most of the Holocene?
I suspect you are.. its ALL YOU HAVE EVER DONE
RUN and HIDE…….
AVOID THE TRUTH
Protect the MONUMENTAL LIE, that there is a problem with currents sea ice levels.
The difference is very small,which Satellites that doesn’t fully resolve.
Jørgen Peder Steffensen (from Andy’s Vimeo link) makes it clear that Iceland and Greenland’s climate depends on the Gulf current. “During Greenland cold phases, the thermohaline circulation is reduced, northern sea ice extends far south and the ITCZ is shifted southward.” Iceland was warmer from 800 – 122 AD than the LIA. But Icelandic glaciers were larger before that. “[T]he eastern flank of Sólheimajökull reached the outer most moraines at AD 56, thereafter it retreated to the second outer most moraine at AD 91. Thus confirming that Sólheimajökull was much larger during the Holocene, than any time of the LIA.”
http://users.clas.ufl.edu/rrusso/gly6932/steffensen_etal_science08.pdf
http://skemman.is/stream/get/1946/7407/19823/1/Bjarki_Friis_master_thesis_ready_for_printing_V3.pdf
Iceland warmed during the Medieval Warm Period but not the entire Atlantic. “Complimentary paleoclimate proxy data suggest that the western North Atlantic region remained cool, whereas the eastern North Atlantic region was comparatively warmer during the MWP—a dipole pattern compatible with a persistent positive phase of the North Atlantic Oscillation.” Climate shifts in Iceland were not seen across the Arctic, much less worldwide.
http://advances.sciencemag.org/content/1/11/e1500806.full
Either that, or run away, and only come back once someone does Amundsens’s trip, UNAIDED by nuclear powered ice breakers.
Ever heard of Tara?
http://oceans.taraexpeditions.org/en/jdb/the-northern-sea-route-and-the-northwest-passage-135-years-of-navigation-history/
roflmao.. you fell straight into it..
yes.. the NW passage has finally opened again after how many years?.
You are such a putz, Jimbo. :-)
“It was not until 2003 that Eric Brossier and France Pinczon du Sel aboard the French sailboat Vagabond managed the feat in two seasons without wintering.”
Wow, so from 1920 – 2003, NO-ONE managed the MW Passage…
Now WHY would that be, Jimbo ;-)
typo….. NW Passage.. obviously
There were a couple trips in the 1940’s too:
Henry Larsen: the man, his life
http://www.polarsea360.com/episodes/03/
Scroll a way down to reach the article.
He was lucky that 1940 was just about the peak of the AMO, like the last few years have been.
On the “ice around Iceland” chart, you can see the dip between 1920 to 1960, then the big jump in sea ice around Iceland after that.
But the AMO is now heading back down.
As Tommy has succinctly pointed out, you evidently can’t tell Caleb’s posterior from your own elbow regarding the history of the Northwest Passage. Now WHY would that be Andy?
Ever heard of the Polar Sea?
https://en.wikipedia.org/wiki/1985_Polar_Sea_controversy
Seriously funny , Jimbo lives up to his CLOWN title with another load of baseless misdirection.
Run and find another excuse, slimo. !!
The children here who think 1979 onwards is the ONLY history, should look up the term “Neoglaciation”
And view this video, from REAL scientists.
https://vimeo.com/14366077
And the imaginary arctic sea ice increase from last year is a ‘melt-up’?
No, that will happen over the next few years.
Stick around , bring a rag to mop the egg off your face.
Can you really dither pixels to the point of disagreeing with every, single, solitary country in the world that claims that arctic sea ice is less than this year, on this date, by far? Are you a genius at dithered pixel counting, without bias and dishonesty? I say no. You are trying to authenticate bullshit.
Tony’s post is about Arctic ice conditions in the last year but that’s not what anyone wants to talk about. When Creationists do it it’s called the “Gish Gallop.” I just came for the low hanging fruit to show the DMI is not committing fraud. As fun as it is to research climate I don’t have time to argue every point Andy can raise.
When “Skeptics” do it the name remains the same:
https://youtu.be/12nYRa8PTzo
When alarmist chicken out and refuse to admit the truth.
Its call COWARDICE !!!
Jimbo reeks of it.