
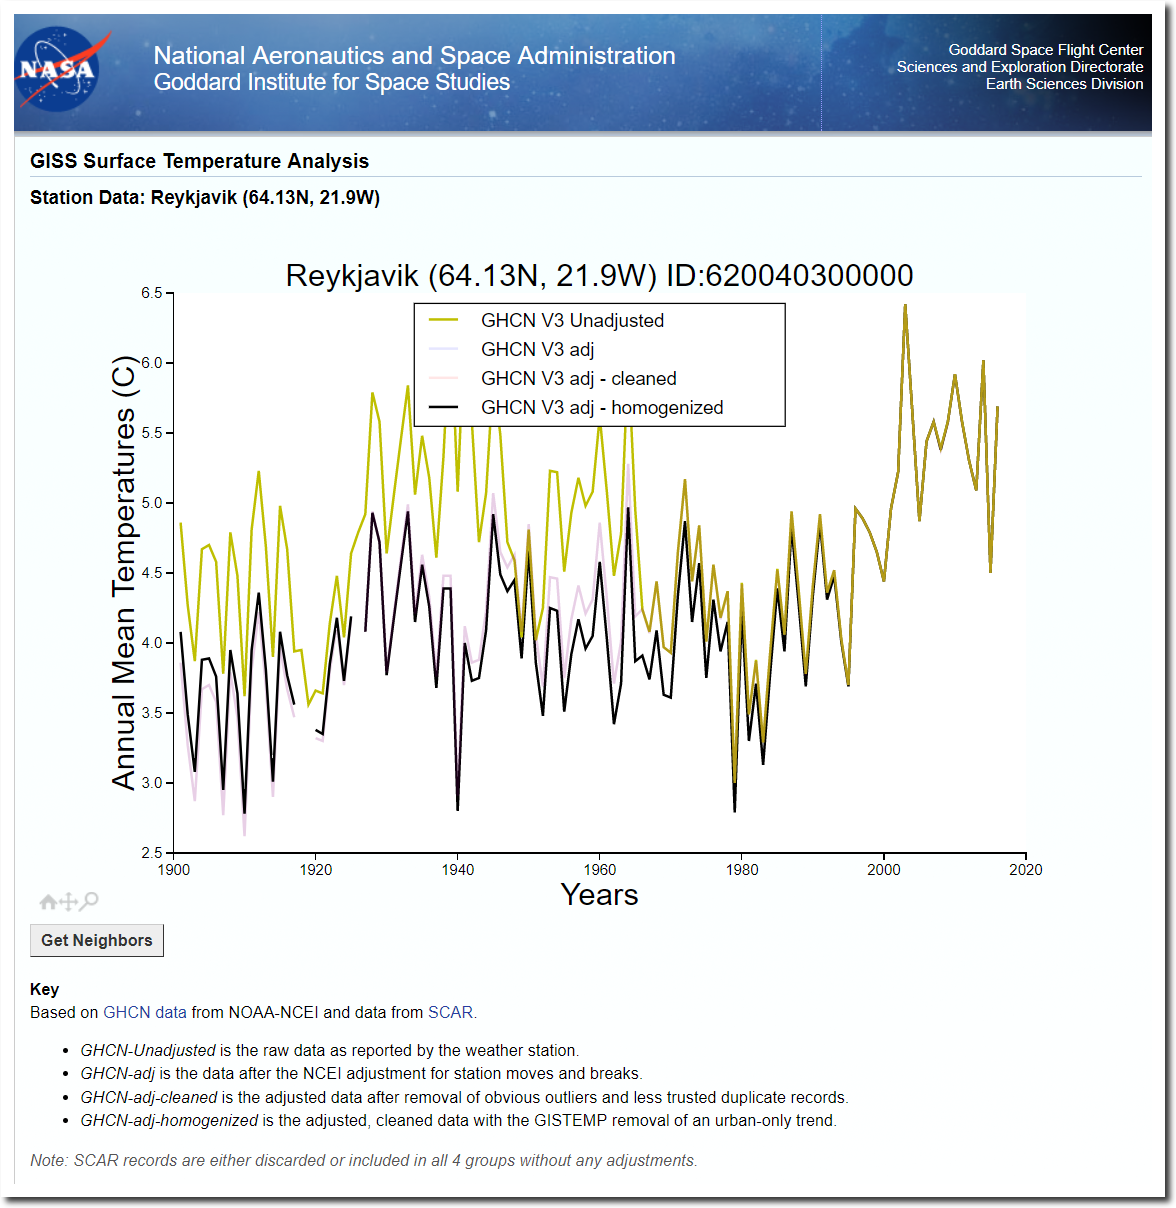
NASA and NOAA have massively altered the Reykjavik, Iceland temperature record over and over again, and have done it yet again – for at least the second time this year. The graph below is the actual data which shows that the 1940’s were warmer than recent years.
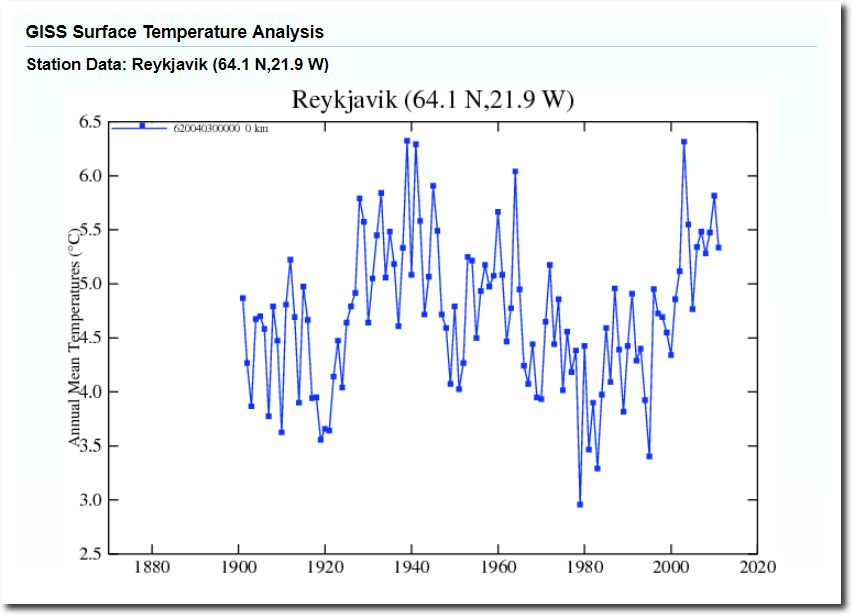
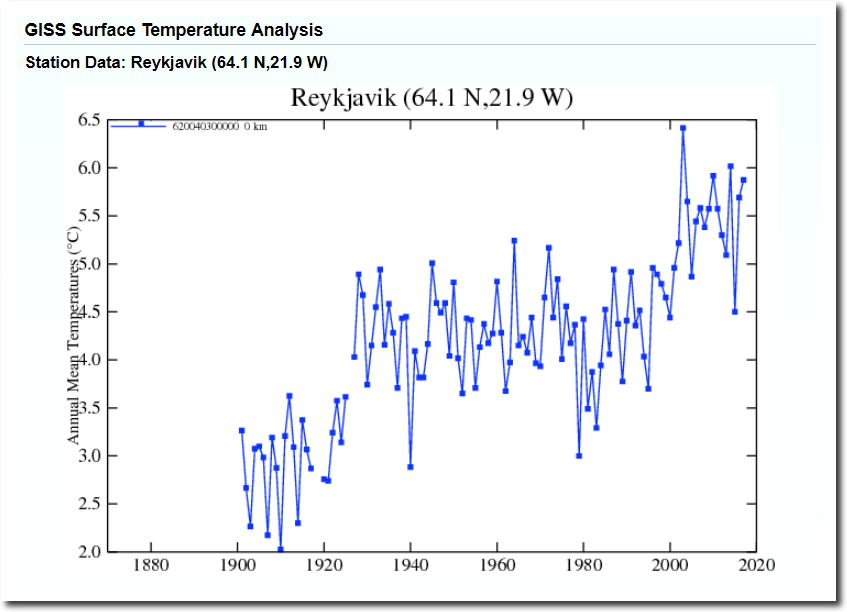
However, the adjusted data from the same data set shows something very different. The 1940’s warmth has been removed, just as Senator Roberts charged.
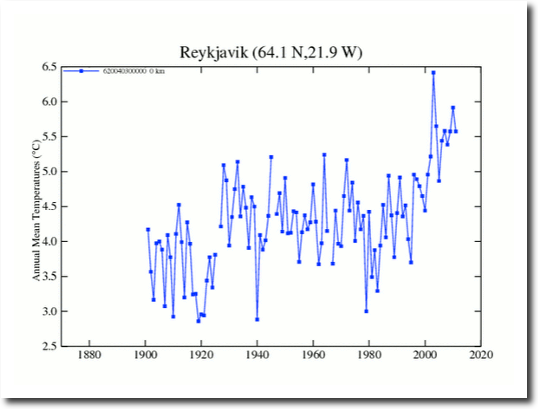
Here is another version of the NASA adjusted graph which was captured in 2012. It is different from the previous two versions.
And another version from 2014 – again different from the previous three versions, but with the 1940’s warmth removed.
A fifth version was captured during October last year, with the 1940’s warmth still removed in their final, homogenized data. Note that this was almost one year after Senator Roberts wrote his letter to NASA, and that it shows exactly what Senator Roberts charged.
October 2017 V3 Measured Vs Homogenized
The current NASA adjusted temperature graph still shows the 1940’s warmth removed.
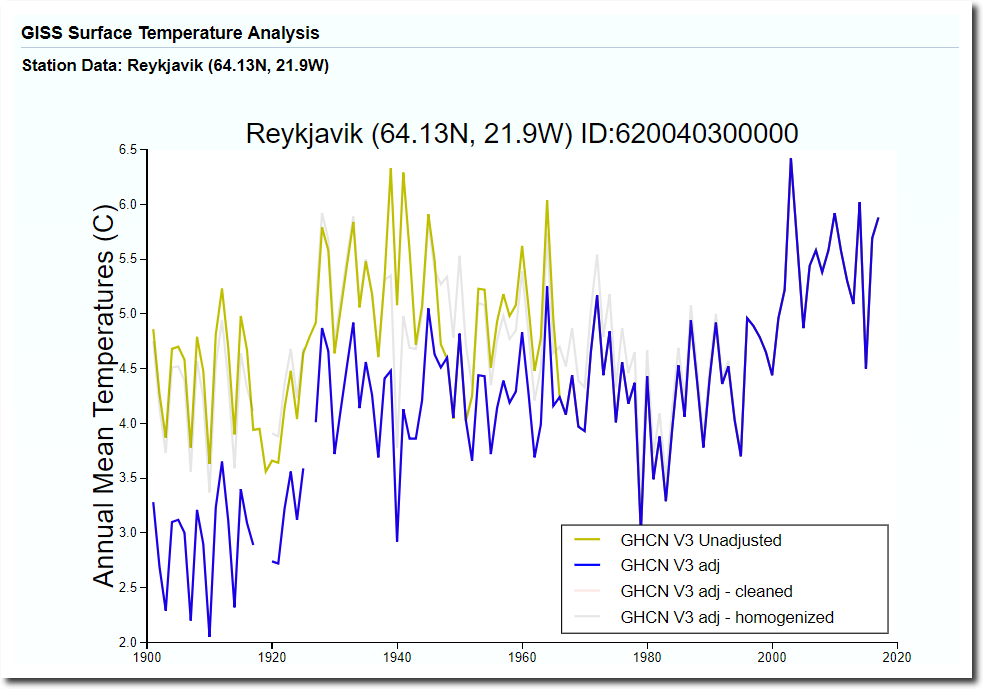
May 2018 Measured Vs. Adjusted
The May NASA homogenized graph restored most of the 1940’s warmth – indicating that there was never any reason to tamper with the data.
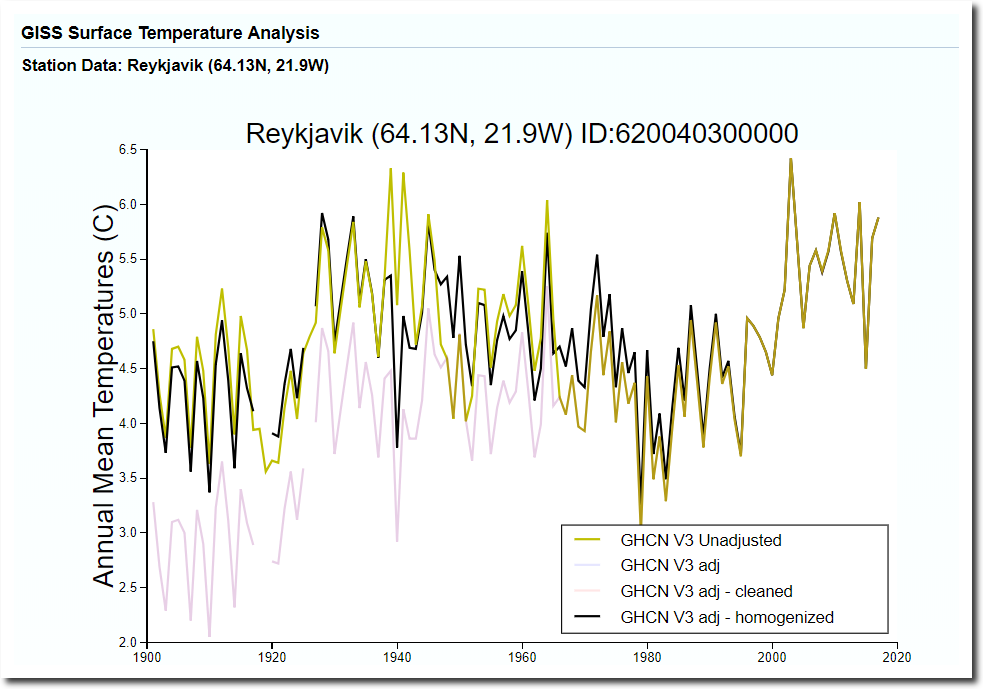
May 2018 Measured Vs. Homogenized
But the July, 2018 temperature graph has returned to their prior fraudulent version.
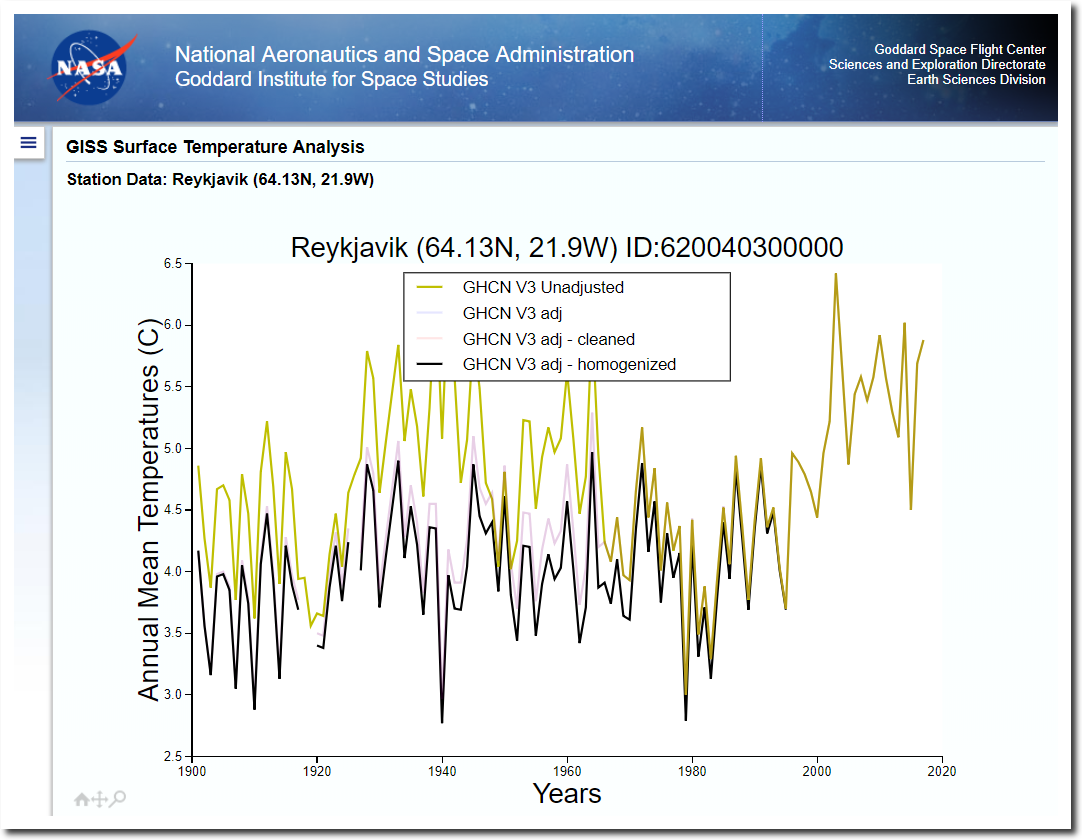
July 2018 Measured Vs. Homogenized
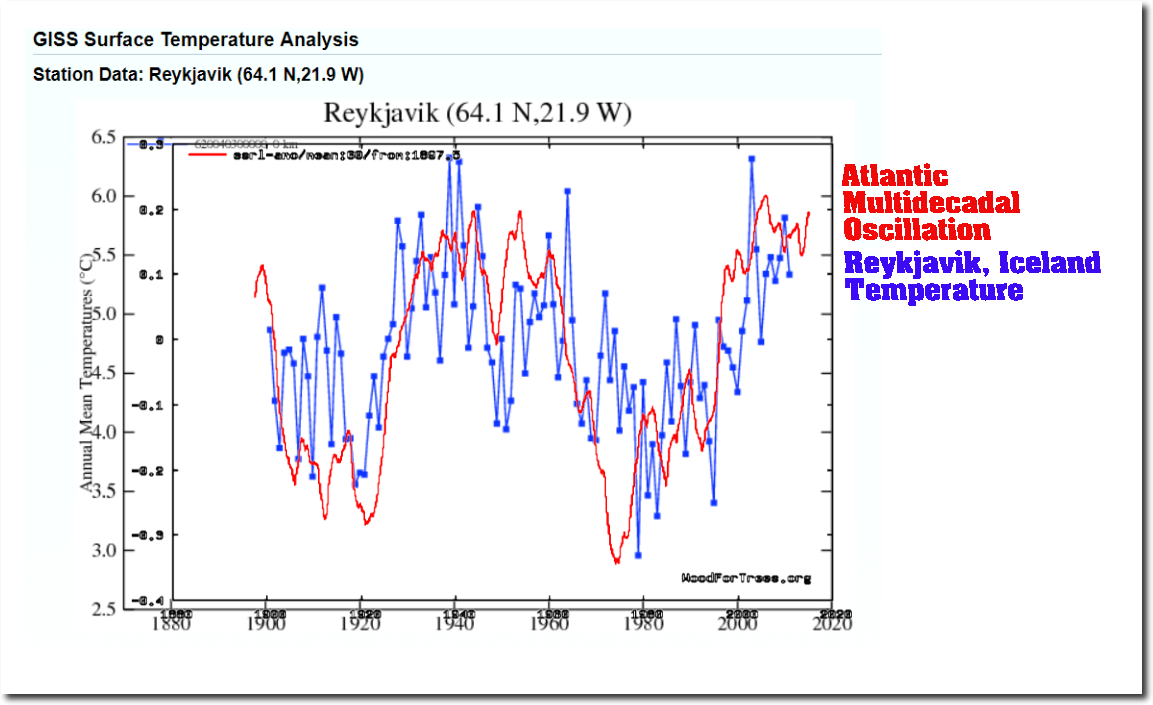
The reason it is so important for climate scientists to make the 1940’s warmth disappear, is that it shows what actually drives the climate – and destroys their multi-billion dollar scam.
